The same plot in 14 other libraries — JavaScript: Chart.js, D3.js, Apache ECharts, Highcharts; Python: Altair, Bokeh, lets-plot, Matplotlib, Plotly, plotnine, Pygal, Seaborn; R: ggplot2; Julia: Makie.jl. Compare all 15 side by side: Stock Price Comparison Chart in Python, R, Julia and JavaScript.
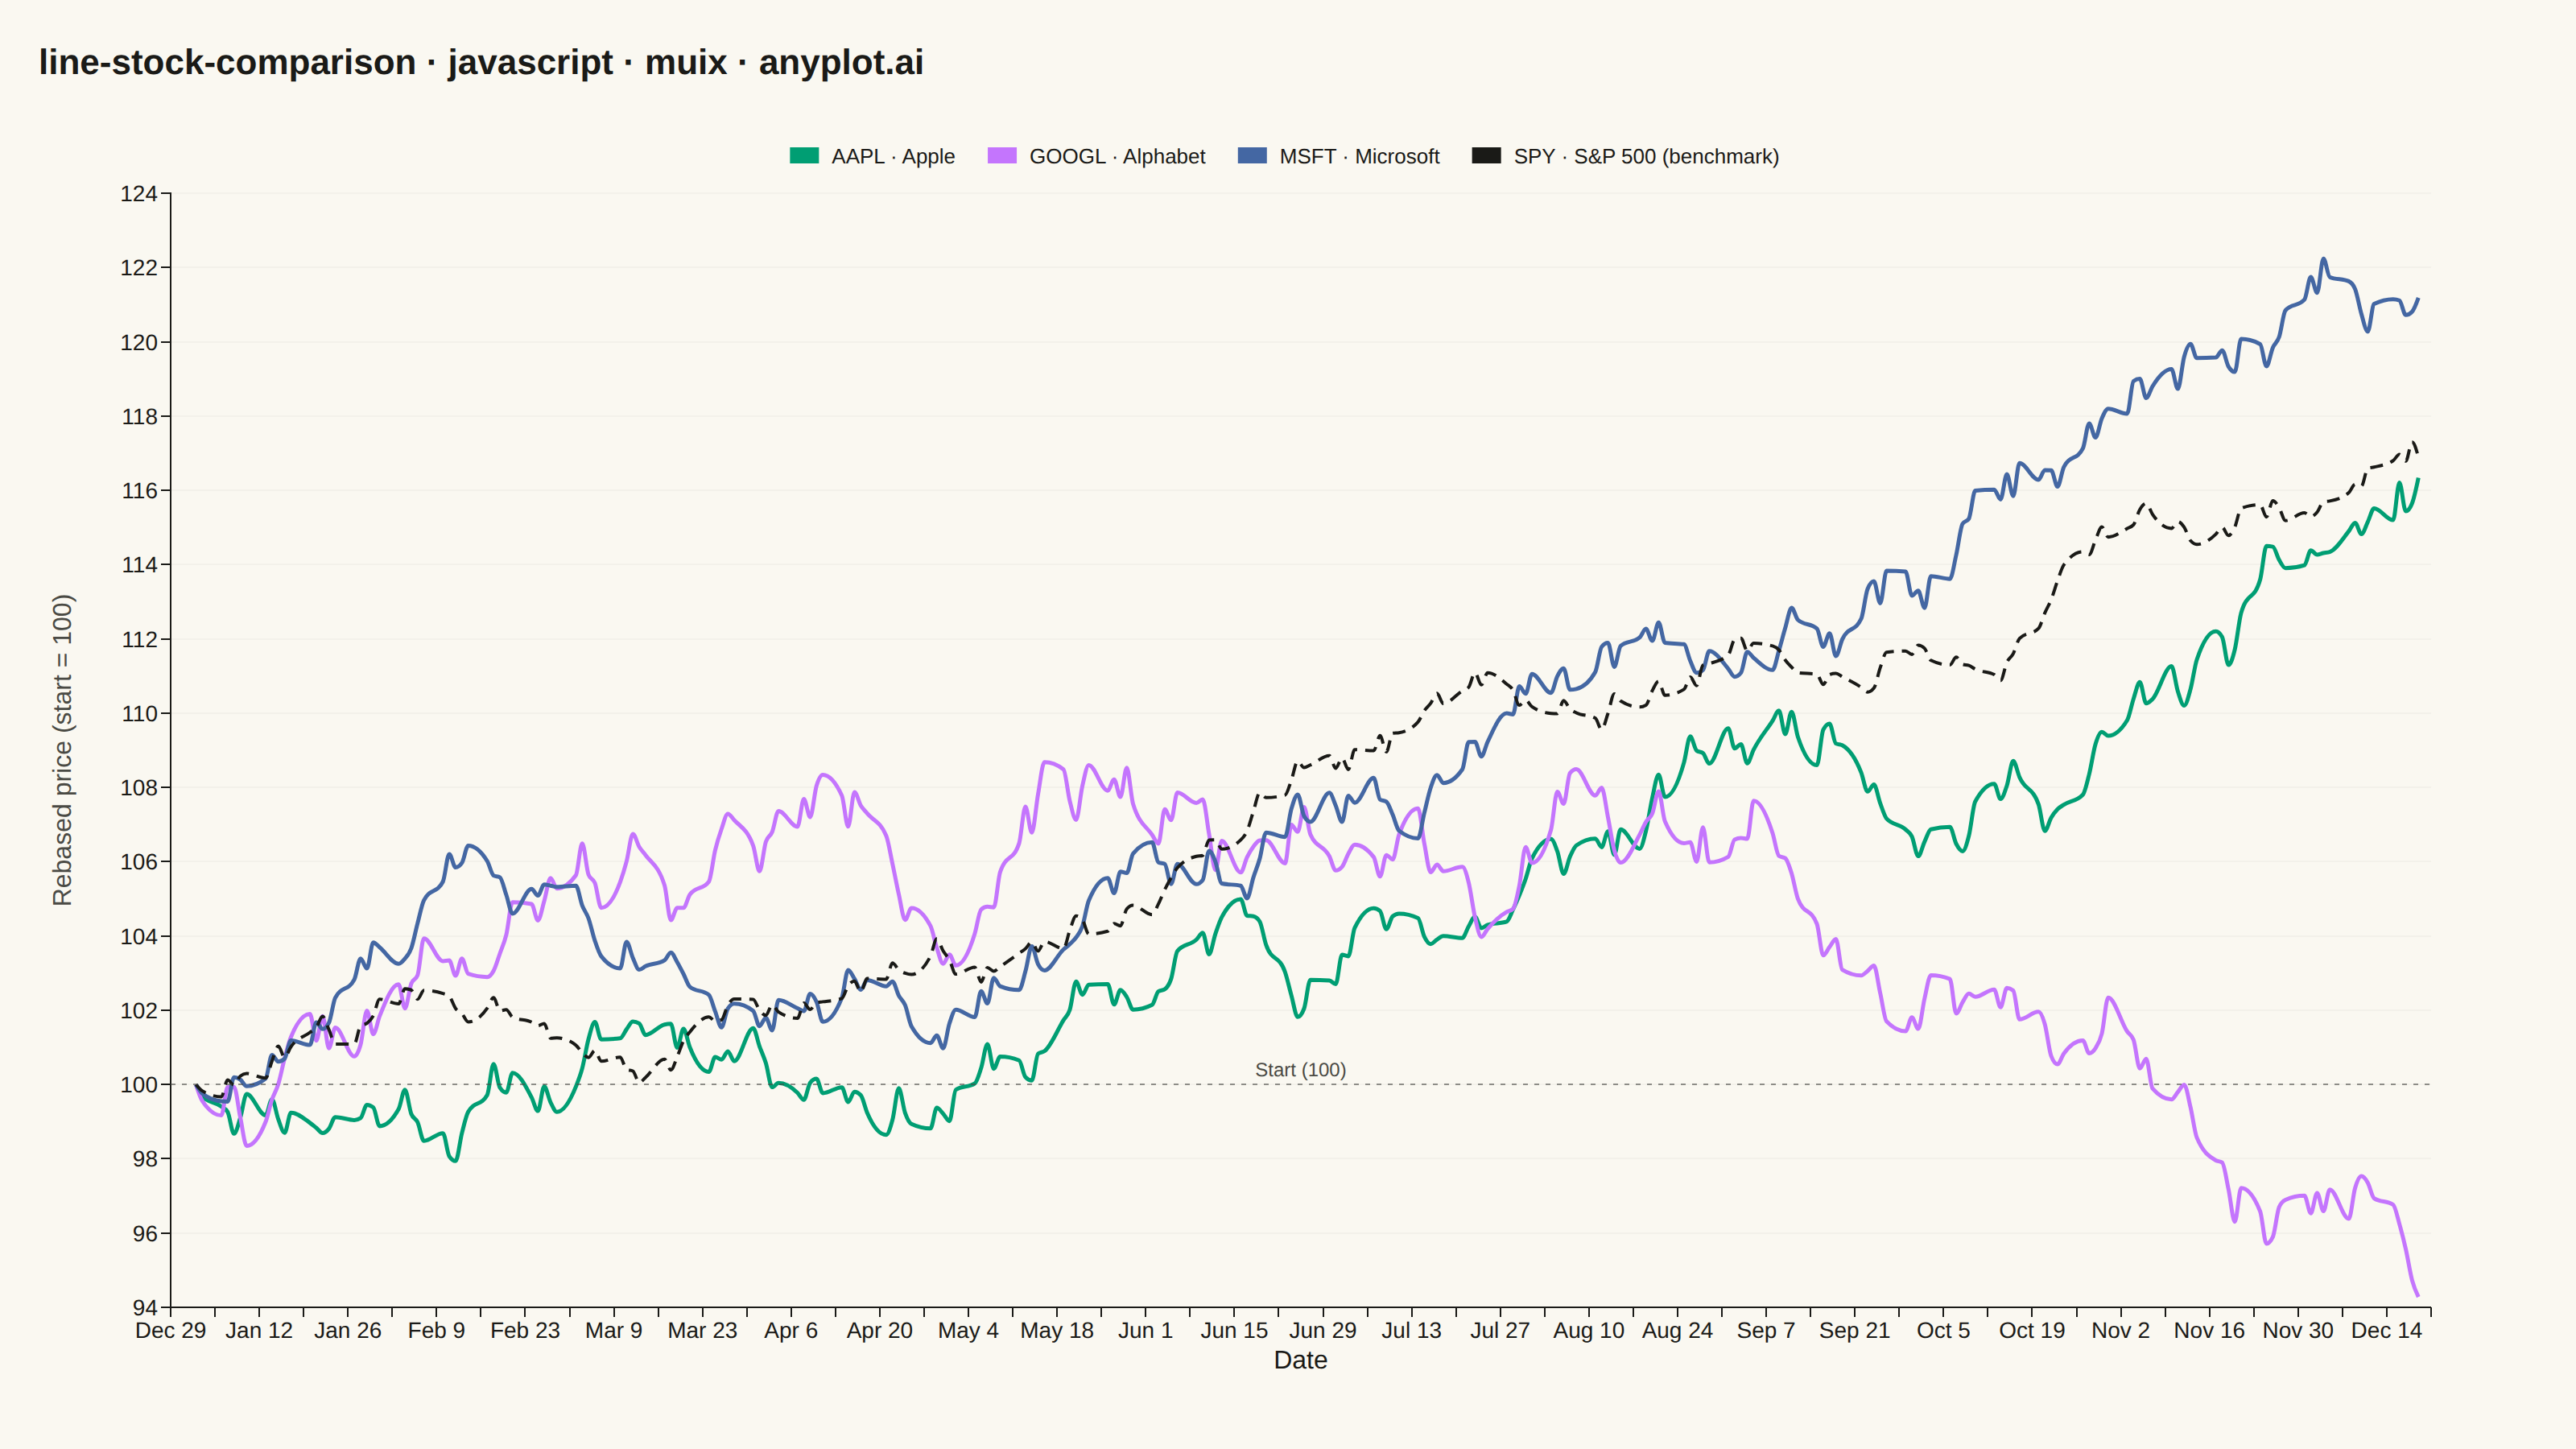
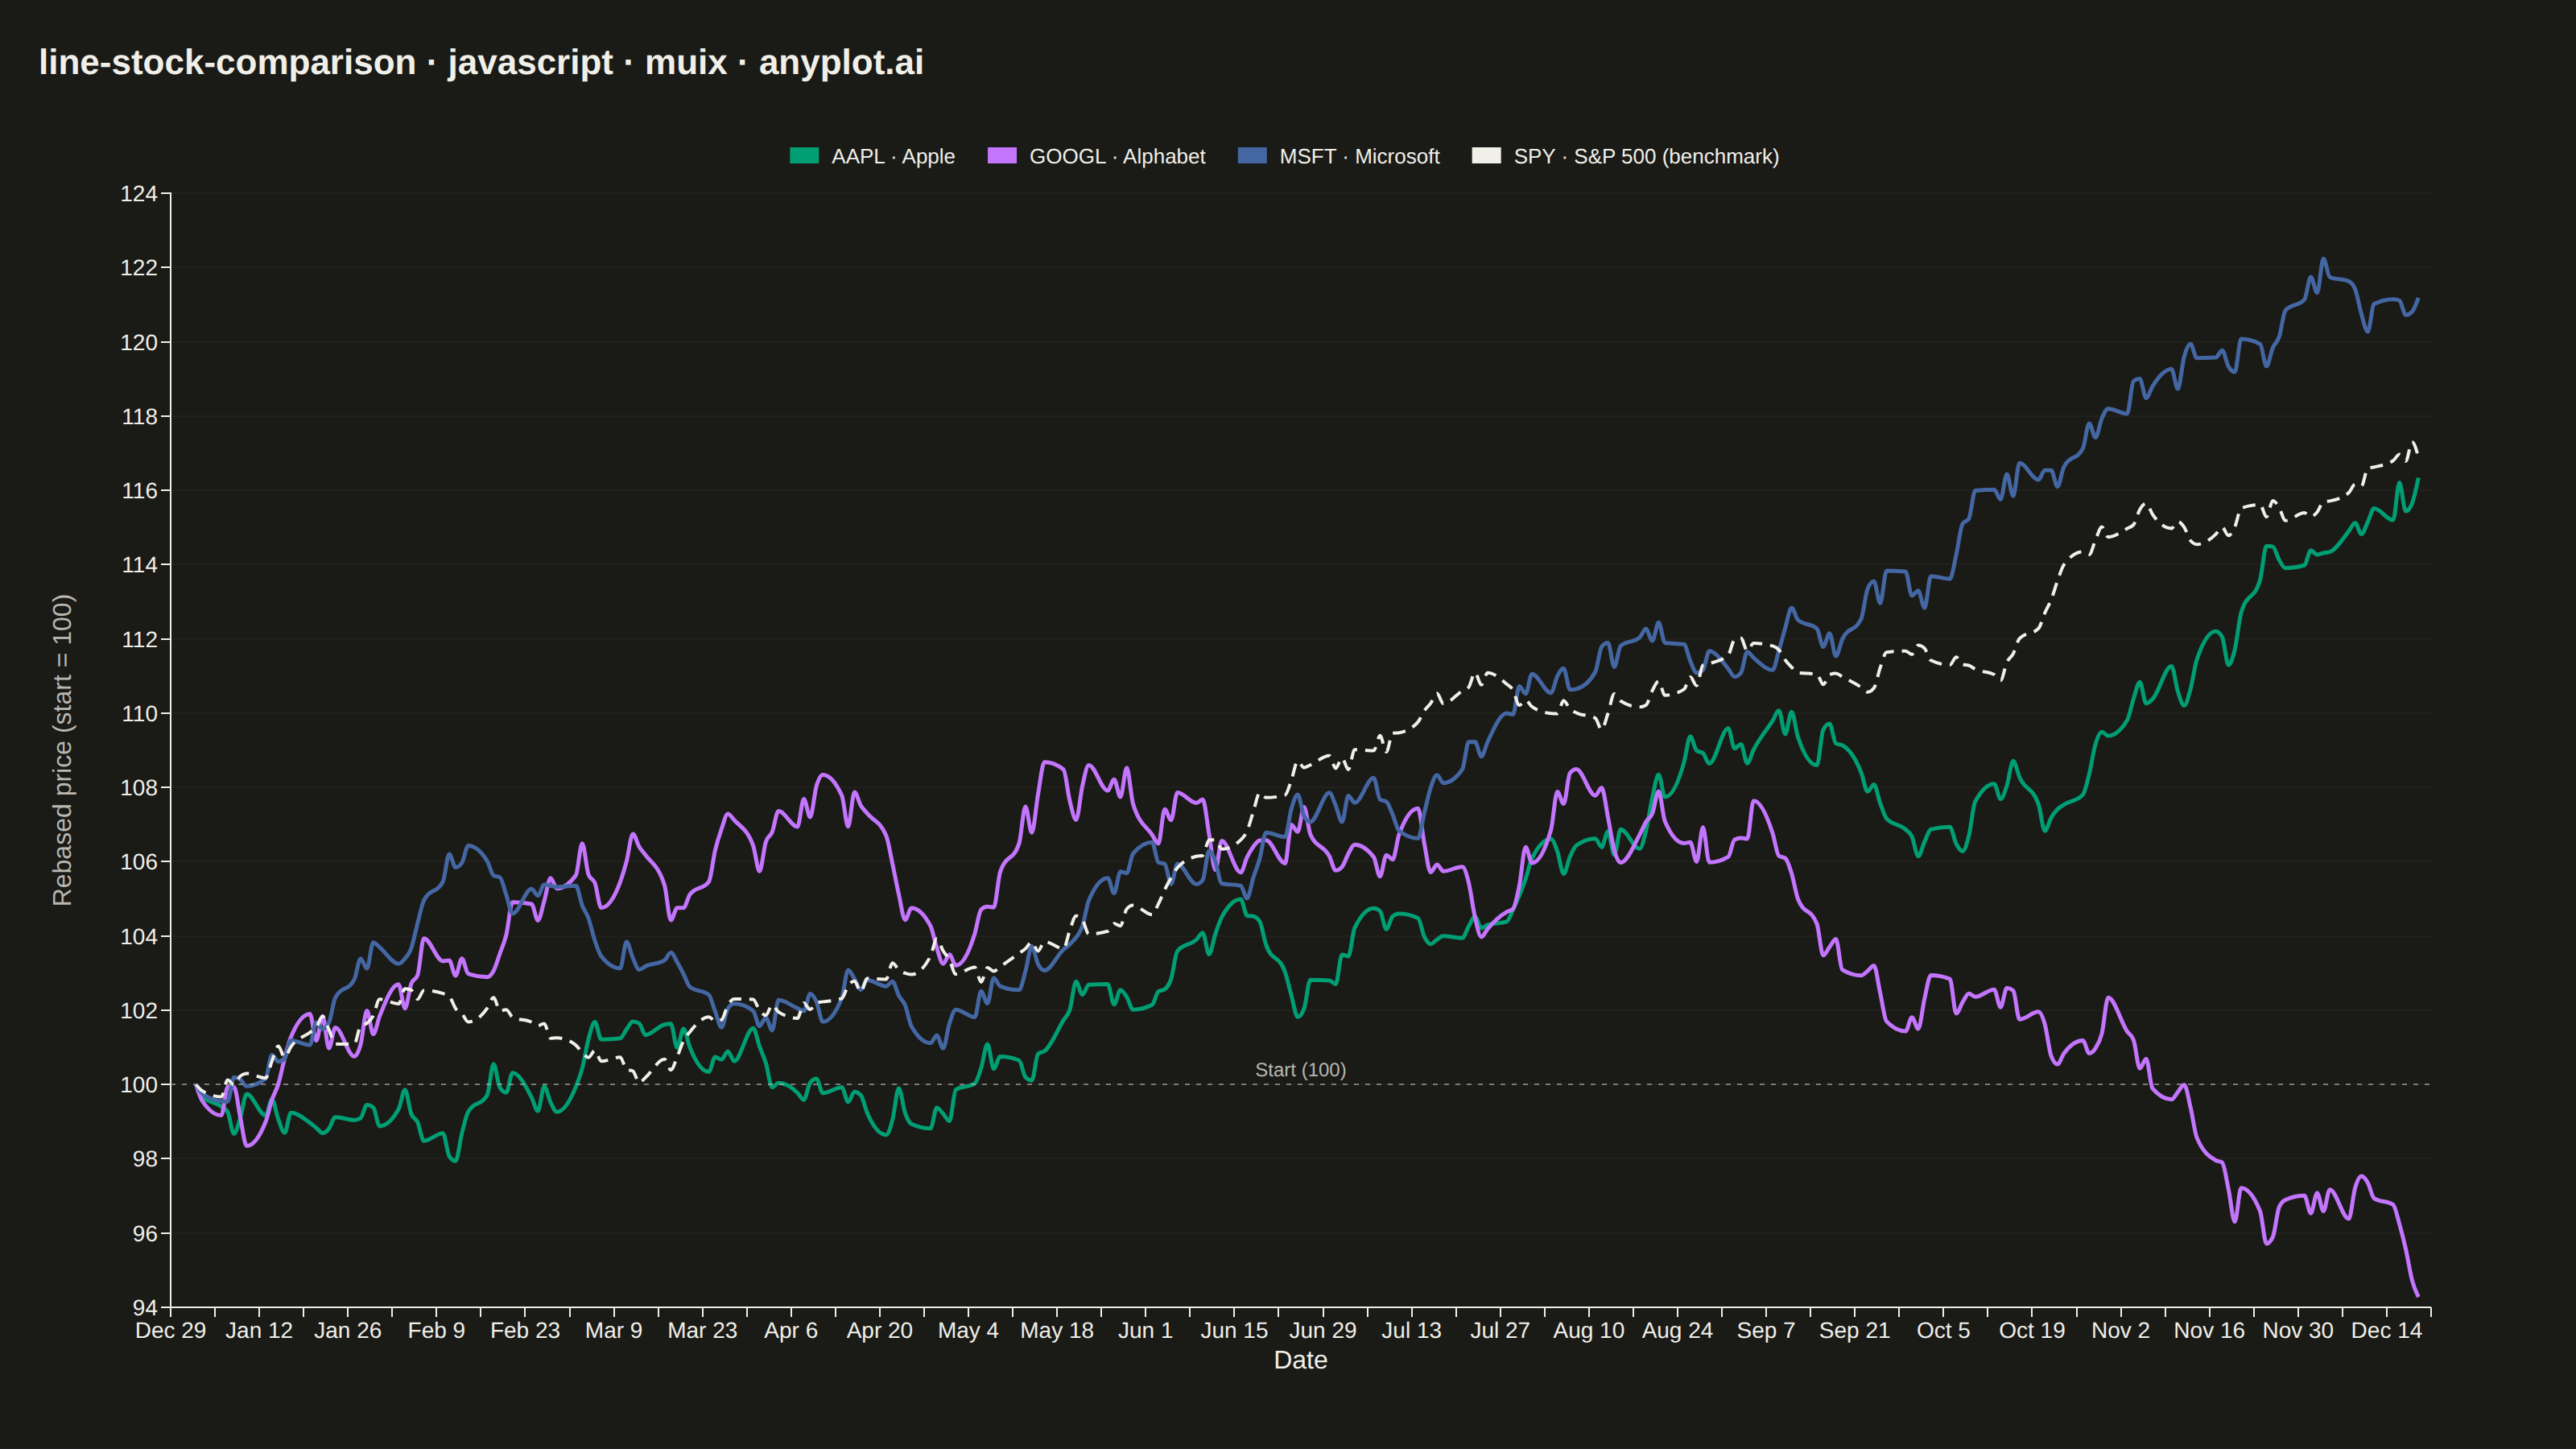
A multi-line chart comparing multiple stock price series normalized to a common starting point (rebased to 100) for direct performance comparison over time. By rebasing all series to the same initial value, investors can easily compare relative returns regardless of absolute price differences. This visualization reveals which stocks outperformed or underperformed relative to each other, making it essential for portfolio analysis and benchmark comparisons.
// anyplot.ai
// line-stock-comparison: Stock Price Comparison Chart
// Library: muix 7.29.1 | JavaScript 22.23.2
// Quality: 91/100 | Created: 2026-08-26
import { LineChart } from "@mui/x-charts/LineChart";
import { ChartsReferenceLine } from "@mui/x-charts/ChartsReferenceLine";
import { Box, Typography } from "@mui/material";

const t = window.ANYPLOT_TOKENS;

// --- Data (in-memory, deterministic) ----------------------------------------
// One trading year (~252 sessions, weekends skipped) of three growth stocks
// plus the S&P 500 ETF (SPY) as a passive benchmark, all rebased to 100 at
// the first session so relative performance reads directly off the y-axis.
const NUM_SESSIONS = 252;
const START_DATE = new Date(2025, 0, 2);

const tradingDates = [];
const cursor = new Date(START_DATE);
while (tradingDates.length < NUM_SESSIONS) {
  const weekday = cursor.getDay();
  if (weekday !== 0 && weekday !== 6) tradingDates.push(new Date(cursor));
  cursor.setDate(cursor.getDate() + 1);
}

// Small fixed-seed LCG — the browser has no seeded RNG.
const makeLcg = (seed) => {
  let state = seed >>> 0;
  return () => {
    state = (state * 1664525 + 1013904223) >>> 0;
    return state / 4294967296;
  };
};

const buildPriceSeries = (startPrice, dailyDrift, dailyVolatility, seed) => {
  const rng = makeLcg(seed);
  const prices = [startPrice];
  for (let i = 1; i < NUM_SESSIONS; i += 1) {
    const dailyReturn = dailyDrift + (rng() - 0.5) * dailyVolatility;
    prices.push(prices[i - 1] * (1 + dailyReturn));
  }
  return prices;
};

const rebaseToHundred = (prices) =>
  prices.map((price) => (price / prices[0]) * 100);

const stocks = [
  {
    symbol: "AAPL",
    name: "Apple",
    startPrice: 182,
    drift: 0.0009,
    volatility: 0.016,
    seed: 11,
  },
  {
    symbol: "GOOGL",
    name: "Alphabet",
    startPrice: 141,
    drift: 0.0004,
    volatility: 0.019,
    seed: 22,
  },
  {
    symbol: "MSFT",
    name: "Microsoft",
    startPrice: 378,
    drift: 0.0011,
    volatility: 0.014,
    seed: 33,
  },
].map((stock) => ({
  ...stock,
  rebased: rebaseToHundred(
    buildPriceSeries(
      stock.startPrice,
      stock.drift,
      stock.volatility,
      stock.seed,
    ),
  ),
}));

const benchmark = {
  symbol: "SPY",
  name: "S&P 500 (benchmark)",
  rebased: rebaseToHundred(buildPriceSeries(468, 0.0005, 0.009, 44)),
};

const TITLE = "line-stock-comparison · javascript · muix · anyplot.ai";

// --- Chart (default-exported component — the harness mounts it) ------------
export default function Chart() {
  const size = window.ANYPLOT_SIZE;
  const padding = { top: 28, right: 40, bottom: 24, left: 24 };
  const titleBlockHeight = 56;
  // MUI X's y-axis `label` prop offsets from a hardcoded tick-width guess
  // rather than the real measured width of 3-digit tick labels, so it
  // collides with them. A hand-rotated label in its own column sidesteps
  // that and gives predictable, collision-free spacing.
  const yLabelWidth = 32;
  const chartWidth = size.width - padding.left - padding.right - yLabelWidth;
  const chartHeight =
    size.height - padding.top - padding.bottom - titleBlockHeight;

  return (
    <Box
      sx={{
        width: size.width,
        height: size.height,
        boxSizing: "border-box",
        padding: `${padding.top}px ${padding.right}px ${padding.bottom}px ${padding.left}px`,
        display: "flex",
        flexDirection: "column",
      }}
    >
      <Typography
        sx={{
          fontSize: 22,
          fontWeight: 600,
          color: "text.primary",
          mb: "20px",
          lineHeight: 1,
        }}
      >
        {TITLE}
      </Typography>
      <Box sx={{ display: "flex", flexDirection: "row", height: chartHeight }}>
        <Box
          sx={{
            width: yLabelWidth,
            display: "flex",
            alignItems: "center",
            justifyContent: "center",
          }}
        >
          <Typography
            sx={{
              fontSize: 16,
              color: "text.secondary",
              whiteSpace: "nowrap",
              transform: "rotate(-90deg)",
            }}
          >
            Rebased price (start = 100)
          </Typography>
        </Box>
        <LineChart
          width={chartWidth}
          height={chartHeight}
          skipAnimation
          series={[
            ...stocks.map((stock, index) => ({
              id: stock.symbol,
              label: `${stock.symbol} · ${stock.name}`,
              data: stock.rebased,
              showMark: false,
              color: t.palette[index],
              curve: "monotoneX",
              valueFormatter: (v) => `${v.toFixed(1)}`,
            })),
            {
              id: benchmark.symbol,
              label: `${benchmark.symbol} · ${benchmark.name}`,
              data: benchmark.rebased,
              showMark: false,
              color: t.ink,
              curve: "monotoneX",
              valueFormatter: (v) => `${v.toFixed(1)}`,
            },
          ]}
          xAxis={[
            {
              data: tradingDates,
              scaleType: "time",
              label: "Date",
              valueFormatter: (date) =>
                date.toLocaleDateString("en-US", {
                  month: "short",
                  day: "numeric",
                }),
              tickLabelStyle: { fontSize: 14 },
              labelStyle: { fontSize: 16 },
            },
          ]}
          yAxis={[
            {
              tickLabelStyle: { fontSize: 14 },
            },
          ]}
          grid={{ horizontal: true }}
          slotProps={{
            legend: {
              direction: "row",
              labelStyle: { fontSize: 13 },
              itemMarkWidth: 18,
              itemMarkHeight: 10,
              markGap: 8,
              itemGap: 20,
            },
          }}
          sx={{
            "& .MuiLineElement-root": { strokeWidth: 2.5 },
            [`& .MuiLineElement-series-${benchmark.symbol}`]: {
              strokeWidth: 2,
              strokeDasharray: "8 5",
            },
            "& .MuiChartsGrid-line": { stroke: t.grid, strokeOpacity: 0.2 },
          }}
        >
          <ChartsReferenceLine
            y={100}
            lineStyle={{
              stroke: t.inkSoft,
              strokeDasharray: "3 4",
              strokeOpacity: 0.6,
            }}
            label="Start (100)"
            labelStyle={{ fontSize: 12, fill: t.inkSoft }}
          />
        </LineChart>
      </Box>
    </Box>
  );
}
Runnable source as JSON, for any HTTP client: https://api.anyplot.ai/specs/line-stock-comparison/muix/code. Any spec id and library id listed in llms-full.txt fit the same URL shape; every URL below is complete and callable.
{
  "spec_id": "line-stock-comparison",
  "language": "javascript",
  "library": "muix",
  "page": "https://anyplot.ai/line-stock-comparison/javascript/muix",
  "hub": "https://anyplot.ai/line-stock-comparison",
  "code_json": "https://api.anyplot.ai/specs/line-stock-comparison/muix/code",
  "spec_json": "https://api.anyplot.ai/specs/line-stock-comparison",
  "render_light_png": "https://storage.googleapis.com/anyplot-images/plots/line-stock-comparison/javascript/muix/plot-light.png",
  "render_dark_png": "https://storage.googleapis.com/anyplot-images/plots/line-stock-comparison/javascript/muix/plot-dark.png",
  "interactive_light_html": "https://storage.googleapis.com/anyplot-images/plots/line-stock-comparison/javascript/muix/plot-light.html",
  "interactive_dark_html": "https://storage.googleapis.com/anyplot-images/plots/line-stock-comparison/javascript/muix/plot-dark.html",
  "quality_score": 91.0,
  "license": "MIT",
  "guide": "https://anyplot.ai/llms.txt"
}
Part of Stock Price Comparison Chart on anyplot.ai.