The same plot in 14 other libraries — JavaScript: Chart.js, D3.js, Highcharts, MUI X Charts; Python: Altair, Bokeh, lets-plot, Matplotlib, Plotly, plotnine, Pygal, Seaborn; R: ggplot2; Julia: Makie.jl. Compare all 15 side by side: Stock Price Comparison Chart in Python, R, Julia and JavaScript.
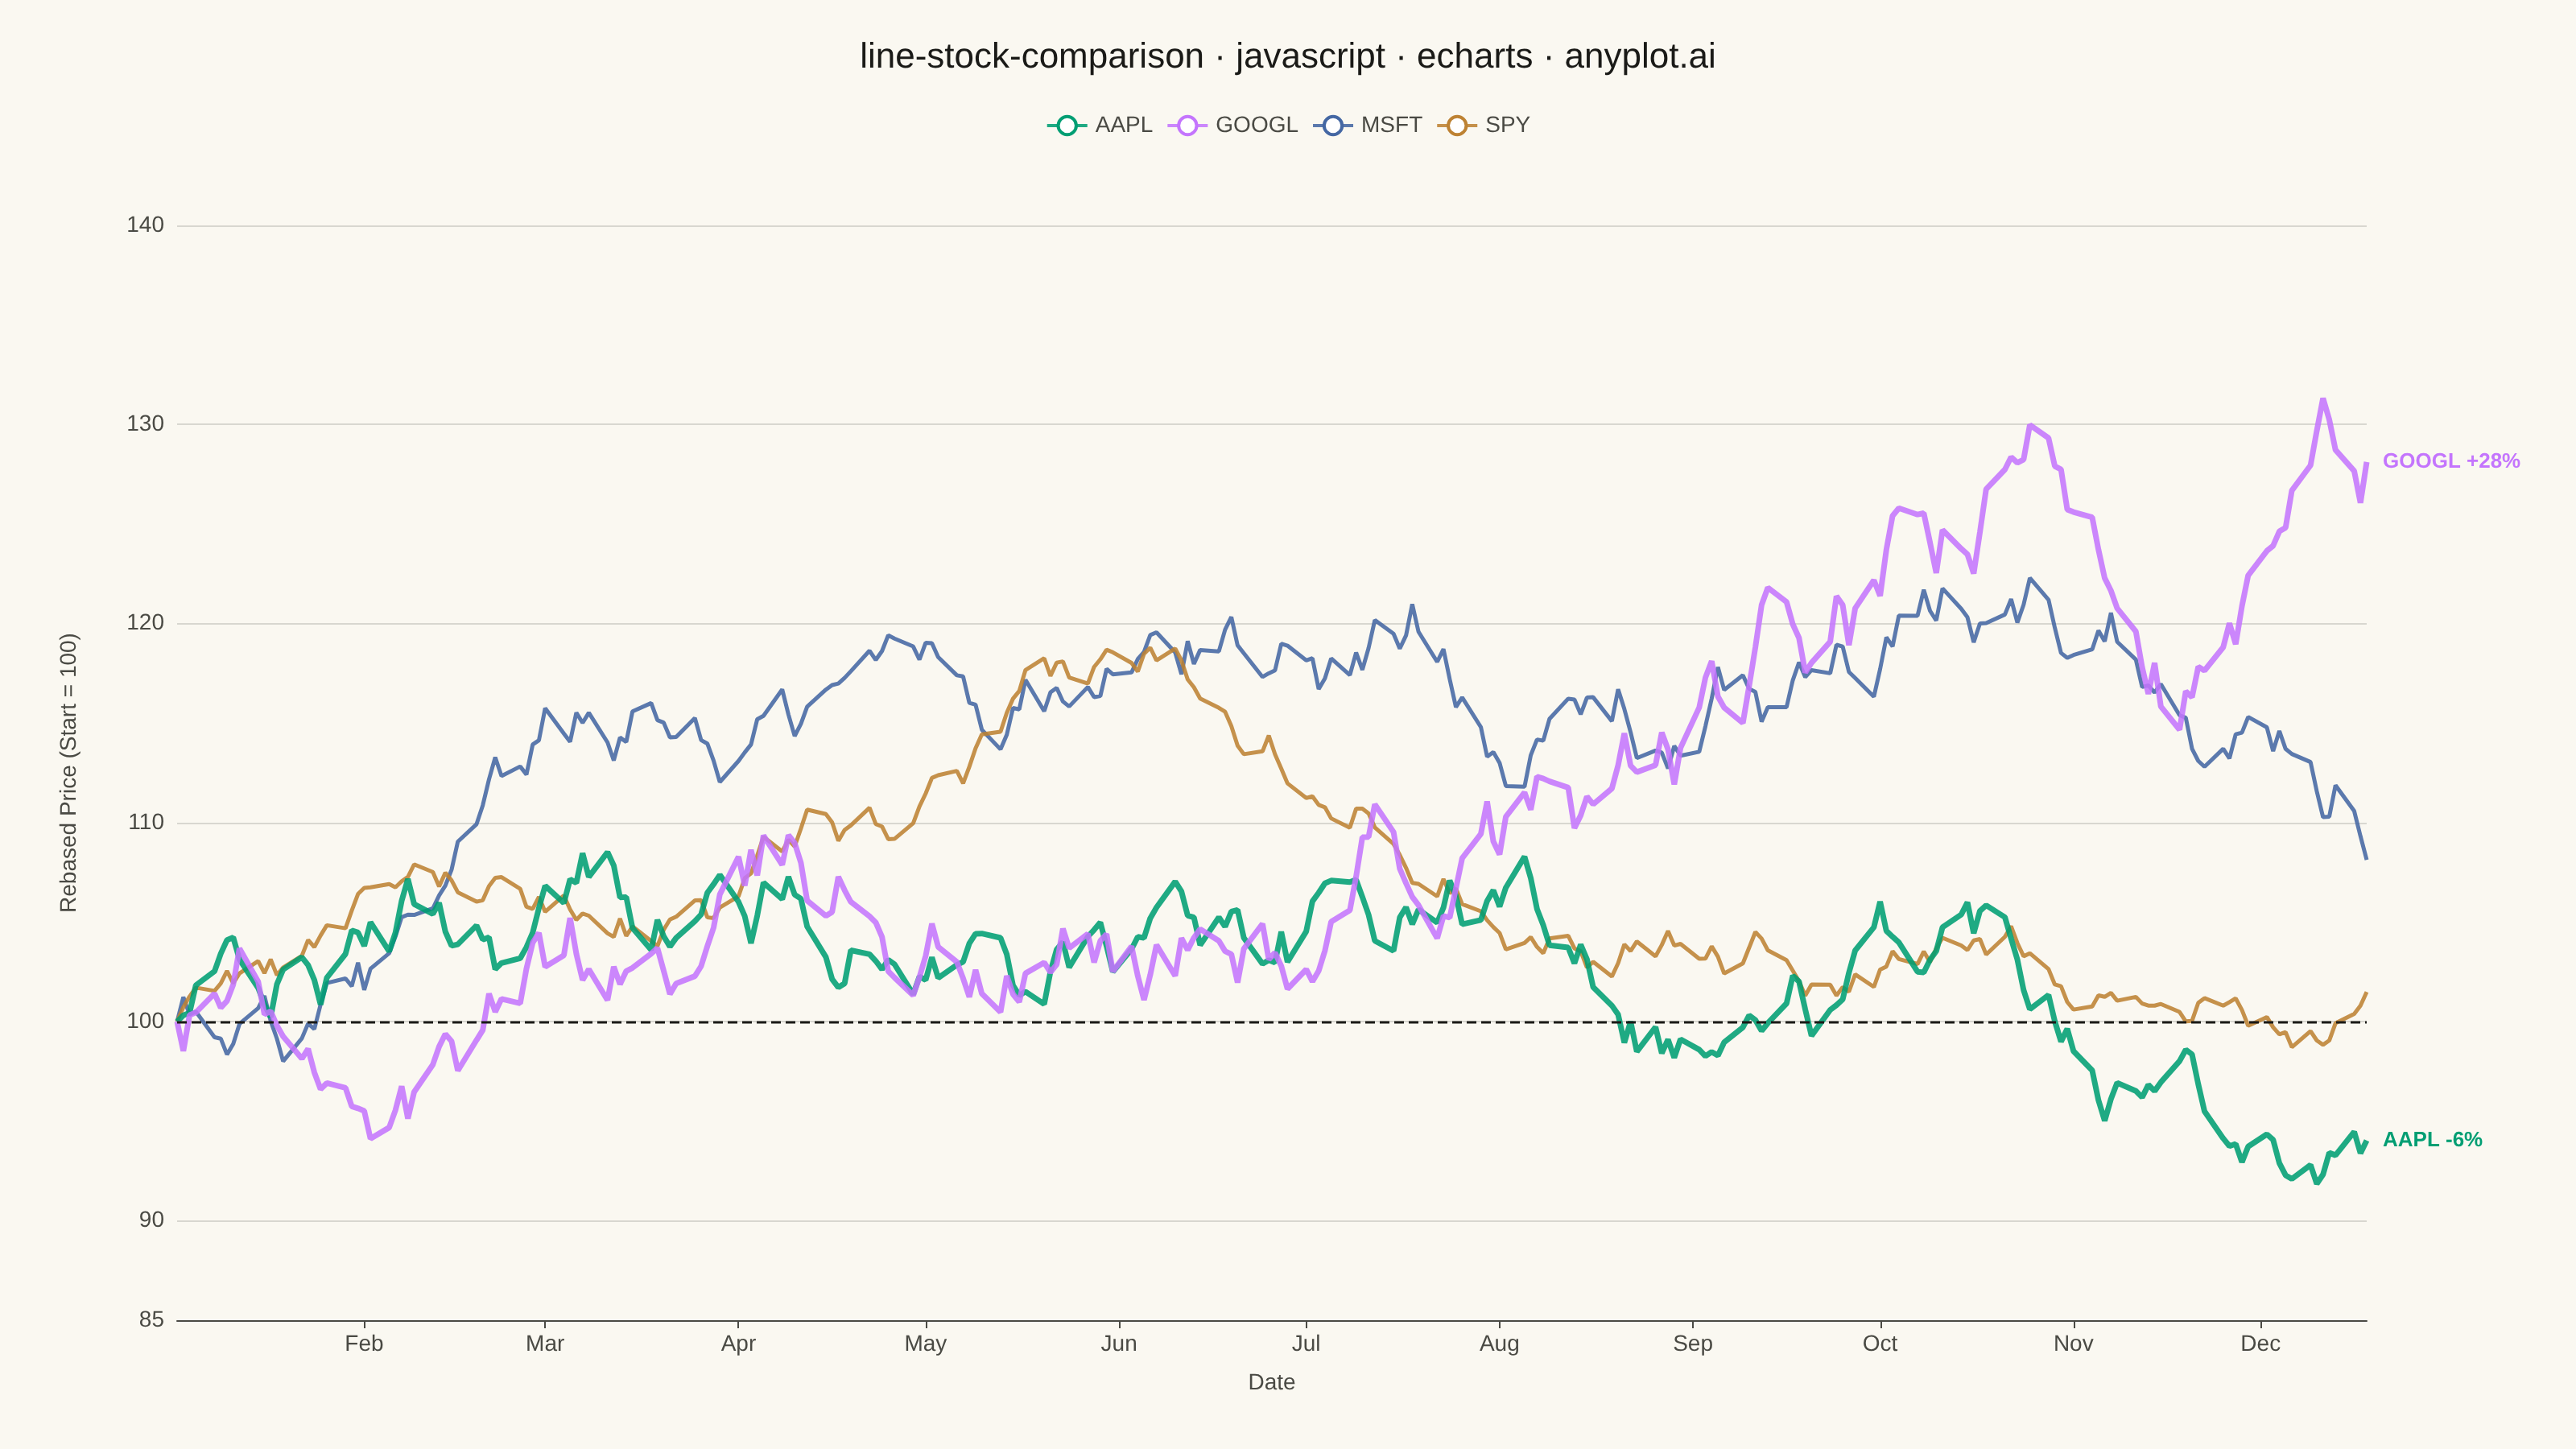
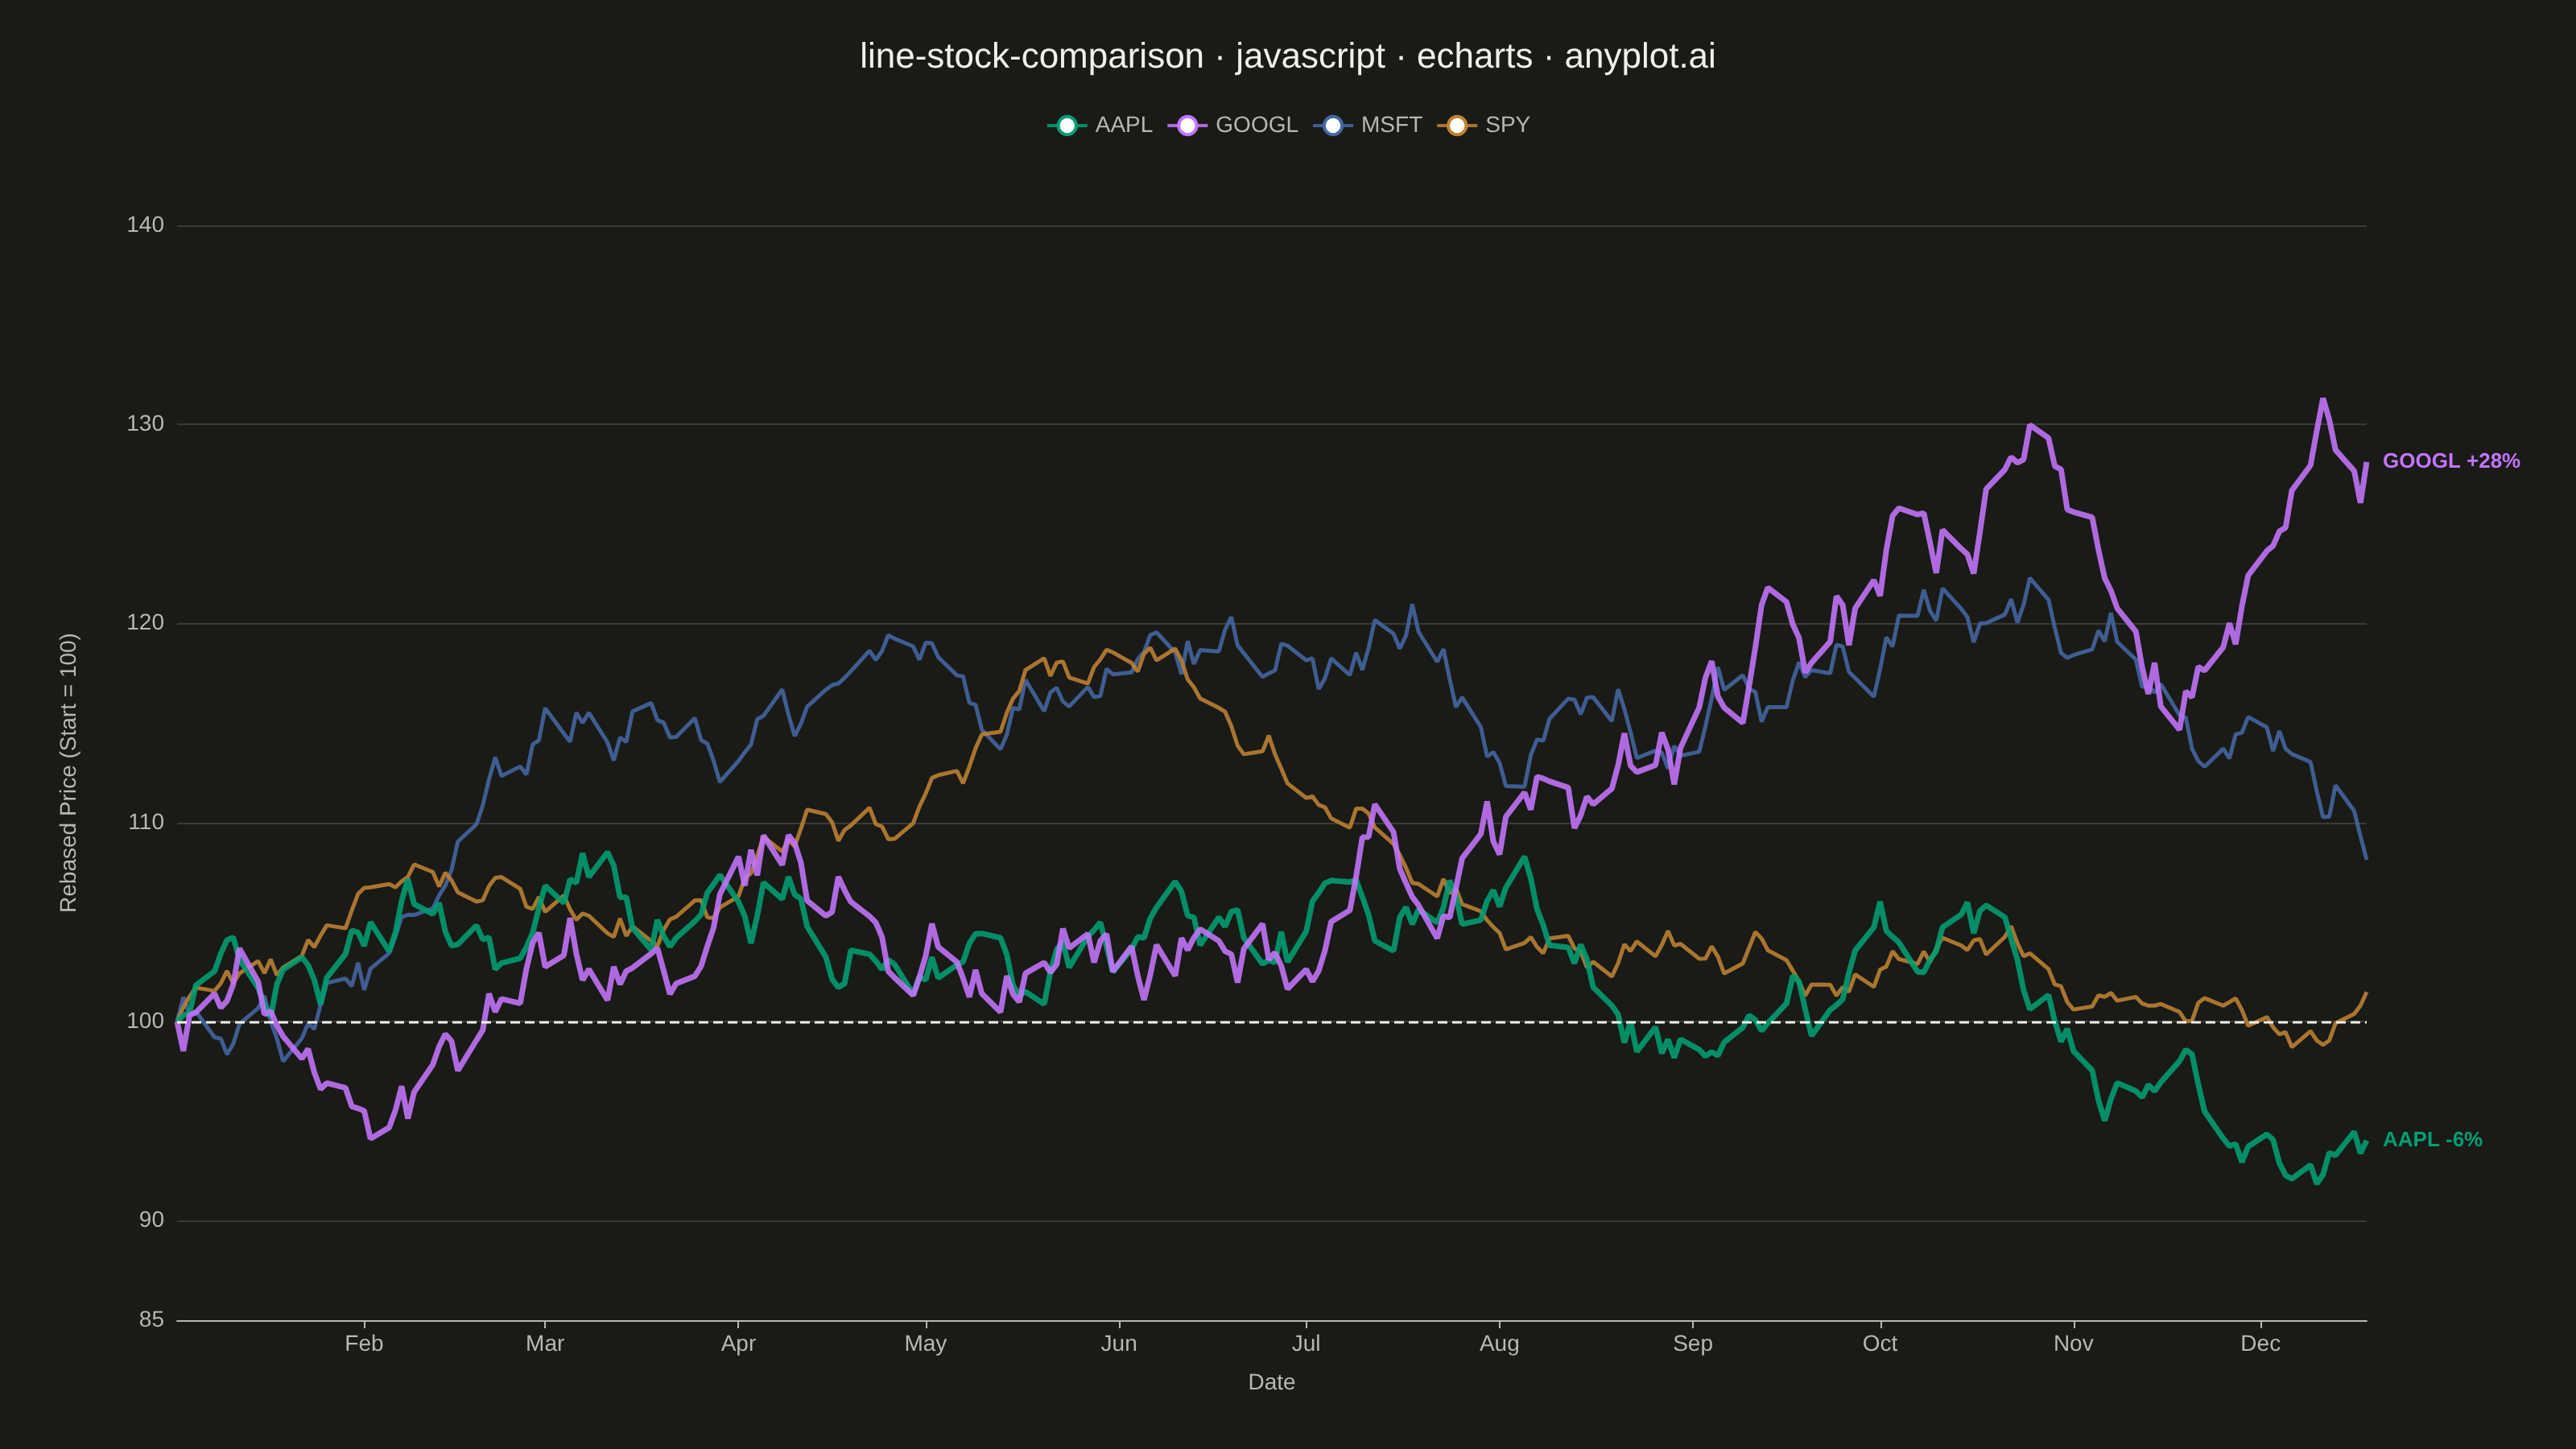
A multi-line chart comparing multiple stock price series normalized to a common starting point (rebased to 100) for direct performance comparison over time. By rebasing all series to the same initial value, investors can easily compare relative returns regardless of absolute price differences. This visualization reveals which stocks outperformed or underperformed relative to each other, making it essential for portfolio analysis and benchmark comparisons.
// anyplot.ai
// line-stock-comparison: Stock Price Comparison Chart
// Library: echarts 6.1.0 | JavaScript 22.23.2
// Quality: 95/100 | Created: 2026-08-26

const t = window.ANYPLOT_TOKENS;

// --- Data (in-memory, deterministic) ----------------------------------------
// Tiny LCG — the browser has no seeded Math.random, so this stands in for it.
let seed = 42;
function lcg() {
  seed = (seed * 1103515245 + 12345) & 0x7fffffff;
  return seed / 0x7fffffff;
}

const symbols = ["AAPL", "GOOGL", "MSFT", "SPY"];
const dailyDrifts = [0.00055, 0.00035, 0.0004, 0.00025];
const dailyVolatilities = [0.016, 0.019, 0.014, 0.009];

const startDate = new Date("2024-01-02T00:00:00Z");
const tradingDays = 252;
const dates = [];
for (let offset = 0, count = 0; count < tradingDays; offset++) {
  const date = new Date(startDate.getTime() + offset * 86400000);
  const weekday = date.getUTCDay();
  if (weekday !== 0 && weekday !== 6) {
    dates.push(date);
    count++;
  }
}

// Each series is its own random walk in log-returns, rebased so day 0 = 100.
const stockSeries = symbols.map((symbol, s) => {
  let rebasedPrice = 100;
  const points = dates.map((date, i) => {
    if (i > 0) {
      const dailyReturn = dailyDrifts[s] + (lcg() - 0.5) * 2 * dailyVolatilities[s];
      rebasedPrice *= 1 + dailyReturn;
    }
    return [date.getTime(), rebasedPrice];
  });
  return { symbol, points };
});

// Tight y-axis bounds so the rebased band (clustered near 100) fills the
// canvas instead of an echarts value axis forcing a 0 baseline.
const allValues = stockSeries.flatMap((s) => s.points.map(([, price]) => price));
const valueRange = Math.max(...allValues) - Math.min(...allValues);
const yPadding = valueRange * 0.12;
const yMin = Math.floor((Math.min(...allValues) - yPadding) / 5) * 5;
const yMax = Math.ceil((Math.max(...allValues) + yPadding) / 5) * 5;

// Identify the winner/laggard so the chart can tell that story directly
// instead of leaving it to be read off the legend.
const finalValues = stockSeries.map((s) => s.points[s.points.length - 1][1]);
const bestIndex = finalValues.indexOf(Math.max(...finalValues));
const worstIndex = finalValues.indexOf(Math.min(...finalValues));

// --- Init --------------------------------------------------------------------
const chart = echarts.init(document.getElementById("container"));

// --- Option --------------------------------------------------------------------
chart.setOption({
  animation: false,
  color: t.palette,
  backgroundColor: "transparent",
  title: {
    text: "line-stock-comparison · javascript · echarts · anyplot.ai",
    left: "center",
    top: 20,
    textStyle: { color: t.ink, fontSize: 22, fontWeight: 500 },
  },
  legend: {
    top: 66,
    data: symbols,
    textStyle: { color: t.inkSoft, fontSize: 14 },
  },
  tooltip: { trigger: "axis" },
  grid: { left: 110, right: 130, top: 140, bottom: 80 },
  xAxis: {
    type: "time",
    name: "Date",
    nameLocation: "middle",
    nameGap: 32,
    nameTextStyle: { color: t.inkSoft, fontSize: 14 },
    axisLabel: { color: t.inkSoft, fontSize: 14 },
    axisLine: { lineStyle: { color: t.inkSoft } },
    splitLine: { show: false },
  },
  yAxis: {
    type: "value",
    min: yMin,
    max: yMax,
    name: "Rebased Price (Start = 100)",
    nameLocation: "middle",
    nameGap: 60,
    nameRotate: 90,
    nameTextStyle: { color: t.inkSoft, fontSize: 14 },
    axisLabel: { color: t.inkSoft, fontSize: 14 },
    axisLine: { show: false },
    splitLine: { lineStyle: { color: t.grid } },
  },
  series: stockSeries.map((s, i) => {
    const isEmphasis = i === bestIndex || i === worstIndex;
    const pctChange = s.points[s.points.length - 1][1] - 100;
    const sign = pctChange >= 0 ? "+" : "";
    return {
      name: s.symbol,
      type: "line",
      data: s.points,
      showSymbol: false,
      z: isEmphasis ? 3 : 2,
      lineStyle: { width: isEmphasis ? 3.5 : 2.5, opacity: 0.88 },
      endLabel: {
        show: isEmphasis,
        formatter: () => `${s.symbol} ${sign}${pctChange.toFixed(0)}%`,
        color: t.palette[i % t.palette.length],
        fontSize: 13,
        fontWeight: 600,
        distance: 10,
      },
      ...(i === 0
        ? {
            markLine: {
              symbol: "none",
              silent: true,
              lineStyle: { color: t.ink, type: "dashed", width: 1.5 },
              label: { show: false },
              data: [{ yAxis: 100 }],
            },
          }
        : {}),
    };
  }),
});
Runnable source as JSON, for any HTTP client: https://api.anyplot.ai/specs/line-stock-comparison/echarts/code. Any spec id and library id listed in llms-full.txt fit the same URL shape; every URL below is complete and callable.
{
  "spec_id": "line-stock-comparison",
  "language": "javascript",
  "library": "echarts",
  "page": "https://anyplot.ai/line-stock-comparison/javascript/echarts",
  "hub": "https://anyplot.ai/line-stock-comparison",
  "code_json": "https://api.anyplot.ai/specs/line-stock-comparison/echarts/code",
  "spec_json": "https://api.anyplot.ai/specs/line-stock-comparison",
  "render_light_png": "https://storage.googleapis.com/anyplot-images/plots/line-stock-comparison/javascript/echarts/plot-light.png",
  "render_dark_png": "https://storage.googleapis.com/anyplot-images/plots/line-stock-comparison/javascript/echarts/plot-dark.png",
  "interactive_light_html": "https://storage.googleapis.com/anyplot-images/plots/line-stock-comparison/javascript/echarts/plot-light.html",
  "interactive_dark_html": "https://storage.googleapis.com/anyplot-images/plots/line-stock-comparison/javascript/echarts/plot-dark.html",
  "quality_score": 95.0,
  "license": "MIT",
  "guide": "https://anyplot.ai/llms.txt"
}
Part of Stock Price Comparison Chart on anyplot.ai.