The same plot in 14 other libraries — JavaScript: D3.js, Apache ECharts, Highcharts, MUI X Charts; Python: Altair, Bokeh, lets-plot, Matplotlib, Plotly, plotnine, Pygal, Seaborn; R: ggplot2; Julia: Makie.jl. Compare all 15 side by side: Engineering Stress-Strain Curve in Python, R, Julia and JavaScript.
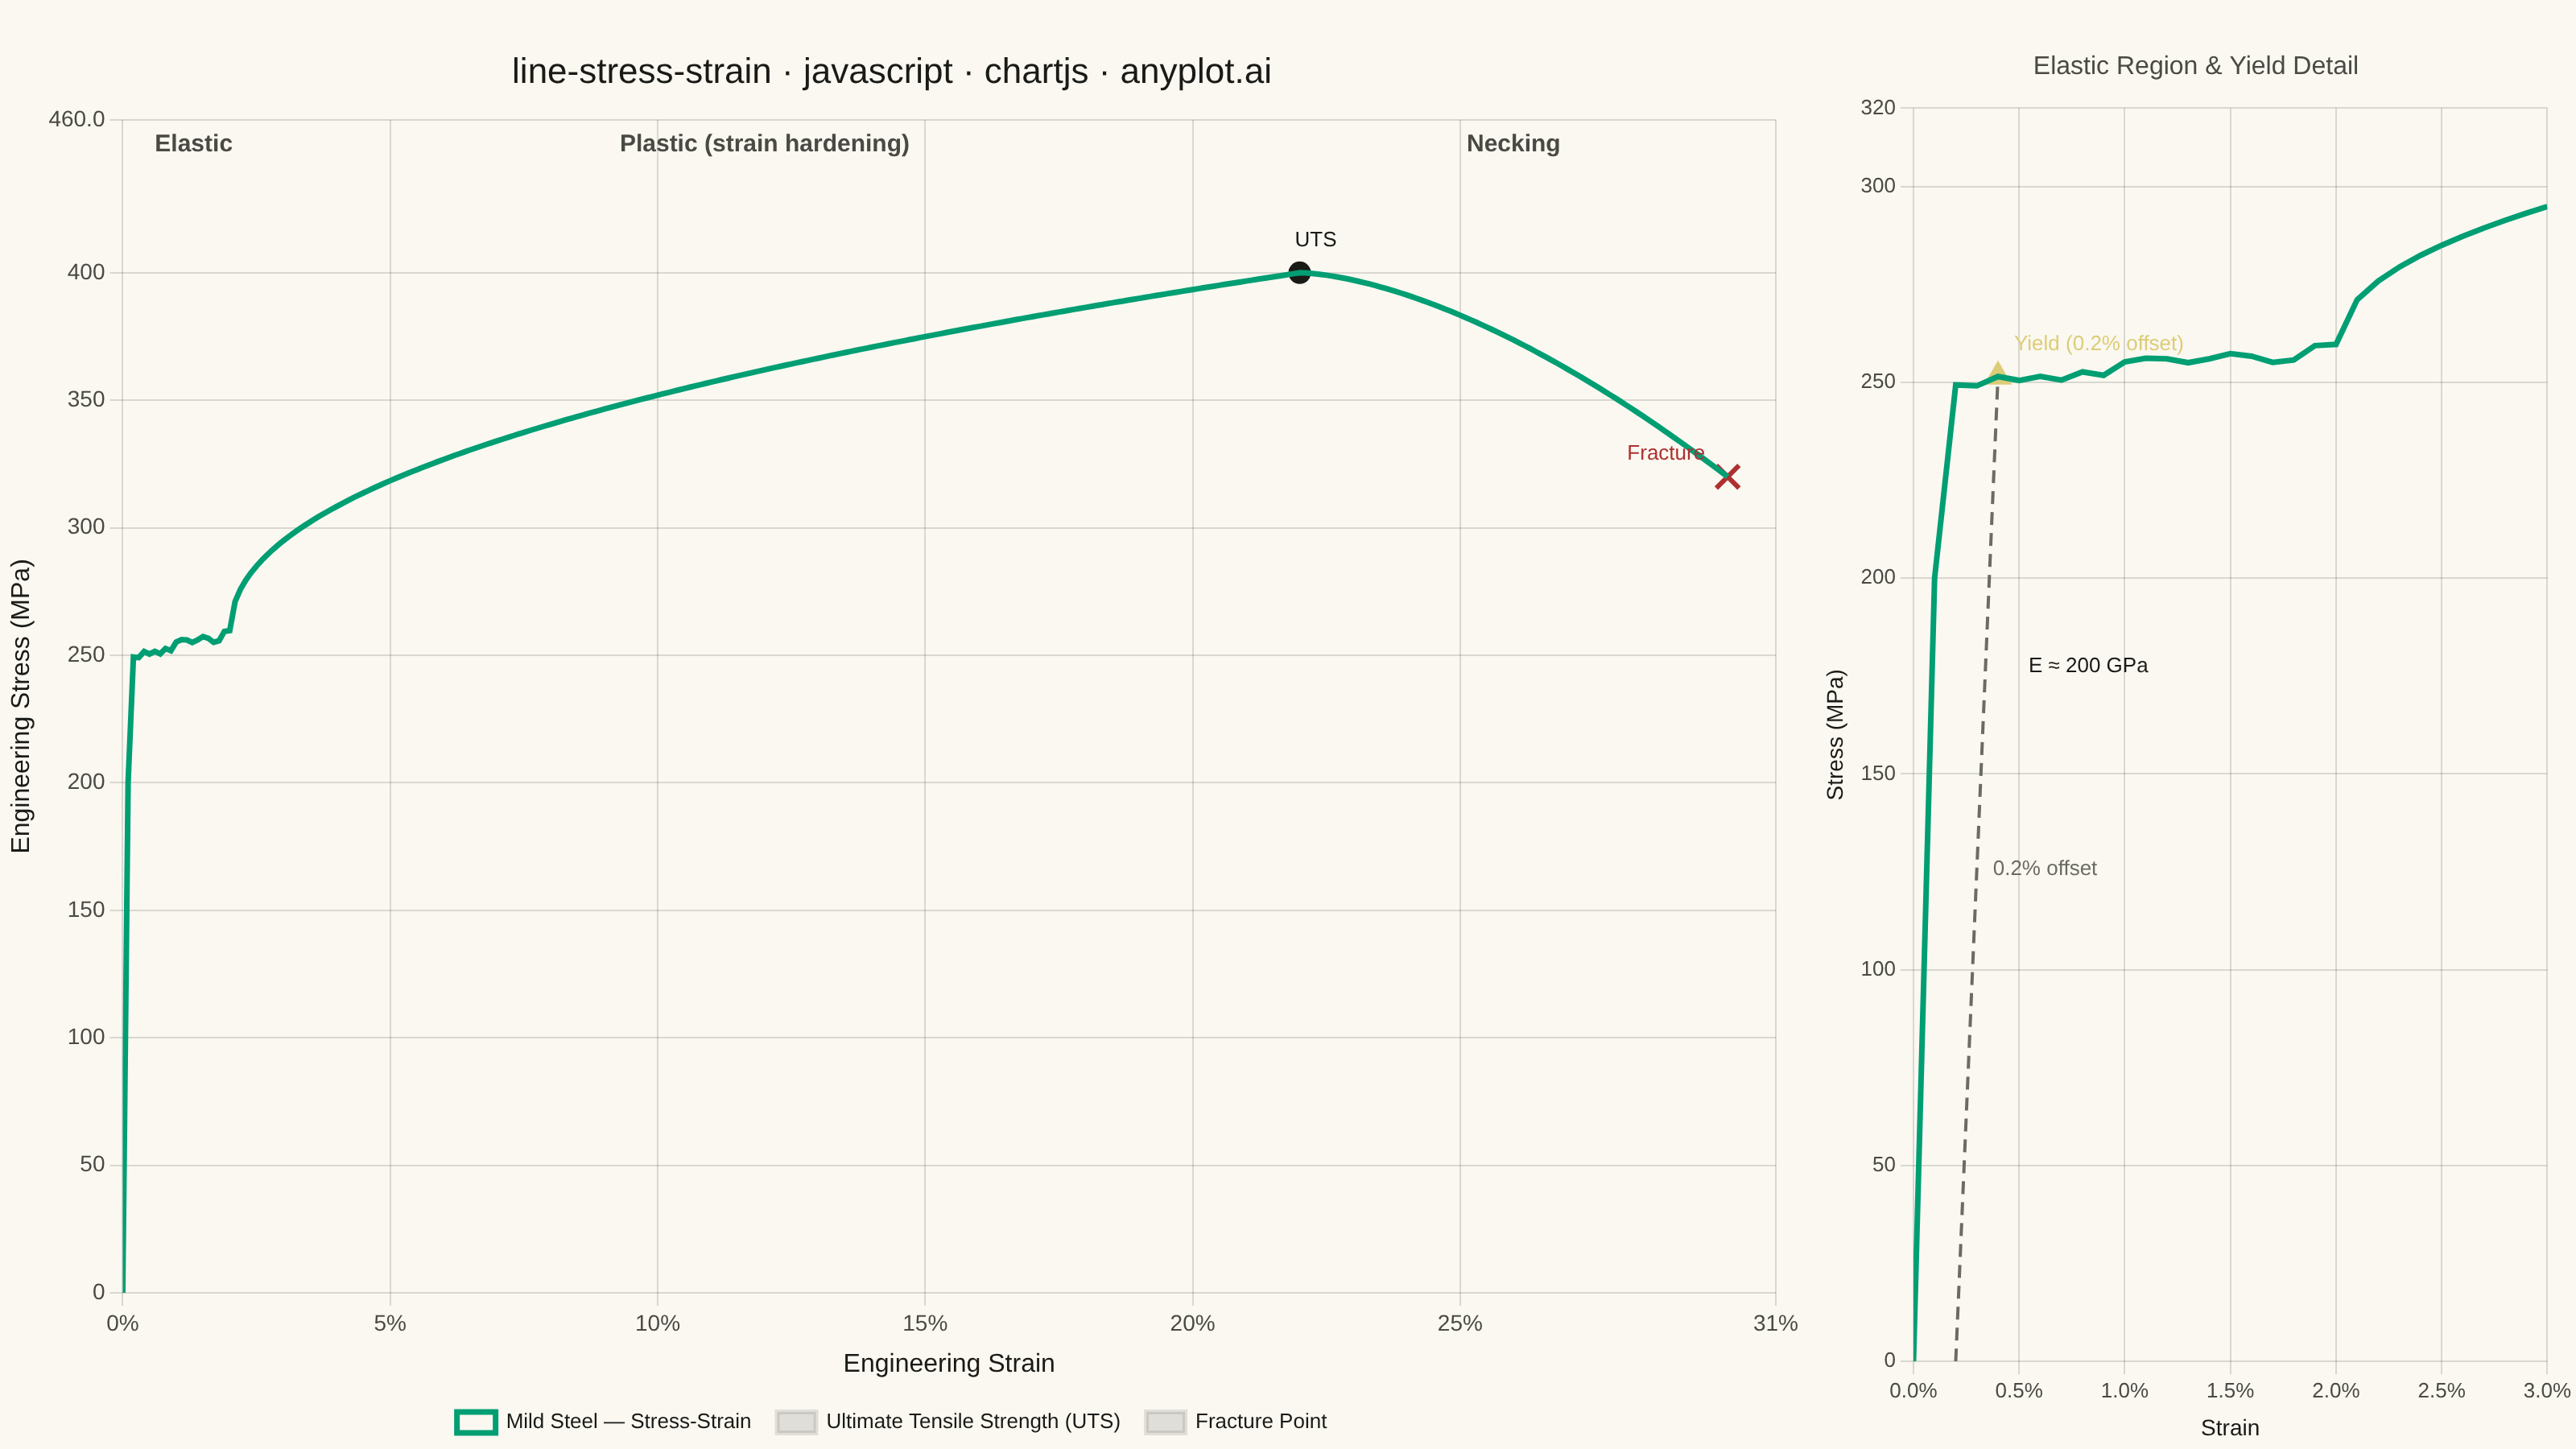
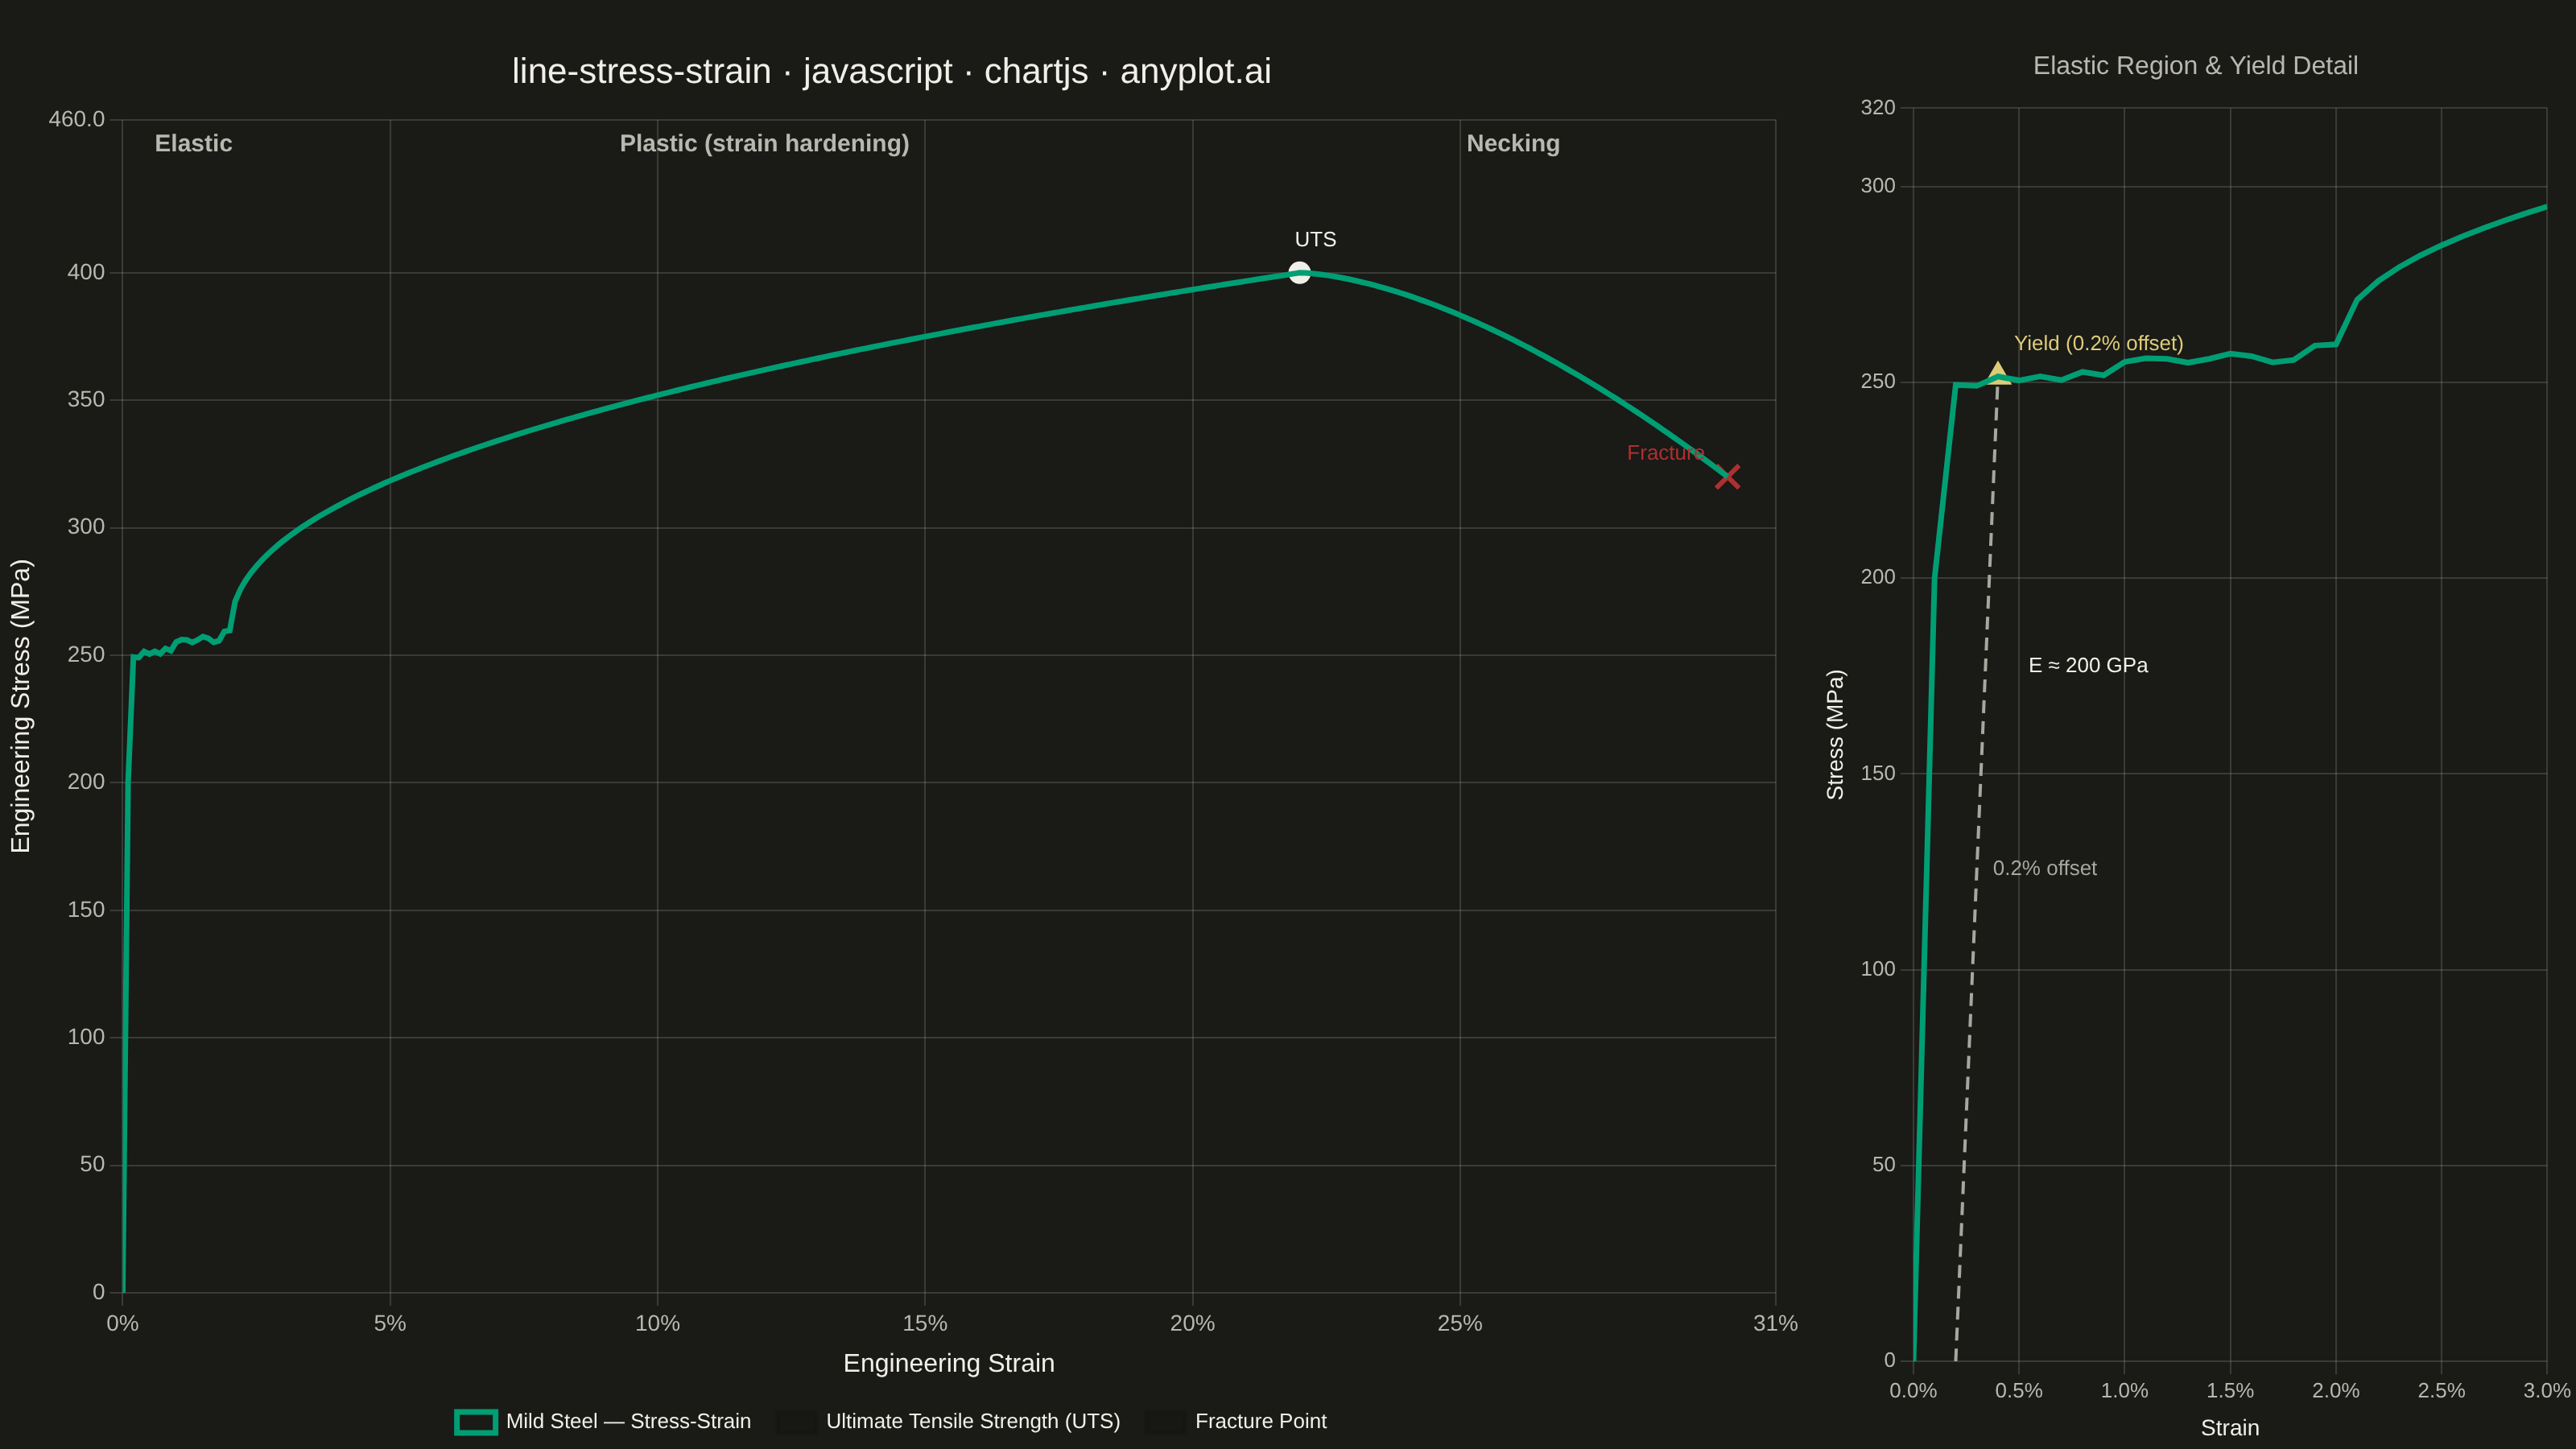
An engineering stress-strain curve visualizes the relationship between applied stress (MPa) and resulting strain (dimensionless) in a material under uniaxial tensile loading. The curve reveals distinct mechanical behavior regions — elastic deformation, yielding, strain hardening, and necking — culminating in fracture. It is the foundational plot for characterizing material mechanical properties and comparing material performance.
// anyplot.ai
// line-stress-strain: Engineering Stress-Strain Curve
// Library: chartjs 4.4.7 | JavaScript 22.23.2
// Quality: 90/100 | Created: 2026-08-24

const t = window.ANYPLOT_TOKENS;
const theme = window.ANYPLOT_THEME;
const inkMuted = theme === "light" ? "#6B6A63" : "#A8A79F";

// --- Data: synthetic tensile test for mild steel (in-memory, deterministic) -
const E = 200000; // MPa, Young's modulus
const proportionalStrain = 0.00125;
const proportionalStress = E * proportionalStrain; // 250 MPa
const plateauEndStrain = 0.02;
const utsStrain = 0.22;
const utsStress = 400; // MPa
const fractureStrain = 0.3;
const fractureStress = 320; // MPa

function lcg(seed) {
  let state = seed;
  return () => {
    state = (state * 1664525 + 1013904223) % 4294967296;
    return state / 4294967296;
  };
}
const rand = lcg(42);

const curve = [];
const N = 300;
for (let i = 0; i <= N; i++) {
  const strain = (fractureStrain * i) / N;
  let stress;
  if (strain <= proportionalStrain) {
    stress = E * strain;
  } else if (strain <= plateauEndStrain) {
    // Lüders plateau: near-flat with a slight upward drift and small noise
    const frac =
      (strain - proportionalStrain) / (plateauEndStrain - proportionalStrain);
    stress = proportionalStress + 8 * frac + (rand() - 0.5) * 4;
  } else if (strain <= utsStrain) {
    // Strain hardening: power-law rise toward UTS
    const frac = (strain - plateauEndStrain) / (utsStrain - plateauEndStrain);
    stress =
      proportionalStress +
      8 +
      (utsStress - proportionalStress - 8) * Math.pow(frac, 0.45);
  } else {
    // Necking: softening toward fracture
    const frac = (strain - utsStrain) / (fractureStrain - utsStrain);
    stress = utsStress - (utsStress - fractureStress) * Math.pow(frac, 1.6);
  }
  curve.push({ x: strain, y: Math.max(stress, 0) });
}

// 0.2% offset line: parallel to the elastic slope, shifted by 0.002 strain.
// Its intersection with the curve is the yield point (offset method).
const offsetShift = 0.002;
let yieldPoint = curve[curve.length - 1];
for (const p of curve) {
  if (p.x <= offsetShift) continue;
  const offsetStress = E * (p.x - offsetShift);
  if (offsetStress >= p.y) {
    yieldPoint = p;
    break;
  }
}
const offsetLine = [
  { x: offsetShift, y: 0 },
  { x: yieldPoint.x, y: yieldPoint.y },
];

const utsPoint = { x: utsStrain, y: utsStress };
const fracturePoint = { x: fractureStrain, y: fractureStress };

// --- Layout: main curve (left) + zoomed elastic/yield detail (right) -------
const container = document.getElementById("container");
container.style.display = "flex";
container.style.flexDirection = "row";
container.style.background = t.pageBg;
container.style.boxSizing = "border-box";

function addPanel(flexGrow) {
  const wrap = document.createElement("div");
  wrap.style.cssText = `position:relative;flex:${flexGrow};width:100%;min-width:0;overflow:hidden`;
  container.appendChild(wrap);
  const canvas = document.createElement("canvas");
  wrap.appendChild(canvas);
  return canvas;
}

const mainCanvas = addPanel(7);
const zoomCanvas = addPanel(3);

// --- Text-callout plugin (core Chart.js plugin, no external deps) ----------
function calloutPlugin(callouts) {
  return {
    id: "callouts",
    afterDraw(chart) {
      const { ctx, scales } = chart;
      ctx.save();
      ctx.font = "13px sans-serif";
      ctx.textBaseline = "middle";
      for (const c of callouts) {
        const px = scales.x.getPixelForValue(c.x);
        const py = scales.y.getPixelForValue(c.y);
        ctx.fillStyle = c.color;
        ctx.textAlign = c.align || "left";
        ctx.fillText(c.text, px + (c.dx || 10), py + (c.dy || 0));
      }
      ctx.restore();
    },
  };
}

function regionLabelsPlugin() {
  return {
    id: "regionLabels",
    afterDraw(chart) {
      const { ctx, scales, chartArea } = chart;
      ctx.save();
      ctx.font = "600 15px sans-serif";
      ctx.fillStyle = t.inkSoft;
      ctx.textBaseline = "top";

      ctx.textAlign = "left";
      ctx.fillText(
        "Elastic",
        scales.x.getPixelForValue(0.006),
        chartArea.top + 8,
      );

      const plasticCenter = (plateauEndStrain + utsStrain) / 2;
      ctx.textAlign = "center";
      ctx.fillText(
        "Plastic (strain hardening)",
        scales.x.getPixelForValue(plasticCenter),
        chartArea.top + 8,
      );

      const neckingCenter = (utsStrain + fractureStrain) / 2;
      ctx.fillText(
        "Necking",
        scales.x.getPixelForValue(neckingCenter),
        chartArea.top + 8,
      );
      ctx.restore();
    },
  };
}

// --- Main panel: full-range curve with UTS + fracture ----------------------
const mainCallouts = [
  {
    x: utsPoint.x,
    y: utsPoint.y,
    text: "UTS",
    color: t.ink,
    align: "center",
    dx: 0,
    dy: -20,
  },
  {
    x: fracturePoint.x,
    y: fracturePoint.y,
    text: "Fracture",
    color: t.palette[4],
    align: "right",
    dx: -14,
    dy: -14,
  },
];

new Chart(mainCanvas, {
  type: "line",
  data: {
    datasets: [
      {
        label: "Mild Steel — Stress-Strain",
        data: curve,
        borderColor: t.palette[0],
        backgroundColor: "transparent",
        borderWidth: 3.5,
        pointRadius: 0,
        tension: 0,
      },
      {
        label: "Ultimate Tensile Strength (UTS)",
        data: [utsPoint],
        showLine: false,
        pointStyle: "circle",
        pointRadius: 8,
        pointBackgroundColor: t.ink,
        pointBorderColor: t.pageBg,
        pointBorderWidth: 2,
      },
      {
        label: "Fracture Point",
        data: [fracturePoint],
        showLine: false,
        pointStyle: "crossRot",
        pointRadius: 10,
        pointBorderWidth: 3,
        pointBackgroundColor: t.palette[4],
        pointBorderColor: t.palette[4],
      },
    ],
  },
  options: {
    responsive: true,
    maintainAspectRatio: false,
    animation: false,
    layout: { padding: { top: 28, right: 12 } },
    plugins: {
      title: {
        display: true,
        text: "line-stress-strain · javascript · chartjs · anyplot.ai",
        color: t.ink,
        font: { size: 22, weight: "500" },
        padding: { top: 4, bottom: 16 },
      },
      legend: {
        position: "bottom",
        labels: { color: t.ink, font: { size: 13 }, boxWidth: 24, padding: 16 },
      },
      tooltip: { enabled: false },
    },
    scales: {
      x: {
        type: "linear",
        min: 0,
        max: fractureStrain * 1.03,
        border: { display: false },
        grid: { color: t.grid },
        ticks: {
          color: t.inkSoft,
          font: { size: 14 },
          callback: (v) => Math.round(v * 100) + "%",
        },
        title: {
          display: true,
          text: "Engineering Strain",
          color: t.ink,
          font: { size: 16 },
        },
      },
      y: {
        min: 0,
        max: utsStress * 1.15,
        border: { display: false },
        grid: { color: t.grid },
        ticks: { color: t.inkSoft, font: { size: 14 } },
        title: {
          display: true,
          text: "Engineering Stress (MPa)",
          color: t.ink,
          font: { size: 16 },
        },
      },
    },
  },
  plugins: [regionLabelsPlugin(), calloutPlugin(mainCallouts)],
});

// --- Zoom panel: elastic region + 0.2% offset yield construction -----------
const ZOOM_X_MAX = 0.03;
const ZOOM_Y_MAX = 320;
const zoomCallouts = [
  {
    x: proportionalStrain * 0.7,
    y: E * proportionalStrain * 0.7,
    text: "E ≈ 200 GPa",
    color: t.ink,
    dx: 60,
    dy: -6,
  },
  {
    x: offsetShift + (yieldPoint.x - offsetShift) / 2,
    y: yieldPoint.y / 2,
    text: "0.2% offset",
    color: inkMuted,
    dx: 10,
    dy: 0,
  },
  {
    x: yieldPoint.x,
    y: yieldPoint.y,
    text: "Yield (0.2% offset)",
    color: t.amber,
    dx: 10,
    dy: -20,
  },
];

new Chart(zoomCanvas, {
  type: "line",
  data: {
    datasets: [
      {
        label: "Stress-Strain (detail)",
        data: curve.filter((p) => p.x <= ZOOM_X_MAX * 1.2),
        borderColor: t.palette[0],
        backgroundColor: "transparent",
        borderWidth: 3.5,
        pointRadius: 0,
        tension: 0,
      },
      {
        label: "0.2% Offset Line",
        data: offsetLine,
        borderColor: inkMuted,
        backgroundColor: "transparent",
        borderWidth: 2,
        borderDash: [8, 5],
        pointRadius: 0,
      },
      {
        label: "Yield Point (0.2% Offset)",
        data: [yieldPoint],
        showLine: false,
        pointStyle: "triangle",
        pointRadius: 9,
        pointBackgroundColor: t.amber,
        pointBorderColor: t.amber,
      },
    ],
  },
  options: {
    responsive: true,
    maintainAspectRatio: false,
    animation: false,
    layout: { padding: { top: 28, left: 8 } },
    plugins: {
      title: {
        display: true,
        text: "Elastic Region & Yield Detail",
        color: t.inkSoft,
        font: { size: 16, weight: "500" },
        padding: { top: 4, bottom: 16 },
      },
      legend: { display: false },
      tooltip: { enabled: false },
    },
    scales: {
      x: {
        type: "linear",
        min: 0,
        max: ZOOM_X_MAX,
        border: { display: false },
        grid: { color: t.grid },
        ticks: {
          color: t.inkSoft,
          font: { size: 13 },
          callback: (v) => (v * 100).toFixed(1) + "%",
        },
        title: {
          display: true,
          text: "Strain",
          color: t.ink,
          font: { size: 14 },
        },
      },
      y: {
        min: 0,
        max: ZOOM_Y_MAX,
        border: { display: false },
        grid: { color: t.grid },
        ticks: { color: t.inkSoft, font: { size: 13 } },
        title: {
          display: true,
          text: "Stress (MPa)",
          color: t.ink,
          font: { size: 14 },
        },
      },
    },
  },
  plugins: [calloutPlugin(zoomCallouts)],
});
Runnable source as JSON, for any HTTP client: https://api.anyplot.ai/specs/line-stress-strain/chartjs/code. Any spec id and library id listed in llms-full.txt fit the same URL shape; every URL below is complete and callable.
{
  "spec_id": "line-stress-strain",
  "language": "javascript",
  "library": "chartjs",
  "page": "https://anyplot.ai/line-stress-strain/javascript/chartjs",
  "hub": "https://anyplot.ai/line-stress-strain",
  "code_json": "https://api.anyplot.ai/specs/line-stress-strain/chartjs/code",
  "spec_json": "https://api.anyplot.ai/specs/line-stress-strain",
  "render_light_png": "https://storage.googleapis.com/anyplot-images/plots/line-stress-strain/javascript/chartjs/plot-light.png",
  "render_dark_png": "https://storage.googleapis.com/anyplot-images/plots/line-stress-strain/javascript/chartjs/plot-dark.png",
  "interactive_light_html": "https://storage.googleapis.com/anyplot-images/plots/line-stress-strain/javascript/chartjs/plot-light.html",
  "interactive_dark_html": "https://storage.googleapis.com/anyplot-images/plots/line-stress-strain/javascript/chartjs/plot-dark.html",
  "quality_score": 90.0,
  "license": "MIT",
  "guide": "https://anyplot.ai/llms.txt"
}
Part of Engineering Stress-Strain Curve on anyplot.ai.