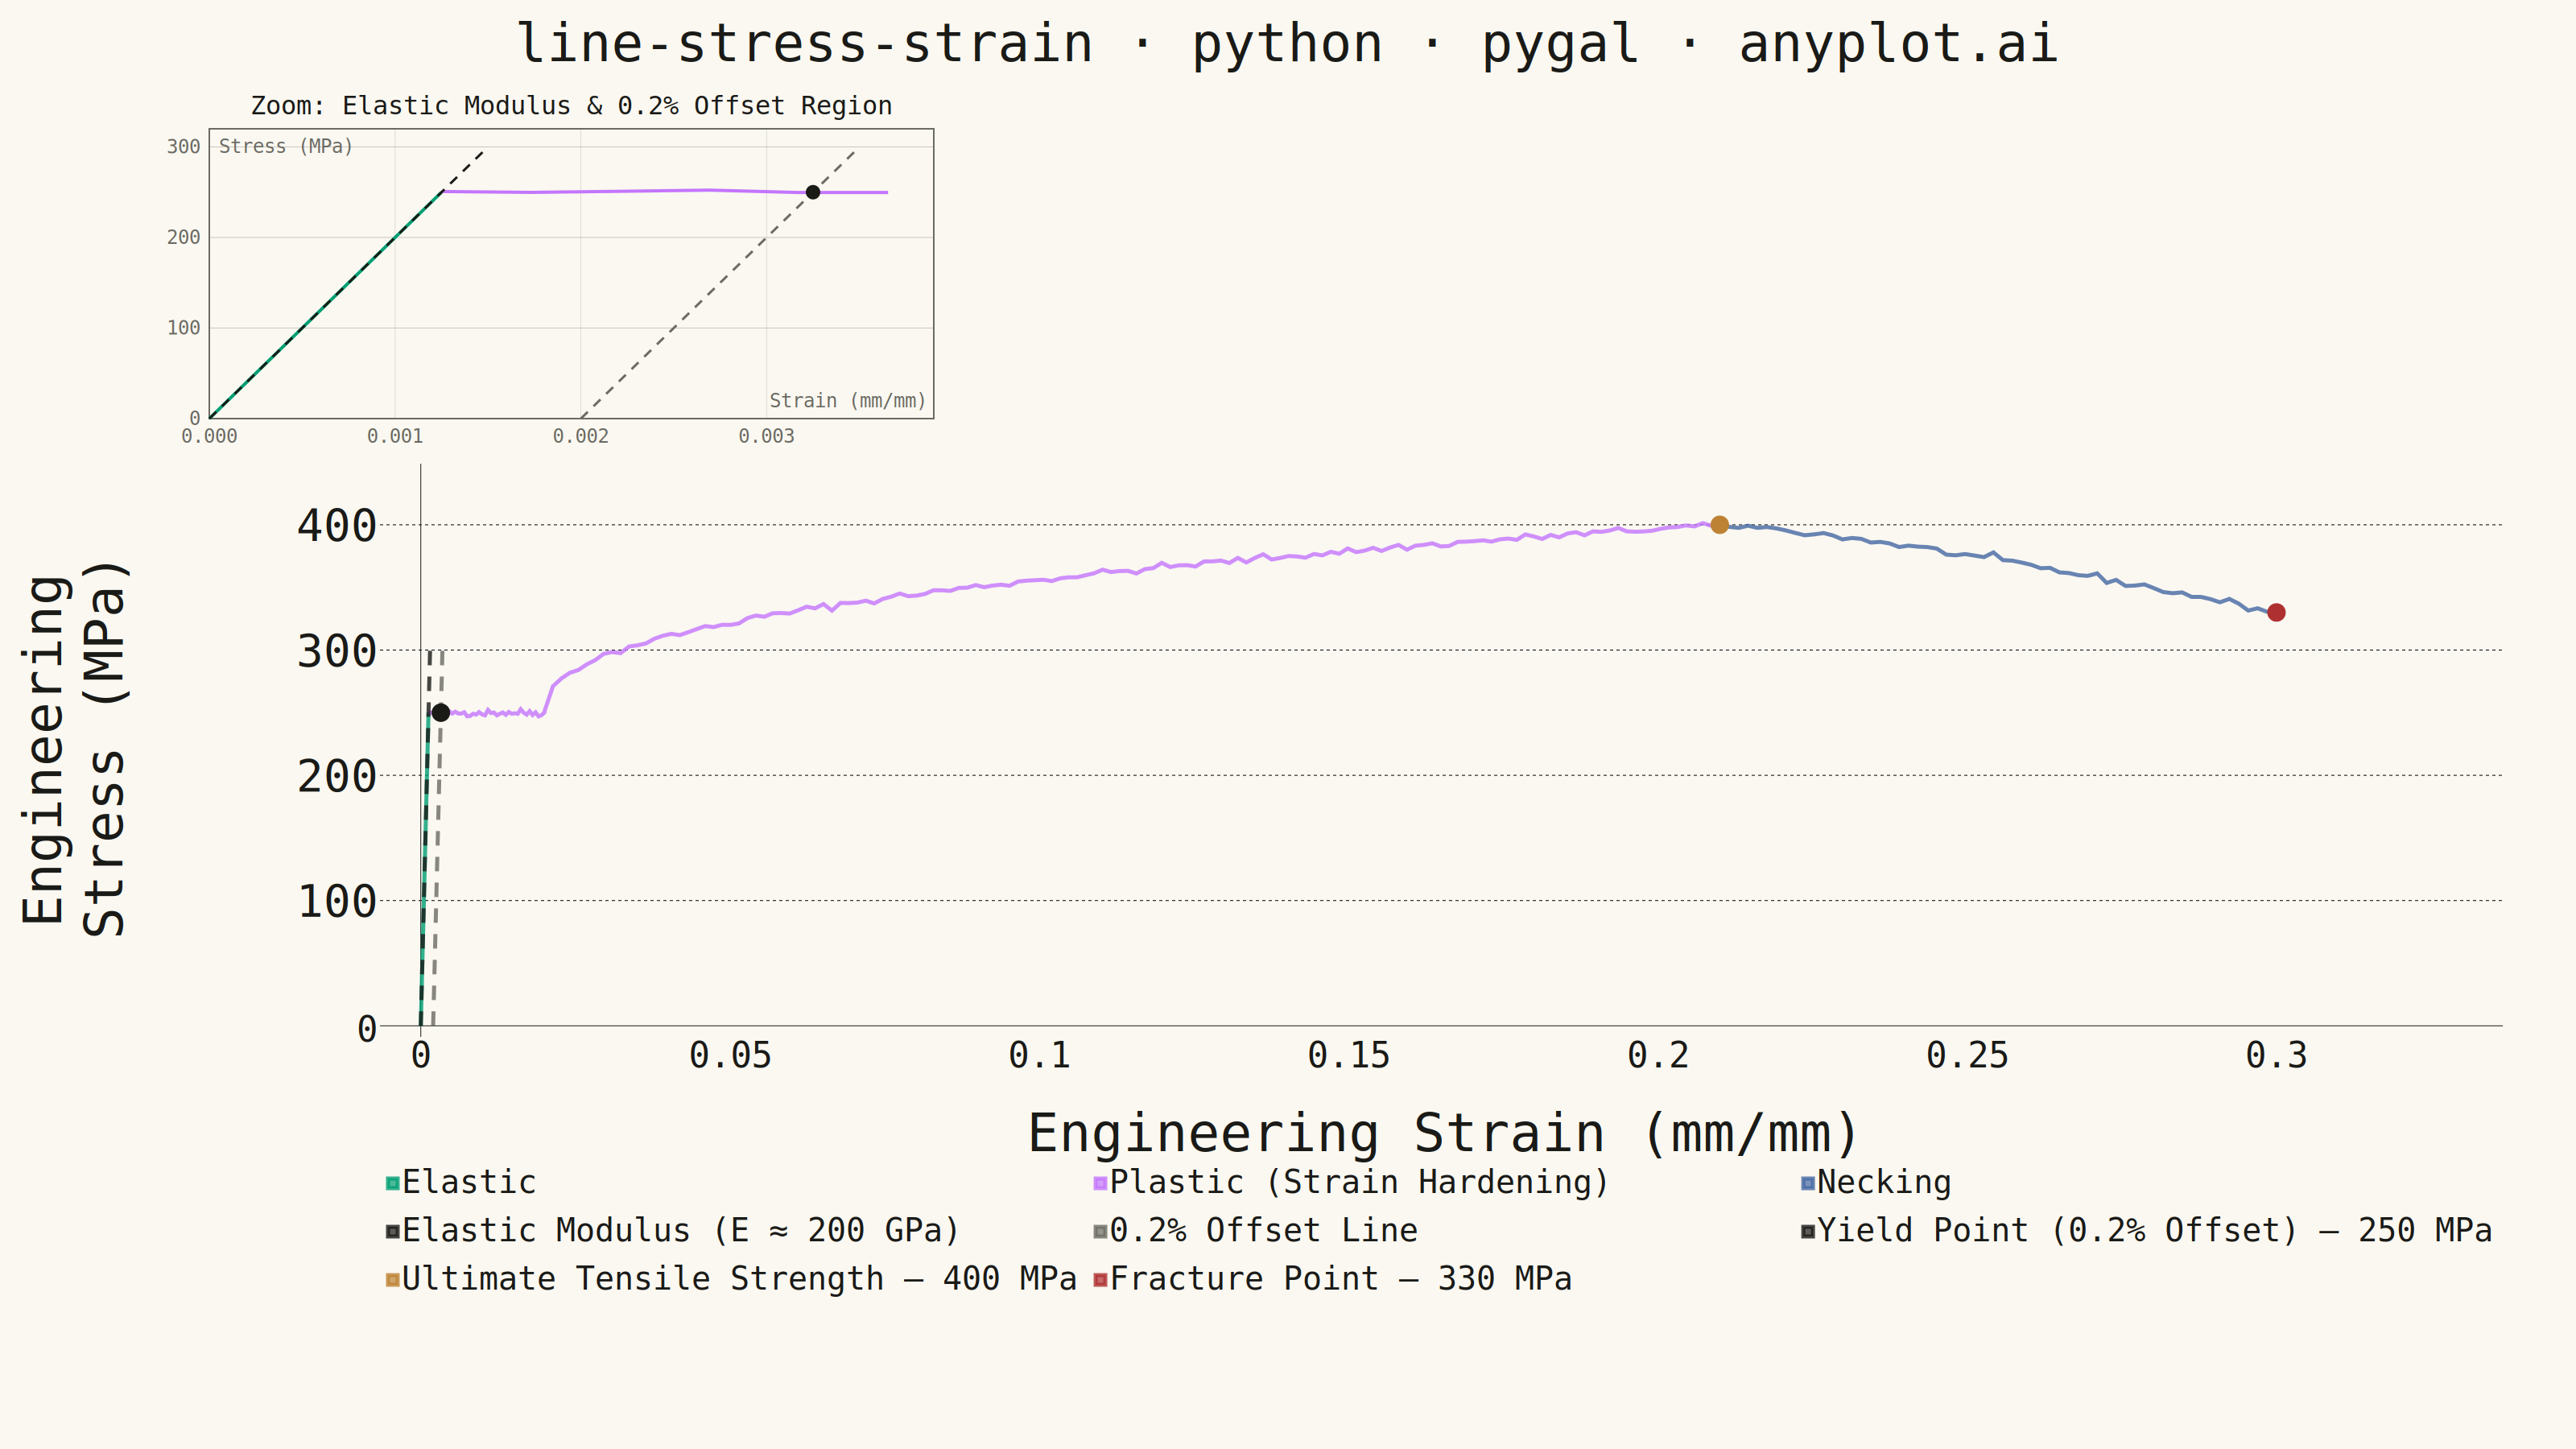
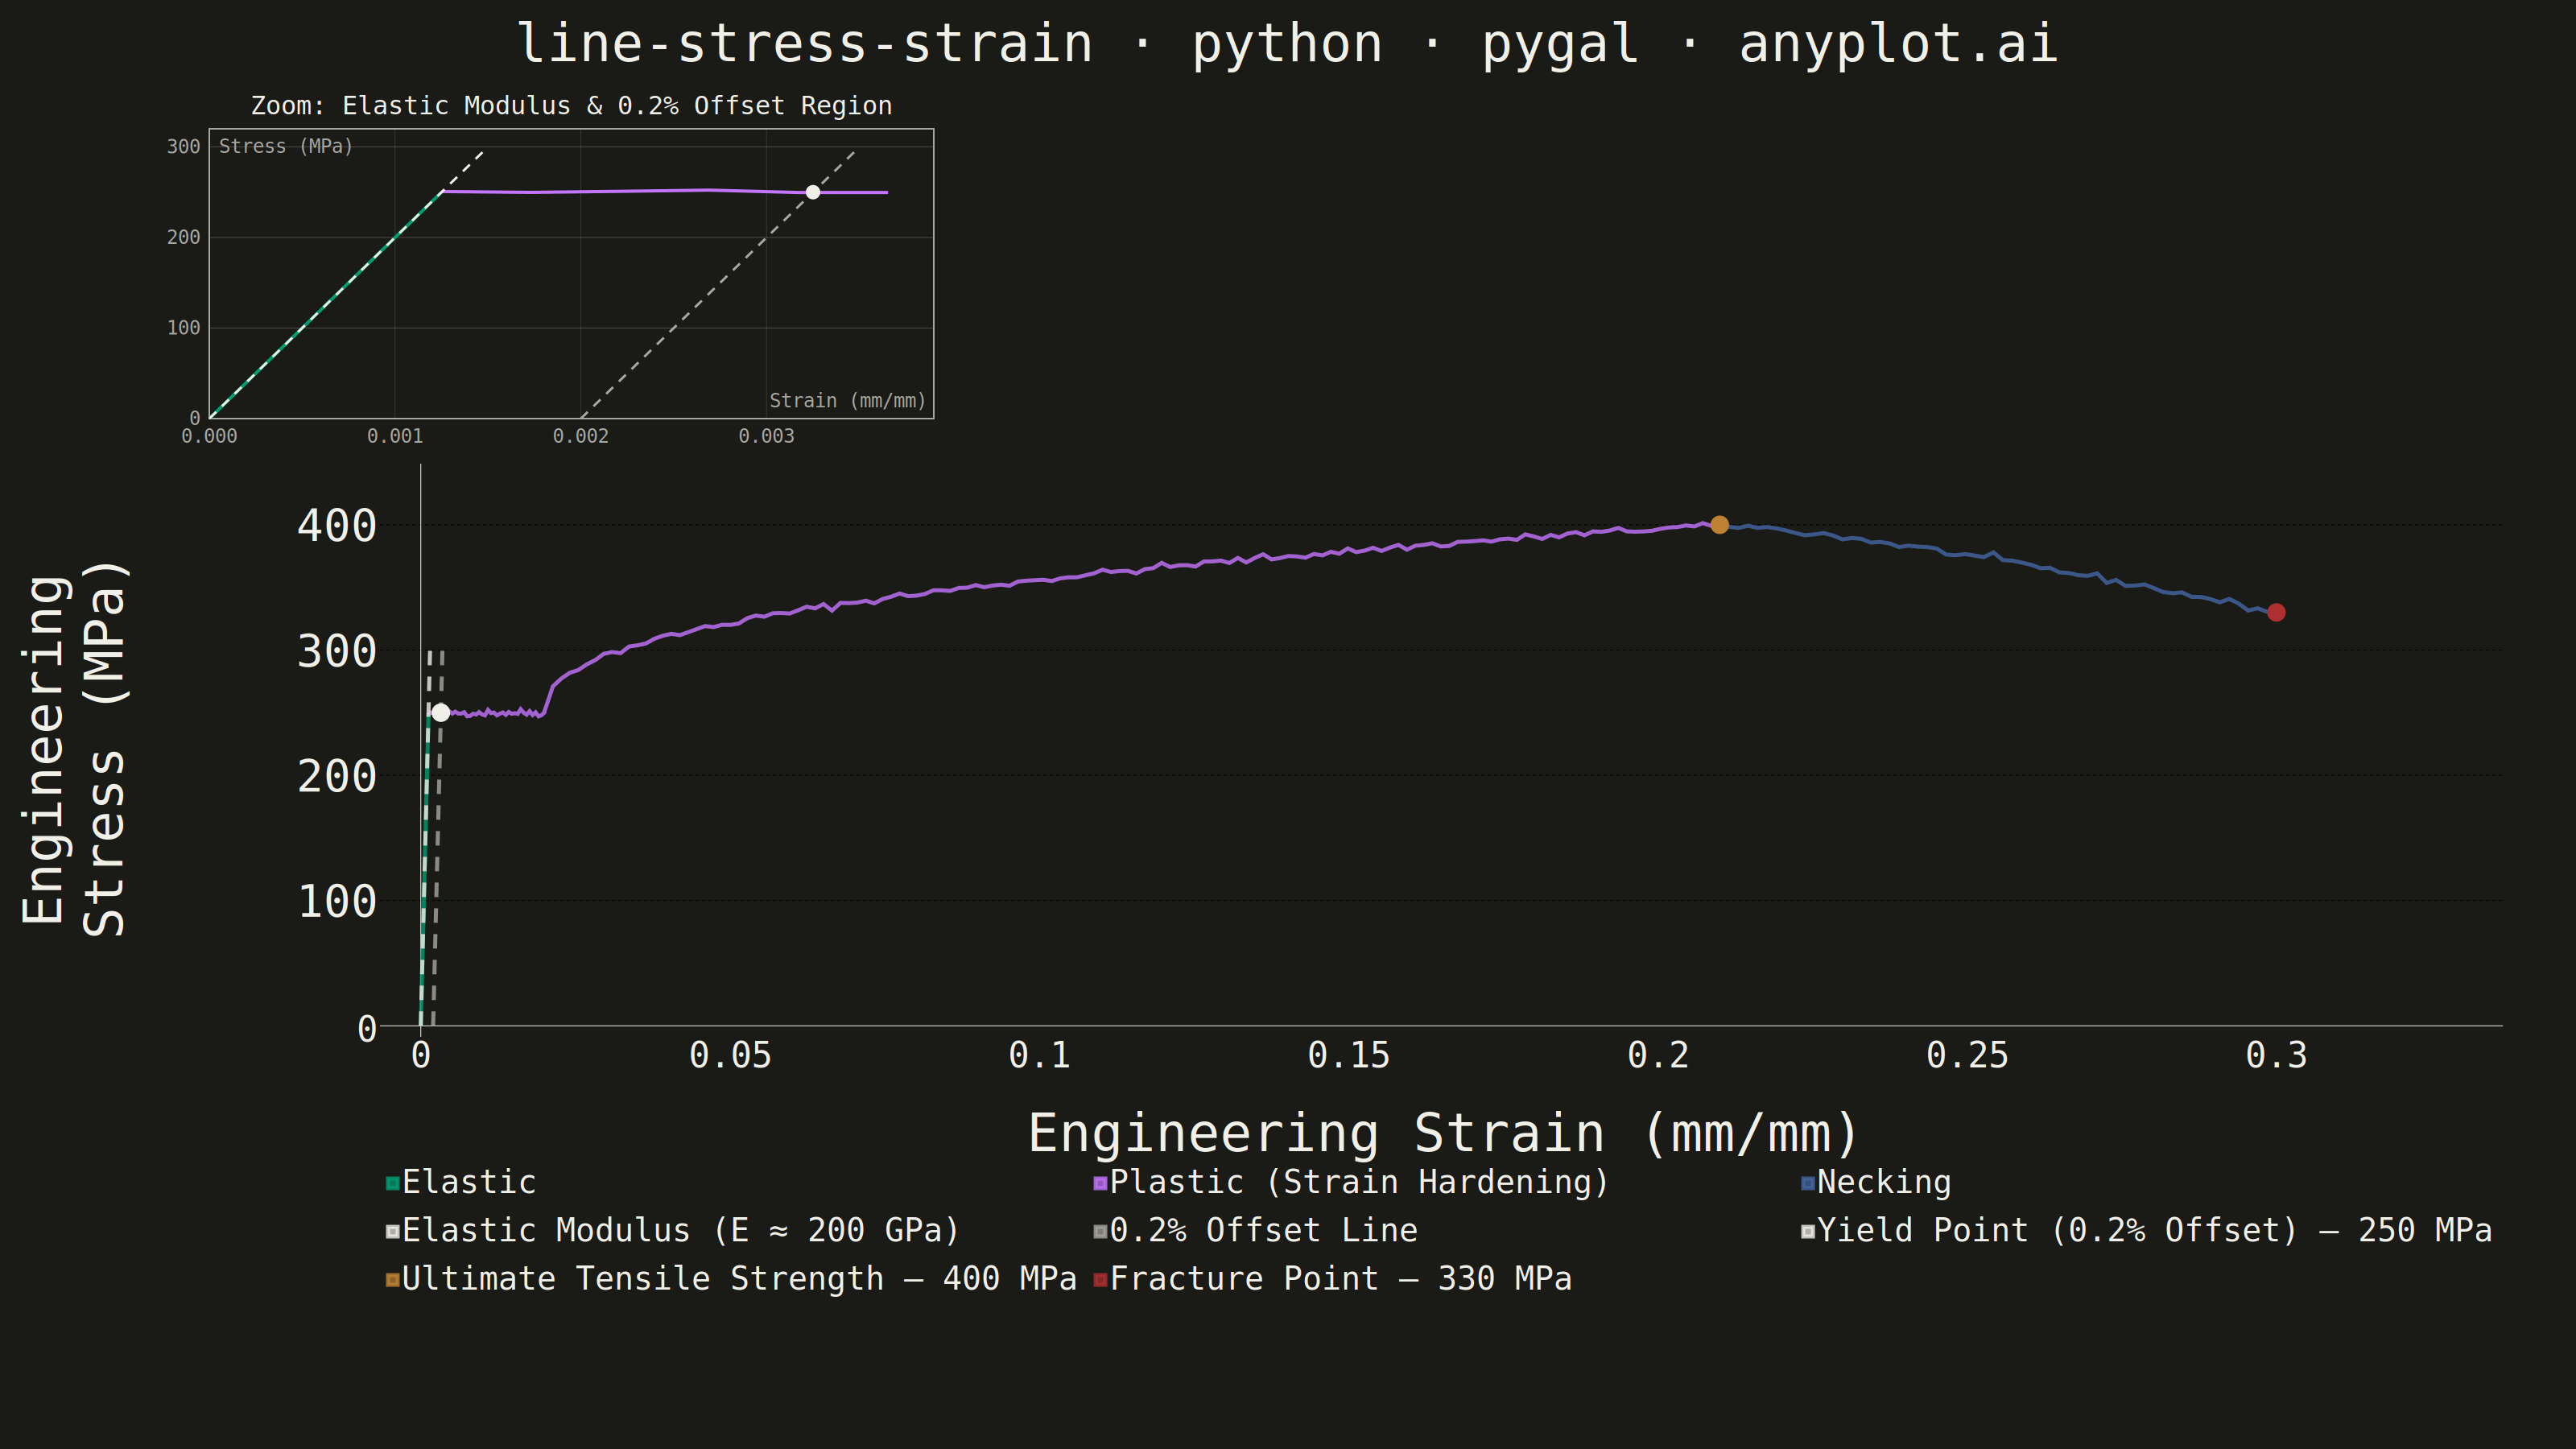
The same plot in 14 other libraries — Python: Altair, Bokeh, lets-plot, Matplotlib, Plotly, plotnine, Seaborn; R: ggplot2; Julia: Makie.jl; JavaScript: Chart.js, D3.js, Apache ECharts, Highcharts, MUI X Charts. Compare all 15 side by side: Engineering Stress-Strain Curve in Python, R, Julia and JavaScript.
An engineering stress-strain curve visualizes the relationship between applied stress (MPa) and resulting strain (dimensionless) in a material under uniaxial tensile loading. The curve reveals distinct mechanical behavior regions — elastic deformation, yielding, strain hardening, and necking — culminating in fracture. It is the foundational plot for characterizing material mechanical properties and comparing material performance.
""" anyplot.ai
line-stress-strain: Engineering Stress-Strain Curve
Library: pygal 3.1.3 | Python 3.13.15
Quality: 89/100 | Created: 2026-08-24
"""
import os
import cairosvg
import numpy as np
import pygal
from pygal.style import Style
THEME = os.getenv("ANYPLOT_THEME", "light")
PAGE_BG = "#FAF8F1" if THEME == "light" else "#1A1A17"
INK = "#1A1A17" if THEME == "light" else "#F0EFE8"
INK_MUTED = "#6B6A63" if THEME == "light" else "#A8A79F"
# Imprint palette (first series always brand green) + semantic anchors.
# Series color order below matches the exact chart.add() call order further down
# (pygal has no per-series color override, so this is how each series gets its hue).
ANYPLOT_NEUTRAL = INK # baseline / reference-line role (theme-adaptive)
ANYPLOT_MUTED = INK_MUTED # secondary construction-line role (theme-adaptive)
UTS_COLOR = "#BD8233" # distinct Imprint hue so UTS reads apart from the Yield dot without the legend
SERIES_COLORS = ("#009E73", "#C475FD", "#4467A3", ANYPLOT_NEUTRAL, ANYPLOT_MUTED, ANYPLOT_NEUTRAL, UTS_COLOR, "#AE3030")
# Data - mild steel tensile test: elastic modulus, 0.2% offset yield, UTS, necking to fracture
np.random.seed(42)
YOUNGS_MODULUS = 200_000 # MPa (200 GPa)
ELASTIC_LIMIT_STRAIN = 250.0 / YOUNGS_MODULUS # end of the linear region, at 250 MPa
YIELD_STRAIN, YIELD_STRESS = 0.00325, 250.0 # 0.2% offset method: E * (strain - 0.002) = stress
UTS_STRAIN, UTS_STRESS = 0.21, 400.0
FRACTURE_STRAIN, FRACTURE_STRESS = 0.30, 330.0
PLATEAU_STRAIN_END = 0.02 # Luders plateau before strain hardening ramps up
elastic_strain = np.linspace(0, ELASTIC_LIMIT_STRAIN, 20)
elastic_stress = YOUNGS_MODULUS * elastic_strain
plateau_strain = np.linspace(ELASTIC_LIMIT_STRAIN, PLATEAU_STRAIN_END, 40)
plateau_stress = YIELD_STRESS + np.random.normal(0, 1.5, plateau_strain.size)
hardening_strain = np.linspace(PLATEAU_STRAIN_END, UTS_STRAIN, 140)
hardening_progress = (hardening_strain - PLATEAU_STRAIN_END) / (UTS_STRAIN - PLATEAU_STRAIN_END)
hardening_stress = YIELD_STRESS + (UTS_STRESS - YIELD_STRESS) * hardening_progress**0.4
hardening_stress += np.random.normal(0, 1.5, hardening_strain.size)
plastic_strain = np.concatenate([plateau_strain, hardening_strain])
plastic_stress = np.concatenate([plateau_stress, hardening_stress])
necking_strain = np.linspace(UTS_STRAIN, FRACTURE_STRAIN, 60)
necking_progress = (necking_strain - UTS_STRAIN) / (FRACTURE_STRAIN - UTS_STRAIN)
necking_stress = UTS_STRESS - (UTS_STRESS - FRACTURE_STRESS) * necking_progress**1.3
necking_stress += np.random.normal(0, 1.5, necking_strain.size)
# Construction lines for the 0.2% offset yield method (both capped at the same stress
# so the parallel, 0.002-strain-shifted geometry reads clearly)
construction_cap = 300.0
tangent_strain = (0, construction_cap / YOUNGS_MODULUS)
offset_strain = (0.002, construction_cap / YOUNGS_MODULUS + 0.002)
# Title - fontsize scales down only if the string exceeds the ~67-char baseline
title = "line-stress-strain · python · pygal · anyplot.ai"
title_font_size = 66 if len(title) <= 67 else max(44, round(66 * 67 / len(title)))
custom_style = Style(
background=PAGE_BG,
plot_background=PAGE_BG,
foreground=INK,
foreground_strong=INK,
foreground_subtle=INK_MUTED,
colors=SERIES_COLORS,
title_font_size=title_font_size,
label_font_size=56,
major_label_font_size=44,
legend_font_size=40,
value_font_size=36,
stroke_width=5,
)
chart = pygal.XY(
width=3200,
height=1800,
style=custom_style,
title=title,
x_title="Engineering Strain (mm/mm)",
y_title="Engineering Stress (MPa)",
show_legend=True,
legend_at_bottom=True,
legend_at_bottom_columns=3,
show_x_guides=False,
show_y_guides=True,
show_dots=False,
margin=110,
margin_top=500, # reserves a clear gutter below the title for the zoomed offset inset (see Step: Save)
margin_bottom=260,
margin_left=210,
margin_right=90,
xrange=(0, 0.33),
range=(0, 440),
x_labels_major_count=7,
show_minor_x_labels=False,
truncate_legend=-1,
)
chart.x_labels = [round(v, 2) for v in np.linspace(0, 0.30, 7)]
# Curve, split into the three labeled mechanical regions
chart.add("Elastic", list(zip(elastic_strain, elastic_stress, strict=True)), stroke_style={"width": 5})
chart.add(
"Plastic (Strain Hardening)", list(zip(plastic_strain, plastic_stress, strict=True)), stroke_style={"width": 5}
)
chart.add("Necking", list(zip(necking_strain, necking_stress, strict=True)), stroke_style={"width": 5})
# 0.2% offset construction: elastic-modulus tangent + its 0.002-strain-shifted twin
chart.add(
"Elastic Modulus (E ≈ 200 GPa)",
[(tangent_strain[0], 0), (tangent_strain[1], construction_cap)],
stroke_style={"width": 4, "dasharray": "18, 14"},
)
chart.add(
"0.2% Offset Line",
[(offset_strain[0], 0), (offset_strain[1], construction_cap)],
stroke_style={"width": 4, "dasharray": "18, 14"},
)
# Critical points
chart.add(
f"Yield Point (0.2% Offset) — {YIELD_STRESS:.0f} MPa",
[(YIELD_STRAIN, YIELD_STRESS)],
show_dots=True,
dots_size=11,
stroke=False,
)
chart.add(
f"Ultimate Tensile Strength — {UTS_STRESS:.0f} MPa",
[(UTS_STRAIN, UTS_STRESS)],
show_dots=True,
dots_size=11,
stroke=False,
)
chart.add(
f"Fracture Point — {FRACTURE_STRESS:.0f} MPa",
[(FRACTURE_STRAIN, FRACTURE_STRESS)],
show_dots=True,
dots_size=11,
stroke=False,
)
# Zoomed inset: the elastic-modulus tangent + 0.2% offset line are a ~0.35%-of-axis
# sliver on the main linear strain axis (yield strain 0.0033 vs. fracture strain 0.30),
# so pygal's own XY chart can't render them as distinguishable geometry at this scale.
# Hand-draw a small self-contained zoom panel (own axes, ticks, curve) directly as SVG
# markup and splice it into the reserved gutter below the title (margin_top=500 above).
INSET_X, INSET_Y, INSET_W, INSET_H = 260, 160, 900, 360
INSET_X_MAX = offset_strain[1] + 0.0004 # small headroom past the offset line's top end
INSET_Y_MAX = construction_cap + 20
FONT_STACK = "Consolas, 'Liberation Mono', Menlo, Courier, monospace"
def _inset_point(strain, stress):
x = INSET_X + (strain / INSET_X_MAX) * INSET_W
y = INSET_Y + INSET_H - (stress / INSET_Y_MAX) * INSET_H
return x, y
def _inset_polyline(points, color, width, dasharray=None):
path = " ".join(f"{x:.2f},{y:.2f}" for x, y in (_inset_point(s, v) for s, v in points))
dash = f' stroke-dasharray="{dasharray}"' if dasharray else ""
return f'<polyline points="{path}" fill="none" stroke="{color}" stroke-width="{width}"{dash} />'
def _build_offset_inset_svg():
parts = [f'<g class="offset-inset" font-family="{FONT_STACK}">']
parts.append(
f'<rect x="{INSET_X}" y="{INSET_Y}" width="{INSET_W}" height="{INSET_H}" '
f'fill="{PAGE_BG}" stroke="{INK_MUTED}" stroke-width="2" />'
)
parts.append(
f'<text x="{INSET_X + INSET_W / 2:.2f}" y="{INSET_Y - 18}" text-anchor="middle" '
f'fill="{INK}" font-size="32">Zoom: Elastic Modulus & 0.2% Offset Region</text>'
)
# Y ticks/gridlines (stress)
for y_val in (0, 100, 200, 300):
_, py = _inset_point(0, y_val)
parts.append(
f'<line x1="{INSET_X}" y1="{py:.2f}" x2="{INSET_X + INSET_W}" y2="{py:.2f}" stroke="{INK_MUTED}" stroke-width="1" stroke-opacity="0.35" />'
)
parts.append(
f'<text x="{INSET_X - 12}" y="{py + 8:.2f}" text-anchor="end" fill="{INK_MUTED}" font-size="24">{y_val}</text>'
)
# X ticks (strain)
for x_val in (0.0, 0.001, 0.002, 0.003):
px, _ = _inset_point(x_val, 0)
parts.append(
f'<line x1="{px:.2f}" y1="{INSET_Y}" x2="{px:.2f}" y2="{INSET_Y + INSET_H}" stroke="{INK_MUTED}" stroke-width="1" stroke-opacity="0.2" />'
)
parts.append(
f'<text x="{px:.2f}" y="{INSET_Y + INSET_H + 30}" text-anchor="middle" fill="{INK_MUTED}" font-size="24">{x_val:.3f}</text>'
)
# Elastic curve + the leading sliver of the plateau, in the same colors as the main chart
parts.append(_inset_polyline(zip(elastic_strain, elastic_stress, strict=True), "#009E73", 4))
plateau_mask = plateau_strain <= INSET_X_MAX
parts.append(
_inset_polyline(zip(plateau_strain[plateau_mask], plateau_stress[plateau_mask], strict=True), "#C475FD", 4)
)
# 0.2% offset construction, matching the main chart's dash + colors
parts.append(
_inset_polyline([(tangent_strain[0], 0), (tangent_strain[1], construction_cap)], ANYPLOT_NEUTRAL, 3, "12,10")
)
parts.append(
_inset_polyline([(offset_strain[0], 0), (offset_strain[1], construction_cap)], ANYPLOT_MUTED, 3, "12,10")
)
# Yield point marker
yx, yy = _inset_point(YIELD_STRAIN, YIELD_STRESS)
parts.append(f'<circle cx="{yx:.2f}" cy="{yy:.2f}" r="9" fill="{ANYPLOT_NEUTRAL}" />')
parts.append(f'<text x="{INSET_X + 12}" y="{INSET_Y + 30}" fill="{INK_MUTED}" font-size="24">Stress (MPa)</text>')
parts.append(
f'<text x="{INSET_X + INSET_W - 12}" y="{INSET_Y + INSET_H - 14}" text-anchor="end" '
f'fill="{INK_MUTED}" font-size="24">Strain (mm/mm)</text>'
)
parts.append("</g>")
return "".join(parts)
# Save: splice the hand-drawn inset into pygal's SVG before rasterizing/exporting so
# both the PNG and the interactive HTML carry the same zoomed offset-construction panel.
svg_markup = chart.render().decode("utf-8")
svg_markup = svg_markup.replace("</svg>", _build_offset_inset_svg() + "</svg>")
cairosvg.svg2png(
bytestring=svg_markup.encode("utf-8"), write_to=f"plot-{THEME}.png", output_width=3200, output_height=1800
)
with open(f"plot-{THEME}.html", "wb") as f:
f.write(svg_markup.encode("utf-8"))
Runnable source as JSON, for any HTTP client: https://api.anyplot.ai/specs/line-stress-strain/pygal/code. Any spec id and library id listed in llms-full.txt fit the same URL shape; every URL below is complete and callable.
{
  "spec_id": "line-stress-strain",
  "language": "python",
  "library": "pygal",
  "page": "https://anyplot.ai/line-stress-strain/python/pygal",
  "hub": "https://anyplot.ai/line-stress-strain",
  "code_json": "https://api.anyplot.ai/specs/line-stress-strain/pygal/code",
  "spec_json": "https://api.anyplot.ai/specs/line-stress-strain",
  "render_light_png": "https://storage.googleapis.com/anyplot-images/plots/line-stress-strain/python/pygal/plot-light.png",
  "render_dark_png": "https://storage.googleapis.com/anyplot-images/plots/line-stress-strain/python/pygal/plot-dark.png",
  "interactive_light_html": "https://storage.googleapis.com/anyplot-images/plots/line-stress-strain/python/pygal/plot-light.html",
  "interactive_dark_html": "https://storage.googleapis.com/anyplot-images/plots/line-stress-strain/python/pygal/plot-dark.html",
  "quality_score": 89.0,
  "license": "MIT",
  "guide": "https://anyplot.ai/llms.txt"
}
Part of Engineering Stress-Strain Curve on anyplot.ai.