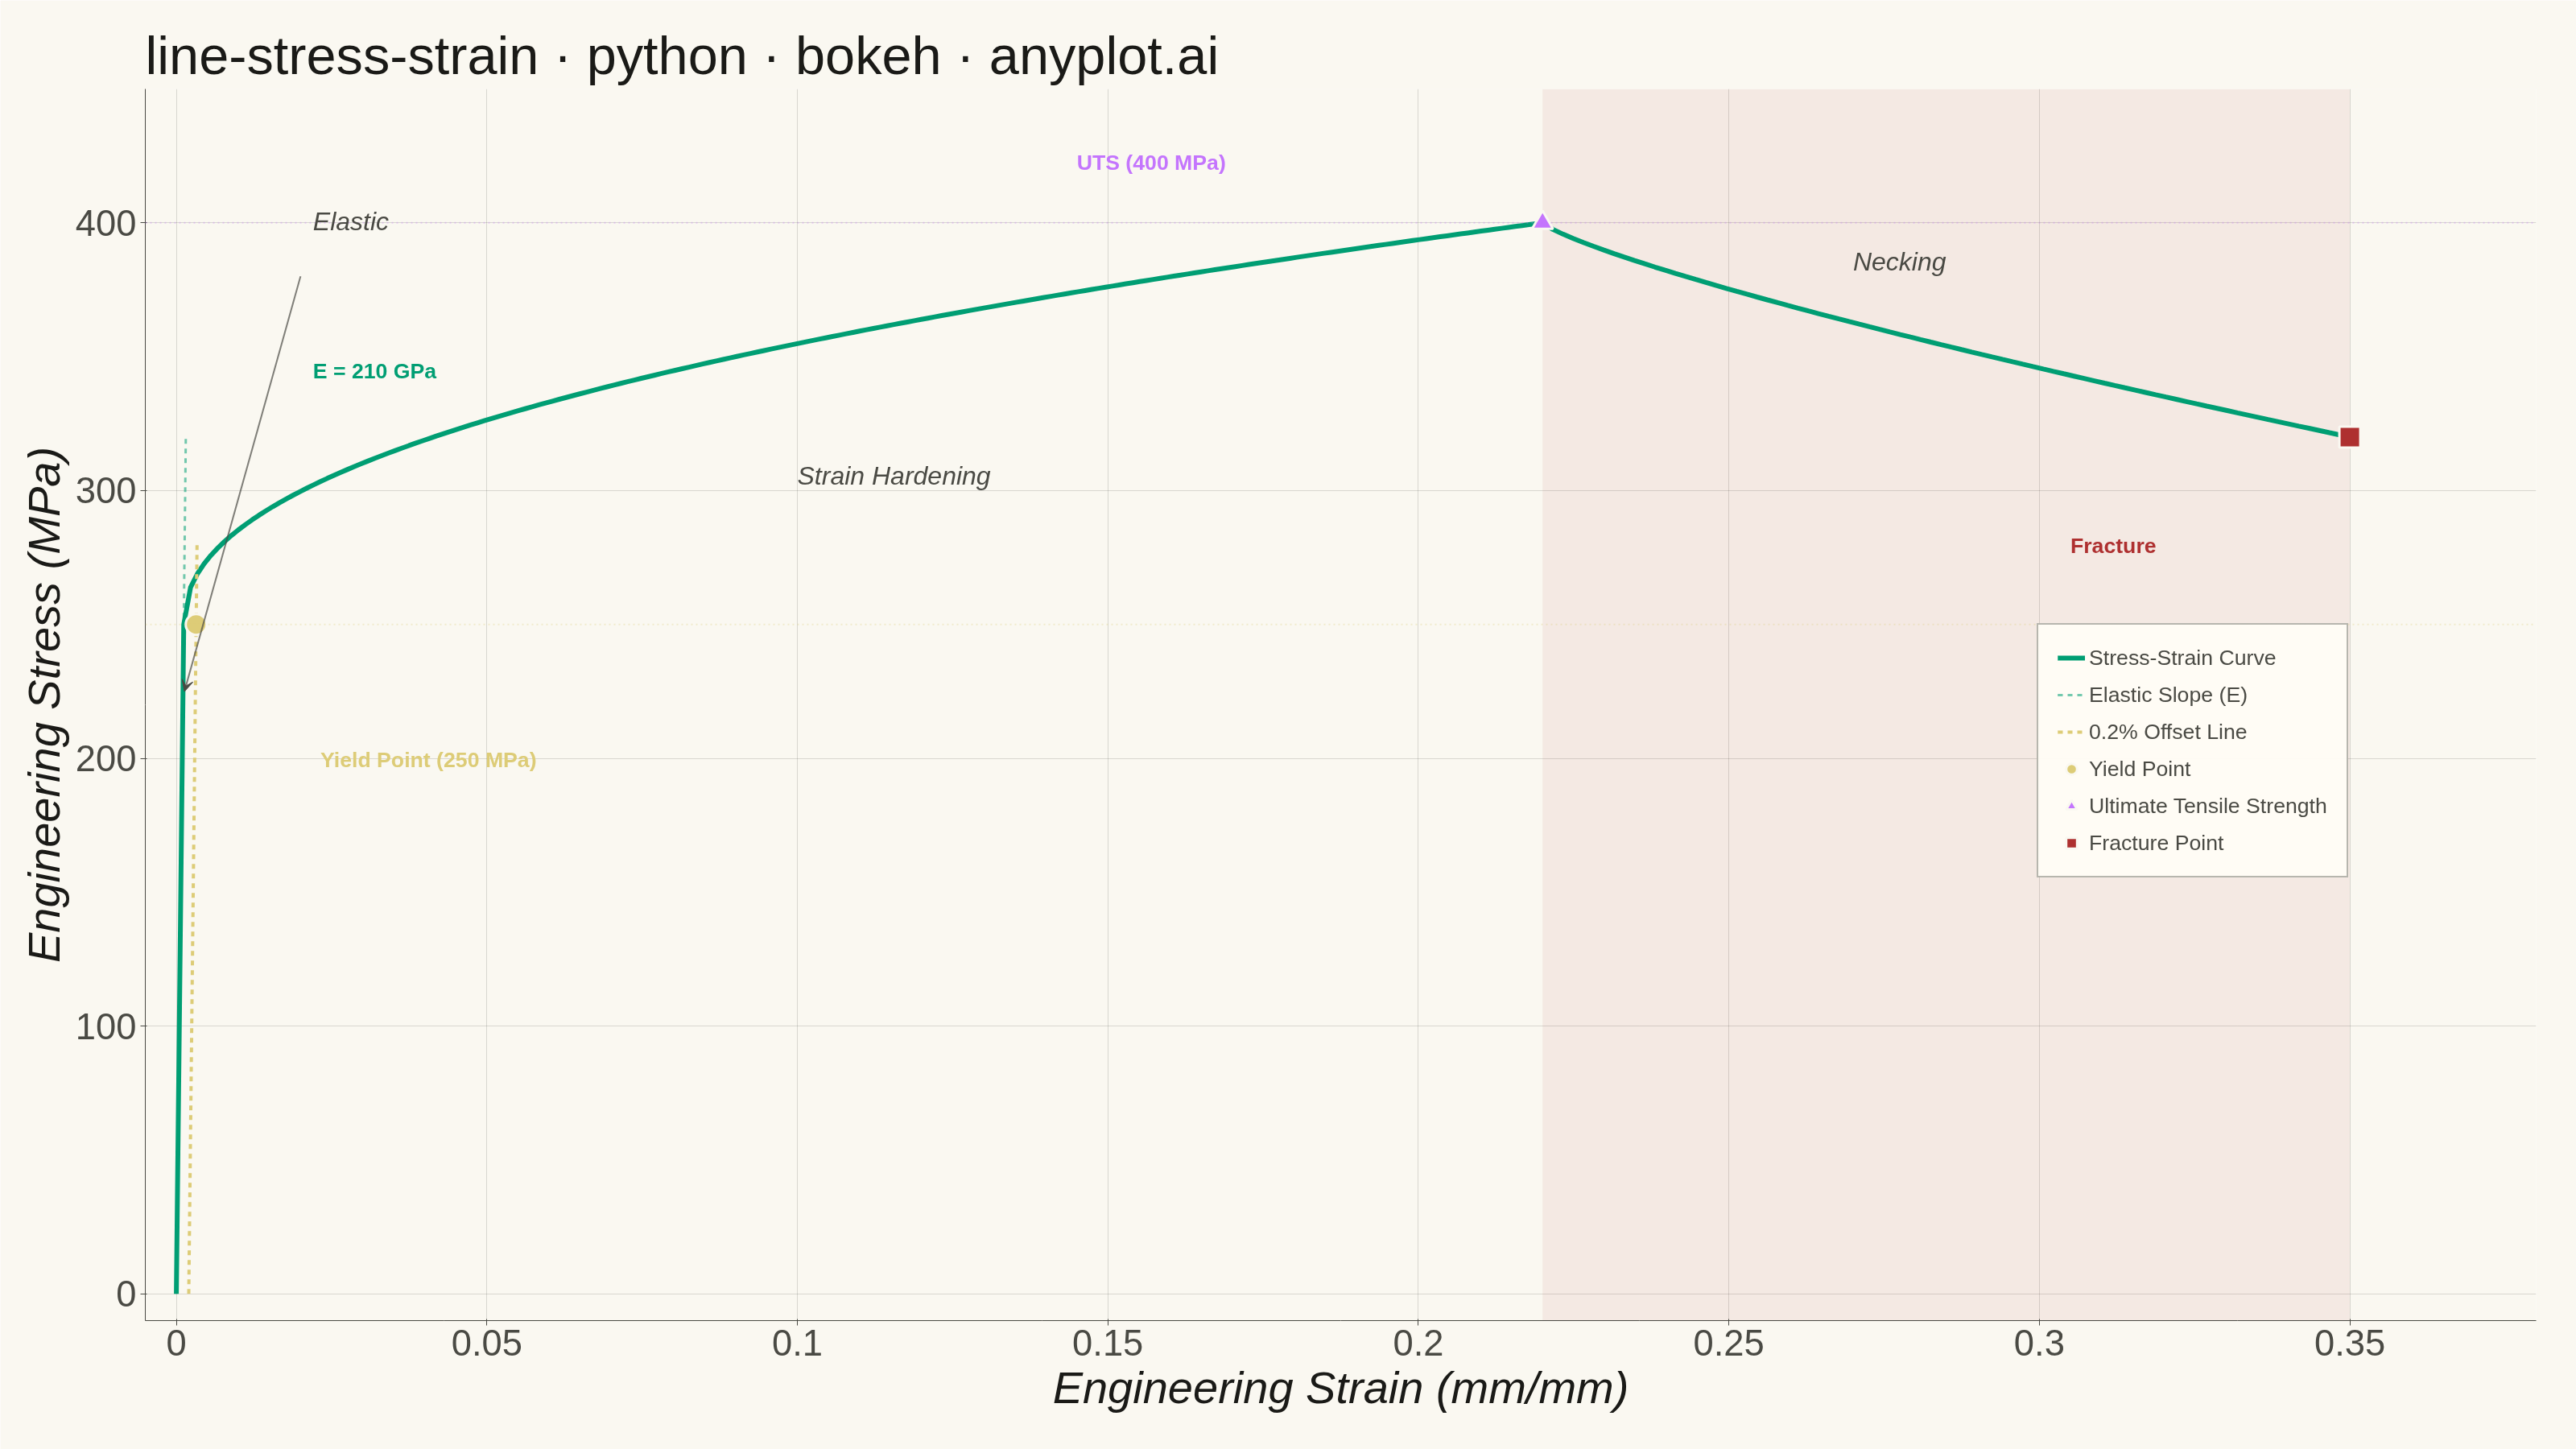
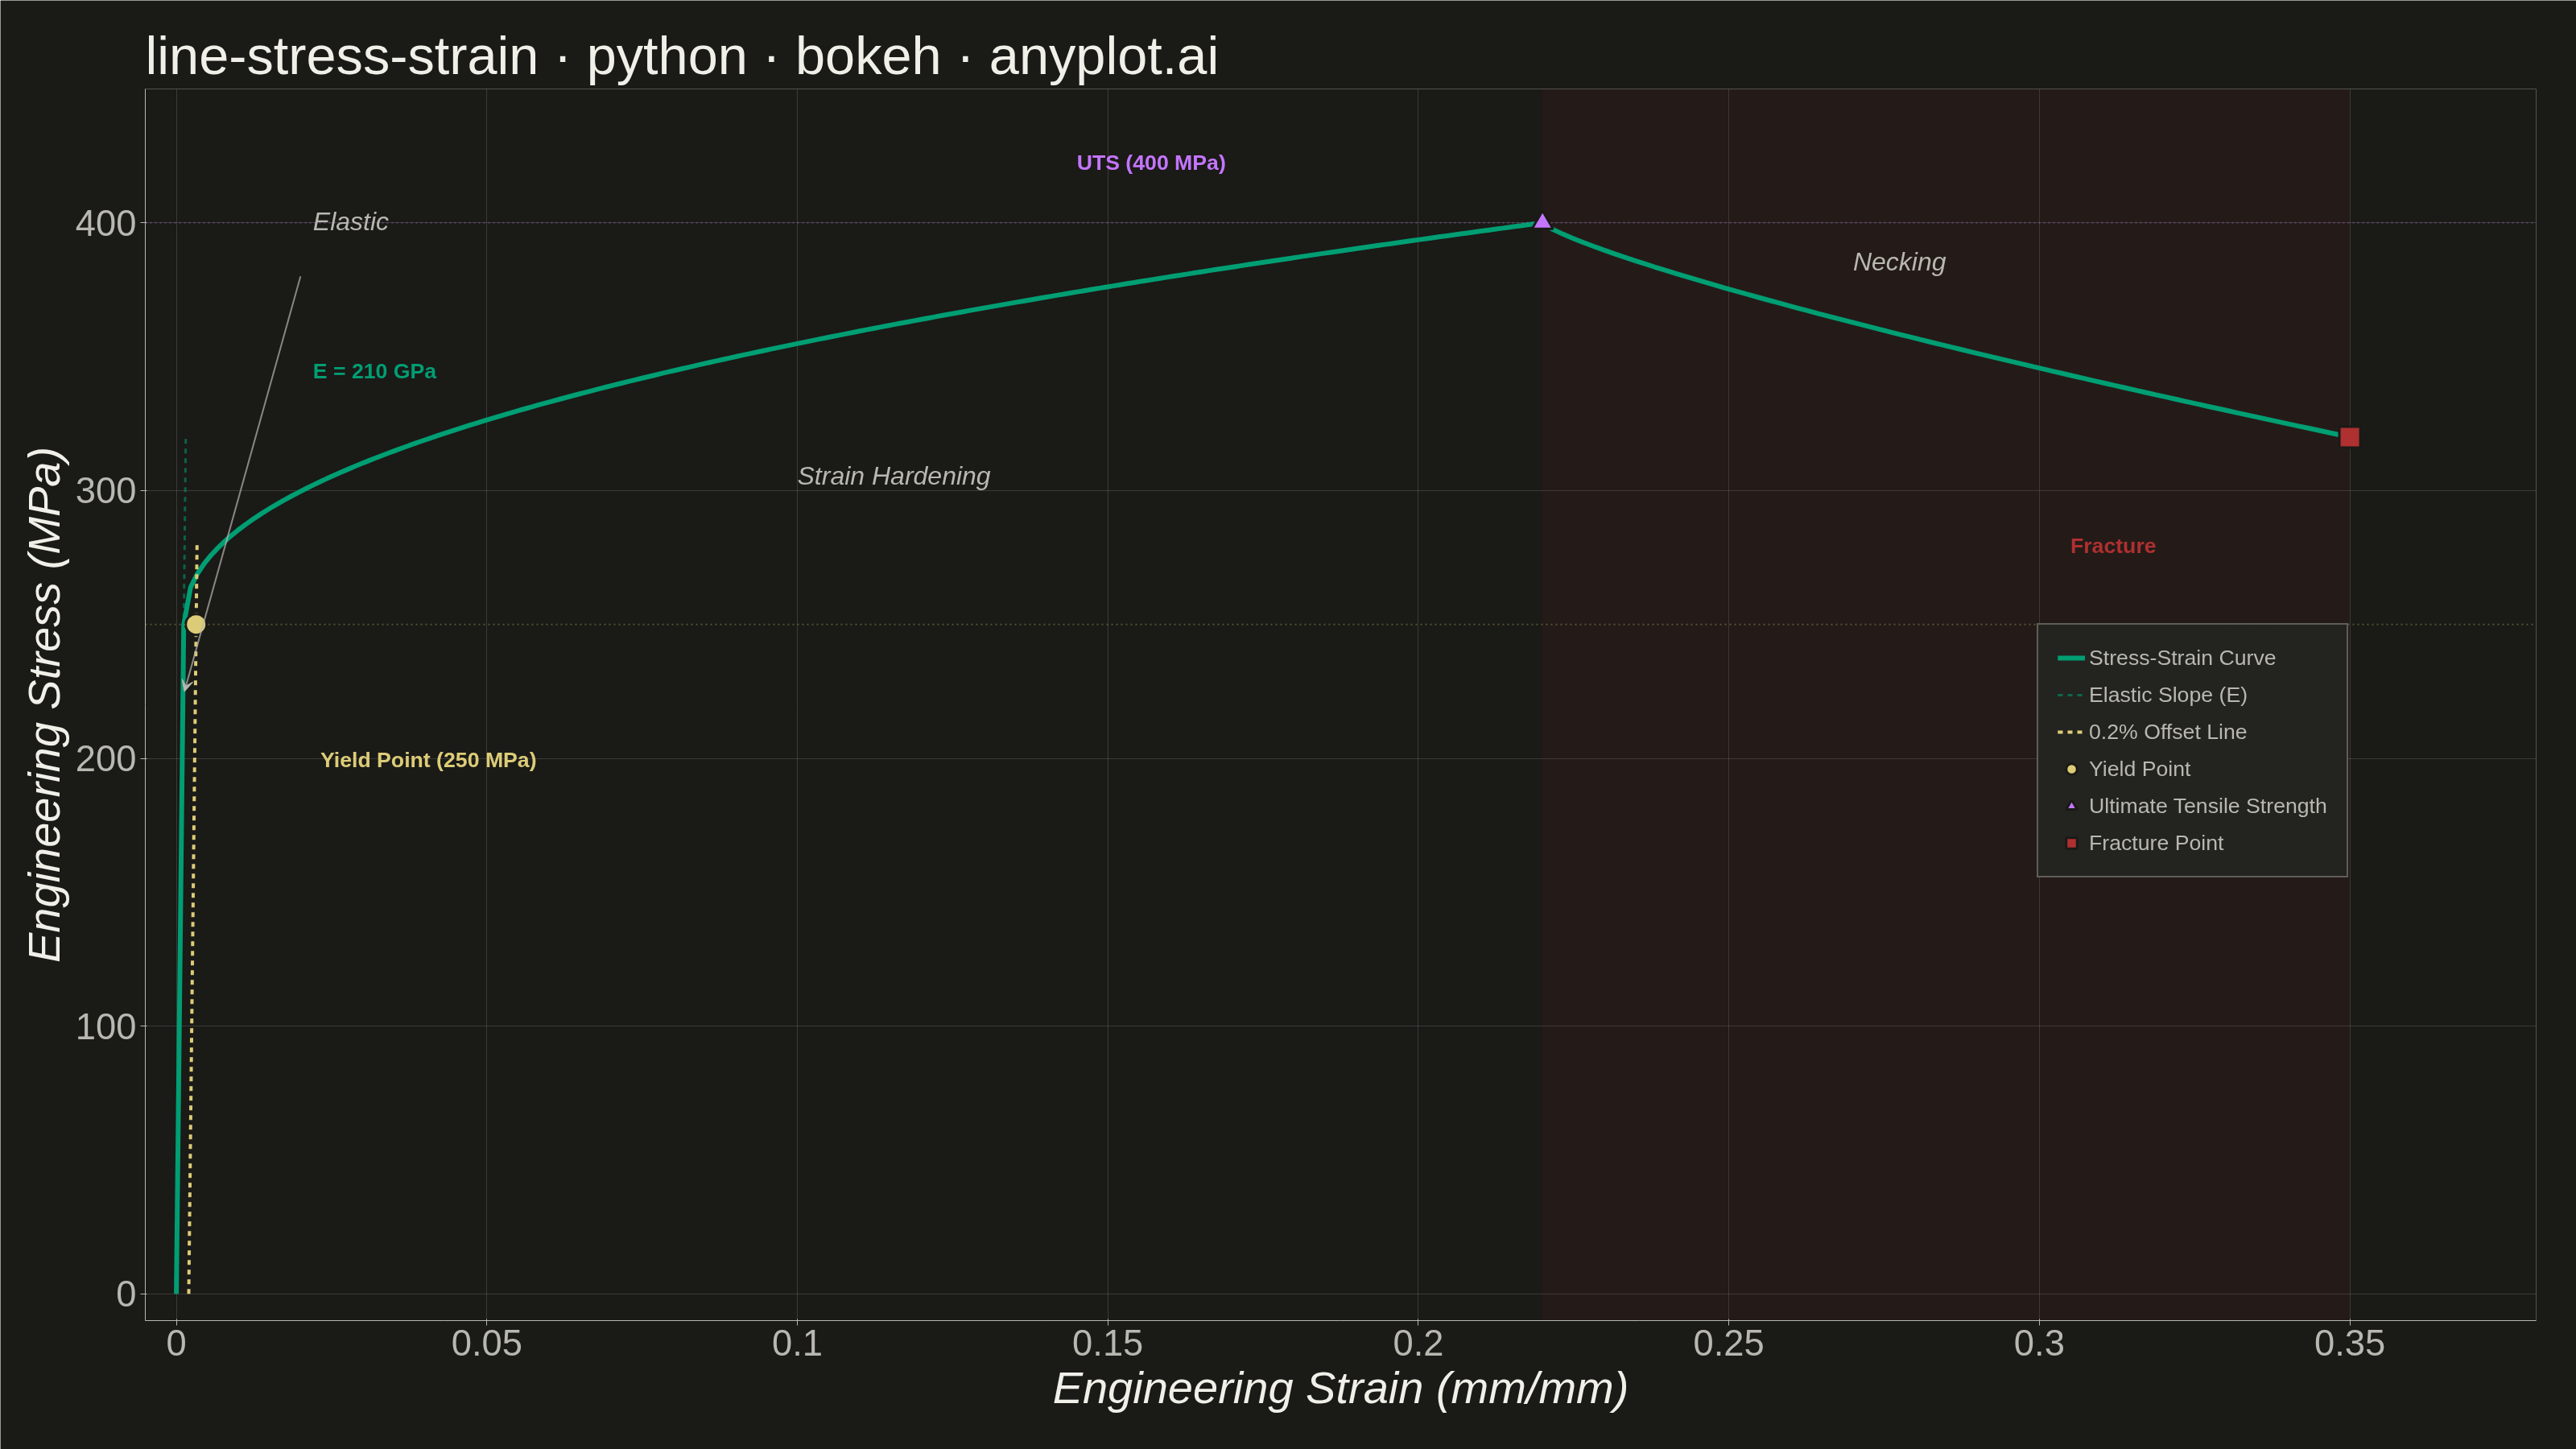
An engineering stress-strain curve visualizes the relationship between applied stress (MPa) and resulting strain (dimensionless) in a material under uniaxial tensile loading. The curve reveals distinct mechanical behavior regions — elastic deformation, yielding, strain hardening, and necking — culminating in fracture. It is the foundational plot for characterizing material mechanical properties and comparing material performance.
""" anyplot.ai
line-stress-strain: Engineering Stress-Strain Curve
Library: bokeh 3.9.2 | Python 3.13.15
Quality: 93/100 | Updated: 2026-08-17
"""

import os
import time
from pathlib import Path

import numpy as np
from bokeh.io import output_file, save
from bokeh.models import Arrow, BoxAnnotation, ColumnDataSource, HoverTool, Label, Legend, LegendItem, Span, VeeHead
from bokeh.plotting import figure
from selenium import webdriver
from selenium.webdriver.chrome.options import Options


# Theme
THEME = os.getenv("ANYPLOT_THEME", "light")
PAGE_BG = "#FAF8F1" if THEME == "light" else "#1A1A17"
ELEVATED_BG = "#FFFDF6" if THEME == "light" else "#242420"
INK = "#1A1A17" if THEME == "light" else "#F0EFE8"
INK_SOFT = "#4A4A44" if THEME == "light" else "#B8B7B0"

# Imprint palette — first series always brand green
IMPRINT_PALETTE = ["#009E73", "#C475FD", "#4467A3", "#BD8233", "#AE3030", "#2ABCCD", "#954477", "#99B314"]
color_main = IMPRINT_PALETTE[0]  # brand green — main stress-strain curve
color_yield = "#DDCC77"  # amber anchor — yield point / offset line (warning/threshold semantics)
color_uts = IMPRINT_PALETTE[1]  # lavender — ultimate tensile strength
color_fracture = IMPRINT_PALETTE[4]  # matte red — fracture point (failure semantics)
color_region = INK_SOFT

# Data — Mild steel tensile test simulation
np.random.seed(42)

youngs_modulus = 210000  # MPa
yield_strength = 250  # MPa
uts = 400  # MPa
fracture_strain = 0.35
uts_strain = 0.22
yield_strain = yield_strength / youngs_modulus  # ~0.00119

# Elastic region
strain_elastic = np.linspace(0, yield_strain, 60)
stress_elastic = youngs_modulus * strain_elastic

# Yield plateau and strain hardening (Ludwik-type power law)
strain_plastic = np.linspace(yield_strain, uts_strain, 200)
plastic_strain = strain_plastic - yield_strain
stress_plastic = yield_strength + (uts - yield_strength) * (plastic_strain / (uts_strain - yield_strain)) ** 0.45

# Necking region (stress decreases after UTS)
strain_necking = np.linspace(uts_strain, fracture_strain, 80)
necking_progress = (strain_necking - uts_strain) / (fracture_strain - uts_strain)
stress_necking = uts - (uts - 320) * necking_progress**0.8

# Combine all regions
strain = np.concatenate([strain_elastic, strain_plastic, strain_necking])
stress = np.concatenate([stress_elastic, stress_plastic, stress_necking])

# Region labels for hover tooltip
region_labels = np.concatenate(
    [
        np.full(len(strain_elastic), "Elastic"),
        np.full(len(strain_plastic), "Strain Hardening"),
        np.full(len(strain_necking), "Necking"),
    ]
)

# 0.2% offset line — extended to be clearly visible
offset_strain_start = 0.002
offset_strain_end = 0.004 + yield_strength / youngs_modulus
offset_strain_line = np.linspace(offset_strain_start, offset_strain_end, 80)
offset_stress_line = youngs_modulus * (offset_strain_line - 0.002)
mask = offset_stress_line <= yield_strength + 30
offset_strain_line = offset_strain_line[mask]
offset_stress_line = offset_stress_line[mask]

# Key points
yield_point_strain = yield_strain + 0.002
yield_point_stress = yield_strength
uts_point_strain = uts_strain
uts_point_stress = uts
fracture_point_strain = fracture_strain
fracture_point_stress = stress_necking[-1]

# Elastic-slope reference line — the ideal E*strain line extended past the
# actual yield point, so the near-vertical elastic segment reads as a
# deliberate slope reference rather than only a text annotation
elastic_ref_stress_end = 320
elastic_ref_strain = np.array([0.0, elastic_ref_stress_end / youngs_modulus])
elastic_ref_stress = np.array([0.0, elastic_ref_stress_end])

# Plot
title = "line-stress-strain · python · bokeh · anyplot.ai"
p = figure(
    width=3200,
    height=1800,
    title=title,
    x_axis_label="Engineering Strain (mm/mm)",
    y_axis_label="Engineering Stress (MPa)",
    toolbar_location=None,
    min_border_bottom=160,
    min_border_left=180,
    min_border_top=110,
    min_border_right=50,
)

# Necking zone — lightly shaded background band (underlay, behind the curve)
# so the fracture-bound region reads as the visual focal point of the story
p.add_layout(
    BoxAnnotation(
        left=uts_strain,
        right=fracture_strain,
        fill_color=color_fracture,
        fill_alpha=0.07,
        line_color=None,
        level="underlay",
    )
)

# Subtle horizontal reference lines at yield and UTS
p.add_layout(
    Span(
        location=yield_strength,
        dimension="width",
        line_color=color_yield,
        line_alpha=0.3,
        line_dash="dotted",
        line_width=2,
    )
)
p.add_layout(
    Span(location=uts, dimension="width", line_color=color_uts, line_alpha=0.3, line_dash="dotted", line_width=2)
)

# Main curve with region data for HoverTool
source = ColumnDataSource(data={"strain": strain, "stress": stress, "region": region_labels})
main_line = p.line(x="strain", y="stress", source=source, line_width=6, color=color_main)

# HoverTool — Bokeh-distinctive interactive feature
hover = HoverTool(
    renderers=[main_line],
    tooltips=[("Strain", "@strain{0.0000}"), ("Stress", "@stress{0.1} MPa"), ("Region", "@region")],
    mode="vline",
    line_policy="nearest",
)
p.add_tools(hover)

# 0.2% offset line
offset_source = ColumnDataSource(data={"strain": offset_strain_line, "stress": offset_stress_line})
offset_line = p.line(x="strain", y="stress", source=offset_source, line_width=4, line_dash="dashed", color=color_yield)

# Elastic-slope reference line — dashed, extending the E*strain line so the
# elastic modulus has a visible slope reference in addition to the text label
elastic_ref_line = p.line(
    x=elastic_ref_strain, y=elastic_ref_stress, line_width=3, line_dash="dashed", line_alpha=0.55, color=color_main
)

# Key points — sized for 3200x1800 canvas
yield_glyph = p.scatter(
    x=[yield_point_strain],
    y=[yield_point_stress],
    size=26,
    color=color_yield,
    marker="circle",
    line_color=PAGE_BG,
    line_width=3,
)

uts_glyph = p.scatter(
    x=[uts_point_strain],
    y=[uts_point_stress],
    size=26,
    color=color_uts,
    marker="triangle",
    line_color=PAGE_BG,
    line_width=3,
)

fracture_glyph = p.scatter(
    x=[fracture_point_strain],
    y=[fracture_point_stress],
    size=26,
    color=color_fracture,
    marker="square",
    line_color=PAGE_BG,
    line_width=3,
)

# Region labels — "Elastic" sits near the y-axis, next to the slope
# reference line, with a leader arrow pointing at the actual (compressed)
# near-vertical elastic segment so the label unambiguously names it
p.add_layout(
    Label(x=0.022, y=395, text="Elastic", text_font_size="24pt", text_color=color_region, text_font_style="italic")
)
p.add_layout(
    Arrow(
        end=VeeHead(size=14, fill_color=color_region, line_color=color_region),
        x_start=0.020,
        y_start=380,
        x_end=0.0013,
        y_end=225,
        line_color=color_region,
        line_alpha=0.7,
        line_width=2,
    )
)

p.add_layout(
    Label(
        x=0.10, y=300, text="Strain Hardening", text_font_size="24pt", text_color=color_region, text_font_style="italic"
    )
)

p.add_layout(
    Label(x=0.27, y=380, text="Necking", text_font_size="24pt", text_color=color_region, text_font_style="italic")
)

# Key point annotations — spread out to avoid left-side crowding
p.add_layout(
    Label(
        x=yield_point_strain + 0.02,
        y=yield_point_stress - 55,
        text=f"Yield Point ({yield_point_stress} MPa)",
        text_font_size="20pt",
        text_color=color_yield,
        text_font_style="bold",
    )
)

p.add_layout(
    Label(
        x=uts_point_strain - 0.075,
        y=uts_point_stress + 18,
        text=f"UTS ({uts_point_stress} MPa)",
        text_font_size="20pt",
        text_color=color_uts,
        text_font_style="bold",
    )
)

p.add_layout(
    Label(
        x=fracture_point_strain - 0.045,
        y=fracture_point_stress - 45,
        text="Fracture",
        text_font_size="20pt",
        text_color=color_fracture,
        text_font_style="bold",
    )
)

# Young's modulus annotation — stacked below the "Elastic" label, beside the
# dashed slope-reference line it describes
p.add_layout(
    Label(
        x=0.022,
        y=340,
        text=f"E = {youngs_modulus // 1000} GPa",
        text_font_size="20pt",
        text_color=color_main,
        text_font_style="bold",
    )
)

# Legend — elevated box, positioned lower-right away from curve congestion
legend = Legend(
    items=[
        LegendItem(label="Stress-Strain Curve", renderers=[main_line]),
        LegendItem(label="Elastic Slope (E)", renderers=[elastic_ref_line]),
        LegendItem(label="0.2% Offset Line", renderers=[offset_line]),
        LegendItem(label="Yield Point", renderers=[yield_glyph]),
        LegendItem(label="Ultimate Tensile Strength", renderers=[uts_glyph]),
        LegendItem(label="Fracture Point", renderers=[fracture_glyph]),
    ],
    location=(2350, 550),
)
legend.label_text_font_size = "20pt"
legend.label_text_color = INK_SOFT
legend.glyph_height = 34
legend.glyph_width = 34
legend.spacing = 12
legend.padding = 24
legend.margin = 24
legend.background_fill_color = ELEVATED_BG
legend.background_fill_alpha = 0.95
legend.border_line_color = INK_SOFT
legend.border_line_alpha = 0.4
legend.border_line_width = 2
p.add_layout(legend, "center")

# Theme-adaptive chrome
p.title.text_font_size = "50pt"
p.title.text_font_style = "normal"
p.title.text_color = INK
p.xaxis.axis_label_text_font_size = "42pt"
p.yaxis.axis_label_text_font_size = "42pt"
p.xaxis.major_label_text_font_size = "34pt"
p.yaxis.major_label_text_font_size = "34pt"
p.xaxis.axis_label_text_color = INK
p.yaxis.axis_label_text_color = INK
p.xaxis.major_label_text_color = INK_SOFT
p.yaxis.major_label_text_color = INK_SOFT
p.xaxis.axis_line_color = INK_SOFT
p.yaxis.axis_line_color = INK_SOFT
p.xaxis.major_tick_line_color = INK_SOFT
p.yaxis.major_tick_line_color = INK_SOFT
p.xaxis.minor_tick_line_color = None
p.yaxis.minor_tick_line_color = None

p.xgrid.grid_line_alpha = 0.15
p.ygrid.grid_line_alpha = 0.15
p.xgrid.grid_line_color = INK
p.ygrid.grid_line_color = INK

p.outline_line_color = None
p.background_fill_color = PAGE_BG
p.border_fill_color = PAGE_BG

p.y_range.start = -10
p.y_range.end = 450
p.x_range.start = -0.005
p.x_range.end = 0.38

# Save — write HTML, then screenshot with headless Chrome (export_png's chromedriver
# probe fails on this box; see prompts/library/bokeh.md)
output_file(f"plot-{THEME}.html", title=title)
save(p)

W, H = 3200, 1800
opts = Options()
for arg in (
    "--headless=new",
    "--no-sandbox",
    "--disable-dev-shm-usage",
    "--disable-gpu",
    f"--window-size={W},{H}",
    "--hide-scrollbars",
):
    opts.add_argument(arg)
driver = webdriver.Chrome(options=opts)
driver.set_window_size(W, H)
driver.get(f"file://{Path(f'plot-{THEME}.html').resolve()}")
driver.execute_cdp_cmd(
    "Emulation.setDeviceMetricsOverride", {"width": W, "height": H, "deviceScaleFactor": 1, "mobile": False}
)
time.sleep(3)
driver.save_screenshot(f"plot-{THEME}.png")
driver.quit()
Runnable source as JSON, for any HTTP client: https://api.anyplot.ai/specs/line-stress-strain/bokeh/code. Any spec id and library id listed in llms-full.txt fit the same URL shape; every URL below is complete and callable.
{
  "spec_id": "line-stress-strain",
  "language": "python",
  "library": "bokeh",
  "page": "https://anyplot.ai/line-stress-strain/python/bokeh",
  "hub": "https://anyplot.ai/line-stress-strain",
  "code_json": "https://api.anyplot.ai/specs/line-stress-strain/bokeh/code",
  "spec_json": "https://api.anyplot.ai/specs/line-stress-strain",
  "render_light_png": "https://storage.googleapis.com/anyplot-images/plots/line-stress-strain/python/bokeh/plot-light.png",
  "render_dark_png": "https://storage.googleapis.com/anyplot-images/plots/line-stress-strain/python/bokeh/plot-dark.png",
  "interactive_light_html": "https://storage.googleapis.com/anyplot-images/plots/line-stress-strain/python/bokeh/plot-light.html",
  "interactive_dark_html": "https://storage.googleapis.com/anyplot-images/plots/line-stress-strain/python/bokeh/plot-dark.html",
  "quality_score": 93.0,
  "license": "MIT",
  "guide": "https://anyplot.ai/llms.txt"
}
Part of Engineering Stress-Strain Curve on anyplot.ai.