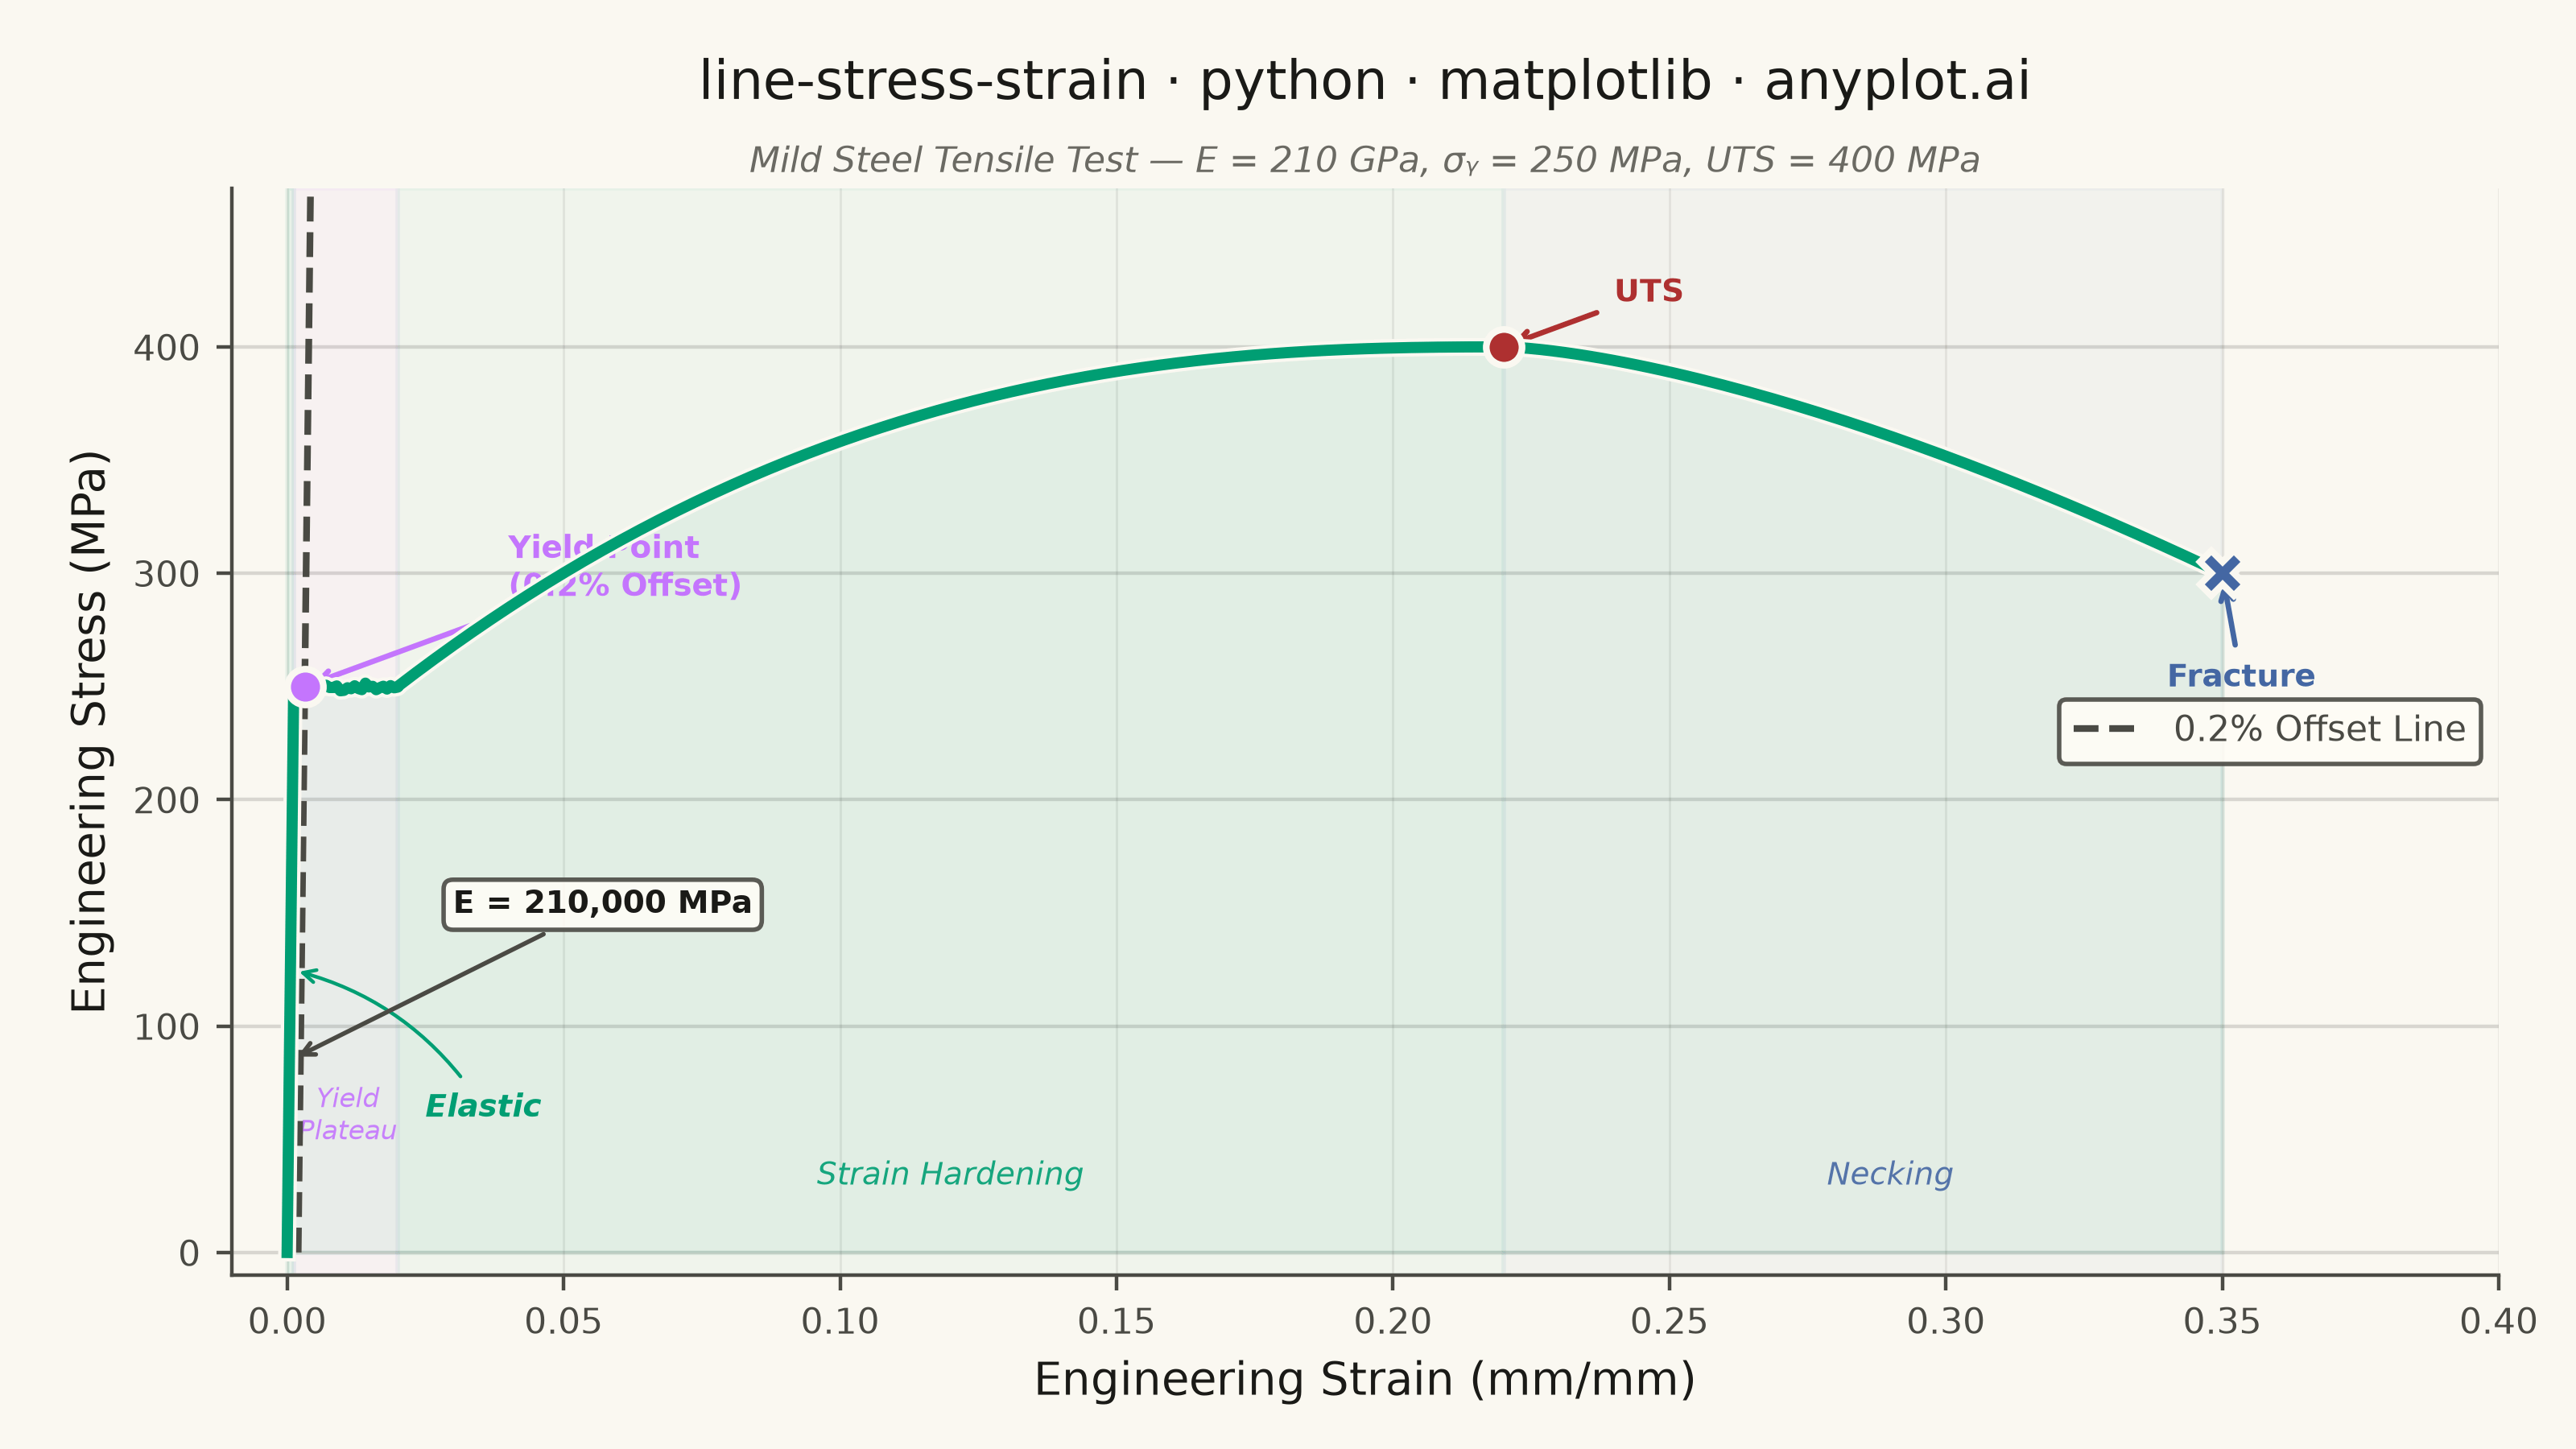
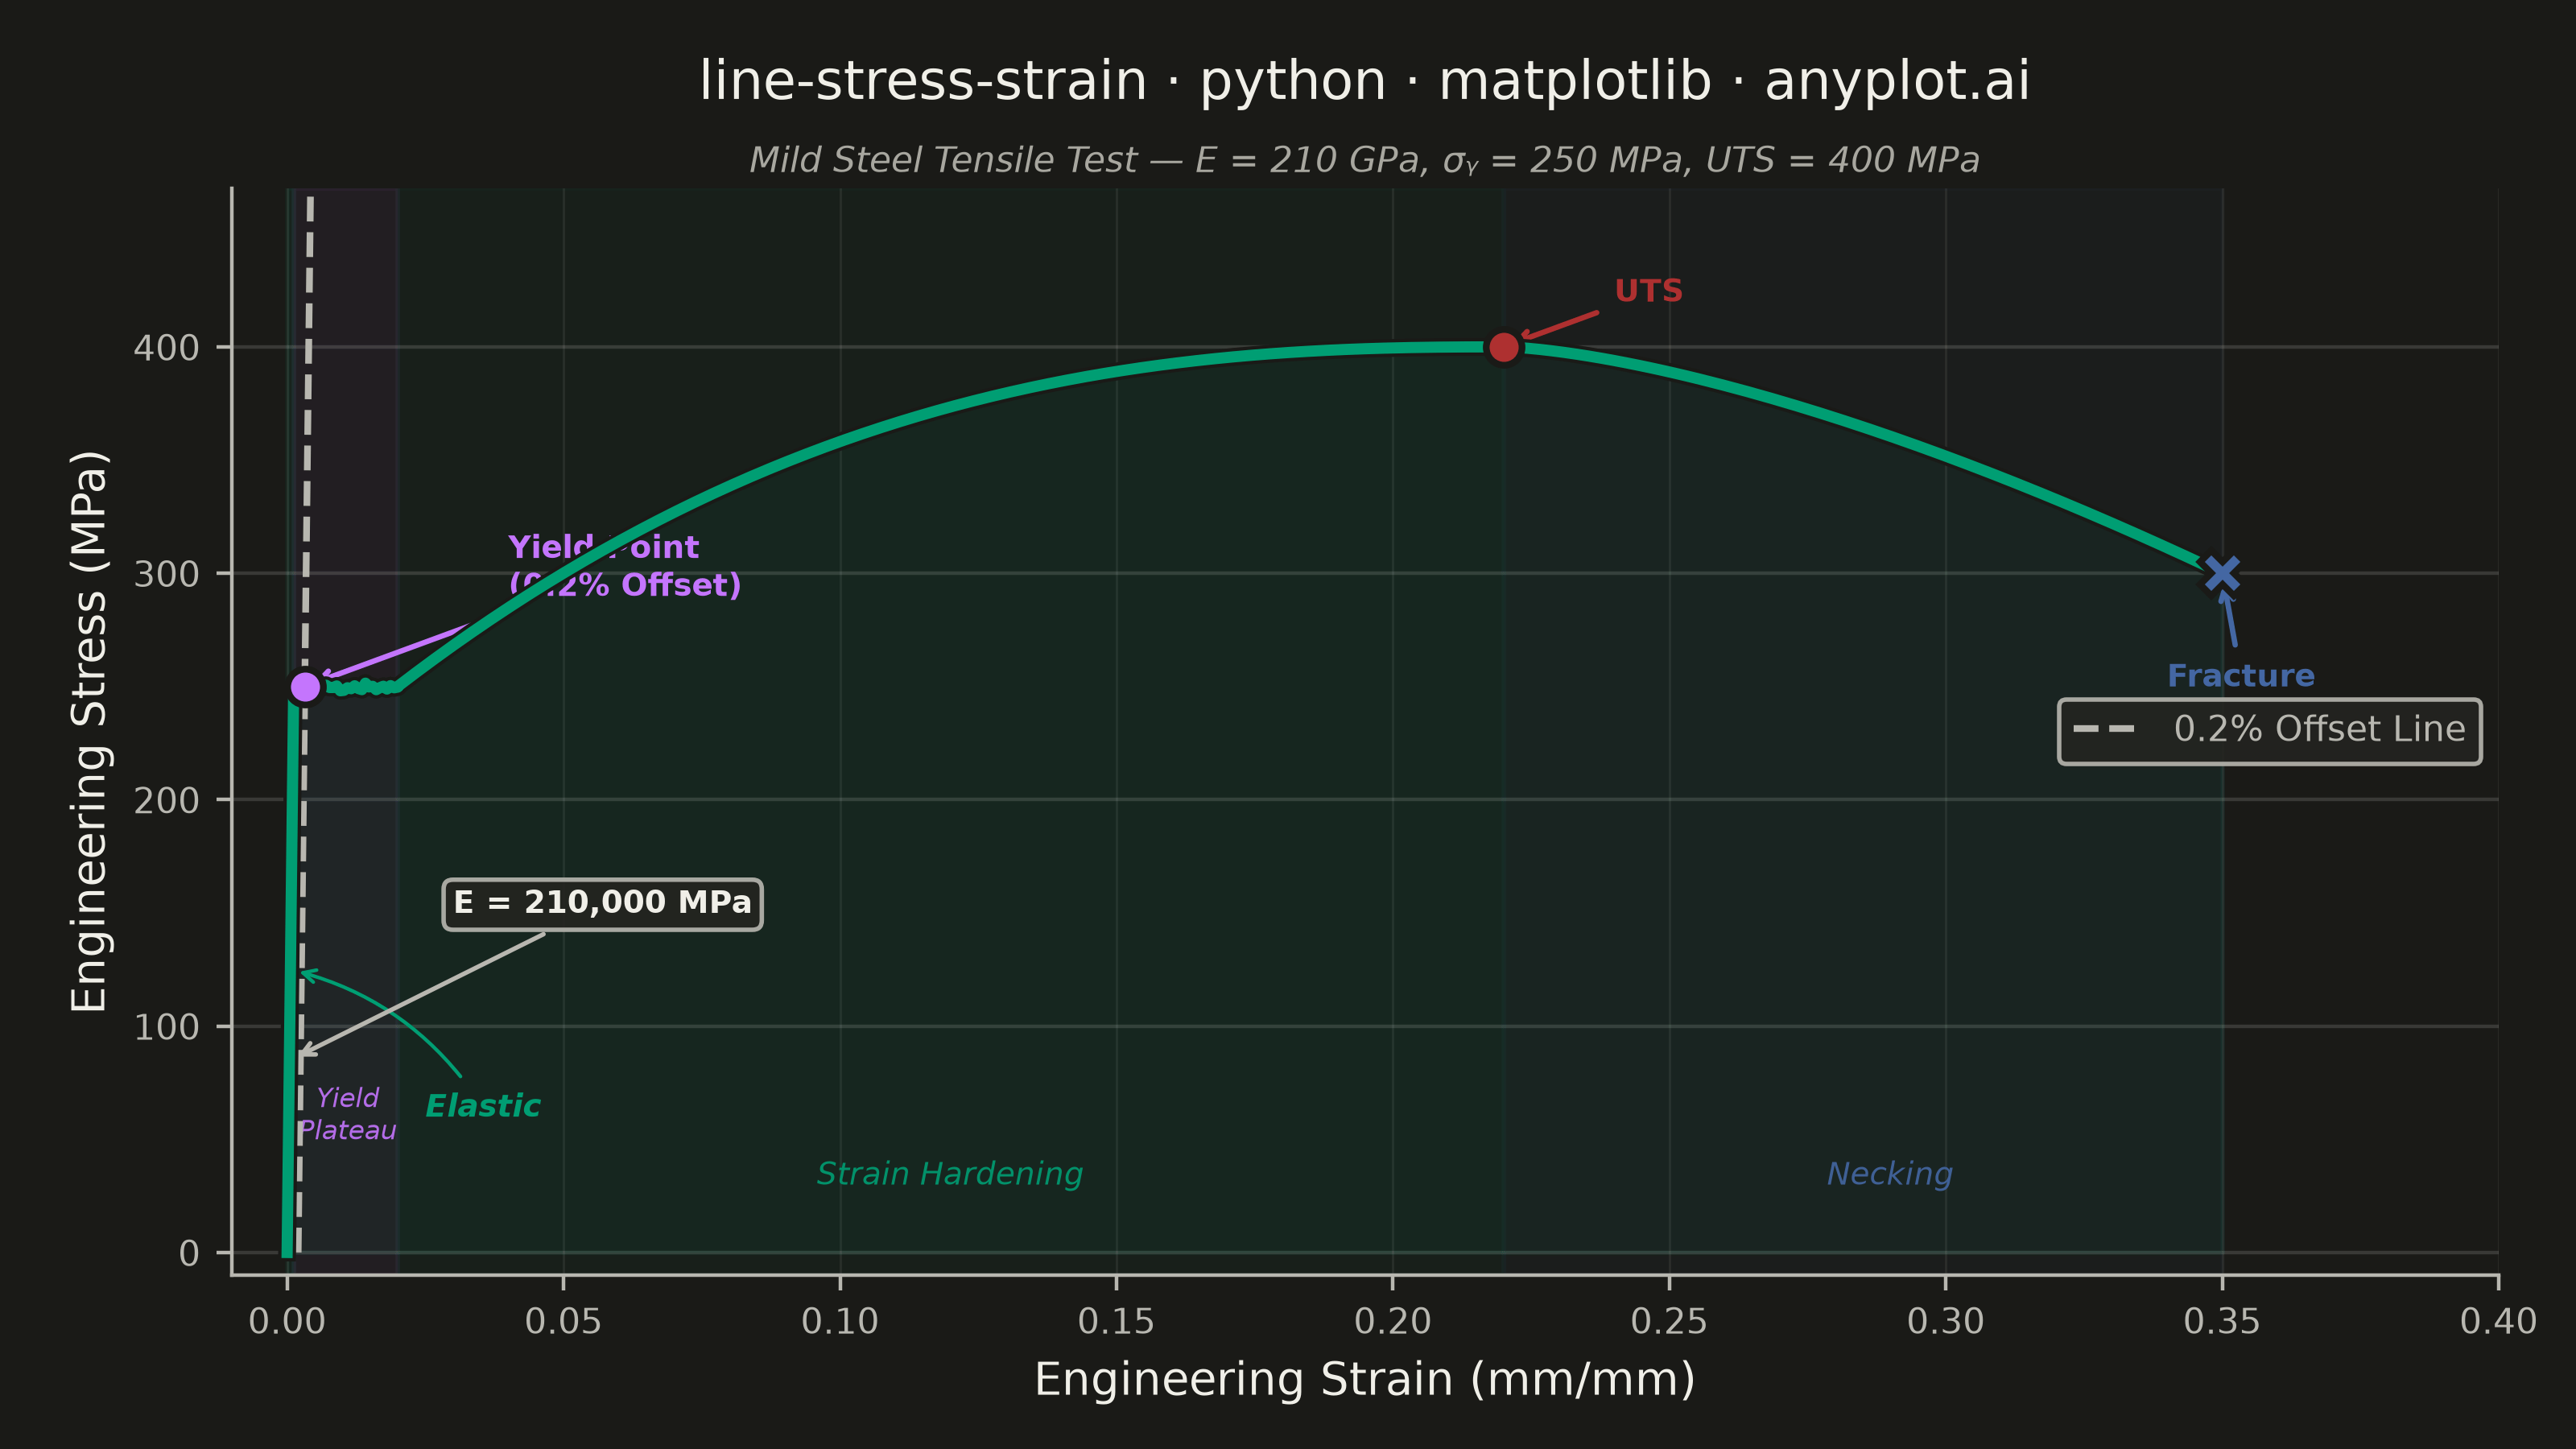
An engineering stress-strain curve visualizes the relationship between applied stress (MPa) and resulting strain (dimensionless) in a material under uniaxial tensile loading. The curve reveals distinct mechanical behavior regions — elastic deformation, yielding, strain hardening, and necking — culminating in fracture. It is the foundational plot for characterizing material mechanical properties and comparing material performance.
""" anyplot.ai
line-stress-strain: Engineering Stress-Strain Curve
Library: matplotlib 3.11.0 | Python 3.13.14
Quality: 87/100 | Updated: 2026-06-21
"""

import os

import matplotlib.patheffects as pe
import matplotlib.pyplot as plt
import numpy as np


# Theme tokens (Imprint palette — theme-adaptive chrome)
THEME = os.getenv("ANYPLOT_THEME", "light")
PAGE_BG = "#FAF8F1" if THEME == "light" else "#1A1A17"
ELEVATED_BG = "#FFFDF6" if THEME == "light" else "#242420"
INK = "#1A1A17" if THEME == "light" else "#F0EFE8"
INK_SOFT = "#4A4A44" if THEME == "light" else "#B8B7B0"
INK_MUTED = "#6B6A63" if THEME == "light" else "#A8A79F"

# Imprint palette — data colors, theme-independent
BRAND = "#009E73"  # position 1 — always first series (main curve)
LAVENDER = "#C475FD"  # position 2 — yield point marker
BLUE = "#4467A3"  # position 3 — fracture marker
RED = "#AE3030"  # position 5 — UTS marker (semantic limit anchor)

# Data — Mild steel tensile test (realistic stress-strain behavior)
np.random.seed(42)

youngs_modulus = 210000  # MPa
yield_stress = 250  # MPa
uts = 400  # MPa
fracture_strain = 0.35
uts_strain = 0.22
yield_strain = yield_stress / youngs_modulus

# Elastic region
strain_elastic = np.linspace(0, yield_strain, 60)
stress_elastic = youngs_modulus * strain_elastic

# Yield plateau (Lüders band, mild steel specific)
strain_plateau = np.linspace(yield_strain, 0.02, 30)
stress_plateau = np.full_like(strain_plateau, yield_stress) + np.random.normal(0, 1, len(strain_plateau))

# Strain hardening region
strain_hardening = np.linspace(0.02, uts_strain, 120)
t = (strain_hardening - 0.02) / (uts_strain - 0.02)
stress_hardening = yield_stress + (uts - yield_stress) * (1 - (1 - t) ** 2.5)

# Necking region (stress drops after UTS)
strain_necking = np.linspace(uts_strain, fracture_strain, 60)
t_neck = (strain_necking - uts_strain) / (fracture_strain - uts_strain)
stress_necking = uts - (uts - 300) * t_neck**1.5

# Combine all regions
strain = np.concatenate([strain_elastic, strain_plateau, strain_hardening, strain_necking])
stress = np.concatenate([stress_elastic, stress_plateau, stress_hardening, stress_necking])

# 0.2% offset yield point construction
offset = 0.002
offset_line_strain = np.linspace(offset, offset + yield_stress / youngs_modulus + 0.003, 50)
offset_line_stress = youngs_modulus * (offset_line_strain - offset)
offset_yield_strain = offset + yield_stress / youngs_modulus
offset_yield_stress = yield_stress

# Plot — landscape 3200×1800 px (figsize=(8,4.5) × dpi=400)
fig, ax = plt.subplots(figsize=(8, 4.5), dpi=400, facecolor=PAGE_BG)
ax.set_facecolor(PAGE_BG)

# Main stress-strain curve — Imprint brand green (position 1)
ax.fill_between(strain, stress, alpha=0.06, color=BRAND, zorder=2)
ax.plot(
    strain,
    stress,
    linewidth=2.5,
    color=BRAND,
    zorder=5,
    path_effects=[pe.Stroke(linewidth=4, foreground=PAGE_BG), pe.Normal()],
)

# 0.2% offset reference line
ax.plot(
    offset_line_strain,
    offset_line_stress,
    linewidth=1.5,
    color=INK_SOFT,
    linestyle="--",
    zorder=4,
    label="0.2% Offset Line",
)

# Yield point marker and annotation
ax.plot(
    offset_yield_strain,
    offset_yield_stress,
    "o",
    markersize=8,
    color=LAVENDER,
    markeredgecolor=PAGE_BG,
    markeredgewidth=1.5,
    zorder=6,
)
ax.annotate(
    "Yield Point\n(0.2% Offset)",
    xy=(offset_yield_strain, offset_yield_stress),
    xytext=(0.06, yield_stress + 70),
    fontsize=7,
    color=LAVENDER,
    fontweight="bold",
    arrowprops={"arrowstyle": "->", "color": LAVENDER, "lw": 1.2},
    bbox={"boxstyle": "round,pad=0.25", "facecolor": ELEVATED_BG, "edgecolor": LAVENDER, "alpha": 0.85},
)

# UTS marker and annotation
ax.plot(uts_strain, uts, "o", markersize=8, color=RED, markeredgecolor=PAGE_BG, markeredgewidth=1.5, zorder=6)
ax.annotate(
    "UTS",
    xy=(uts_strain, uts),
    xytext=(uts_strain + 0.02, uts + 20),
    fontsize=7,
    color=RED,
    fontweight="bold",
    arrowprops={"arrowstyle": "->", "color": RED, "lw": 1.2},
)

# Fracture marker and annotation
fracture_stress = stress_necking[-1]
ax.plot(
    fracture_strain,
    fracture_stress,
    "X",
    markersize=10,
    color=BLUE,
    markeredgecolor=PAGE_BG,
    markeredgewidth=1.5,
    zorder=6,
)
ax.annotate(
    "Fracture",
    xy=(fracture_strain, fracture_stress),
    xytext=(fracture_strain - 0.01, fracture_stress - 50),
    fontsize=7,
    color=BLUE,
    fontweight="bold",
    arrowprops={"arrowstyle": "->", "color": BLUE, "lw": 1.2},
)

# Region shading (axvspan) with Imprint palette colors at low alpha
region_bounds = [(0, yield_strain), (yield_strain, 0.02), (0.02, uts_strain), (uts_strain, fracture_strain)]
region_colors = [BRAND, LAVENDER, BRAND, BLUE]
region_alphas = [0.07, 0.05, 0.04, 0.04]

for (x0, x1), color, alpha in zip(region_bounds, region_colors, region_alphas, strict=False):
    ax.axvspan(x0, x1, alpha=alpha, color=color, zorder=1)

# Region labels — elastic zone is too narrow for direct label, use annotate with arc arrow
ax.annotate(
    "Elastic",
    xy=(yield_strain / 2, 125),
    xytext=(0.025, 60),
    fontsize=7,
    color=BRAND,
    fontstyle="italic",
    fontweight="semibold",
    arrowprops={"arrowstyle": "->", "color": BRAND, "lw": 0.8, "connectionstyle": "arc3,rad=0.2"},
)
ax.text(0.011, 50, "Yield\nPlateau", fontsize=7, ha="center", color=LAVENDER, fontstyle="italic", alpha=0.9)
ax.text(0.12, 30, "Strain Hardening", fontsize=7, ha="center", color=BRAND, fontstyle="italic", alpha=0.9)
ax.text(0.29, 30, "Necking", fontsize=7, ha="center", color=BLUE, fontstyle="italic", alpha=0.9)

# Elastic modulus annotation box
mid_elastic = len(strain_elastic) // 3
ax.annotate(
    f"E = {youngs_modulus:,} MPa",
    xy=(strain_elastic[mid_elastic], stress_elastic[mid_elastic]),
    xytext=(0.03, 150),
    fontsize=7,
    color=INK,
    fontweight="semibold",
    arrowprops={"arrowstyle": "->", "color": INK_SOFT, "lw": 1.0},
    bbox={"boxstyle": "round,pad=0.3", "facecolor": ELEVATED_BG, "edgecolor": INK_SOFT, "alpha": 0.9},
)

# Style — axis labels, title, ticks, spines, grid
title = "line-stress-strain · python · matplotlib · anyplot.ai"
ax.set_xlabel("Engineering Strain (mm/mm)", fontsize=10, color=INK)
ax.set_ylabel("Engineering Stress (MPa)", fontsize=10, color=INK)
ax.set_title(title, fontsize=12, fontweight="medium", pad=20, color=INK)
ax.text(
    0.5,
    1.015,
    "Mild Steel Tensile Test — E = 210 GPa, σᵧ = 250 MPa, UTS = 400 MPa",
    transform=ax.transAxes,
    fontsize=8,
    ha="center",
    color=INK_MUTED,
    fontstyle="italic",
)
ax.tick_params(axis="both", labelsize=8, colors=INK_SOFT, labelcolor=INK_SOFT)
for spine in ["top", "right"]:
    ax.spines[spine].set_visible(False)
for spine in ["bottom", "left"]:
    ax.spines[spine].set_linewidth(0.8)
    ax.spines[spine].set_color(INK_SOFT)
ax.yaxis.grid(True, alpha=0.15, linewidth=0.8, color=INK)
ax.xaxis.grid(True, alpha=0.08, linewidth=0.5, color=INK)
ax.set_xlim(-0.01, 0.40)
ax.set_ylim(-10, 470)

leg = ax.legend(fontsize=8, loc="center right", framealpha=0.9)
if leg:
    leg.get_frame().set_facecolor(ELEVATED_BG)
    leg.get_frame().set_edgecolor(INK_SOFT)
    plt.setp(leg.get_texts(), color=INK_SOFT)

fig.subplots_adjust(left=0.09, right=0.97, top=0.87, bottom=0.12)

# Save — no bbox_inches='tight' (would trim canvas away from 3200×1800 target)
plt.savefig(f"plot-{THEME}.png", dpi=400, facecolor=PAGE_BG)
Runnable source as JSON, for any HTTP client: https://api.anyplot.ai/specs/line-stress-strain/matplotlib/code. Any spec id and library id listed in llms-full.txt fit the same URL shape; every URL below is complete and callable.
{
  "spec_id": "line-stress-strain",
  "language": "python",
  "library": "matplotlib",
  "page": "https://anyplot.ai/line-stress-strain/python/matplotlib",
  "hub": "https://anyplot.ai/line-stress-strain",
  "code_json": "https://api.anyplot.ai/specs/line-stress-strain/matplotlib/code",
  "spec_json": "https://api.anyplot.ai/specs/line-stress-strain",
  "render_light_png": "https://storage.googleapis.com/anyplot-images/plots/line-stress-strain/python/matplotlib/plot-light.png",
  "render_dark_png": "https://storage.googleapis.com/anyplot-images/plots/line-stress-strain/python/matplotlib/plot-dark.png",
  "quality_score": 87.0,
  "license": "MIT",
  "guide": "https://anyplot.ai/llms.txt"
}
Part of Engineering Stress-Strain Curve on anyplot.ai.