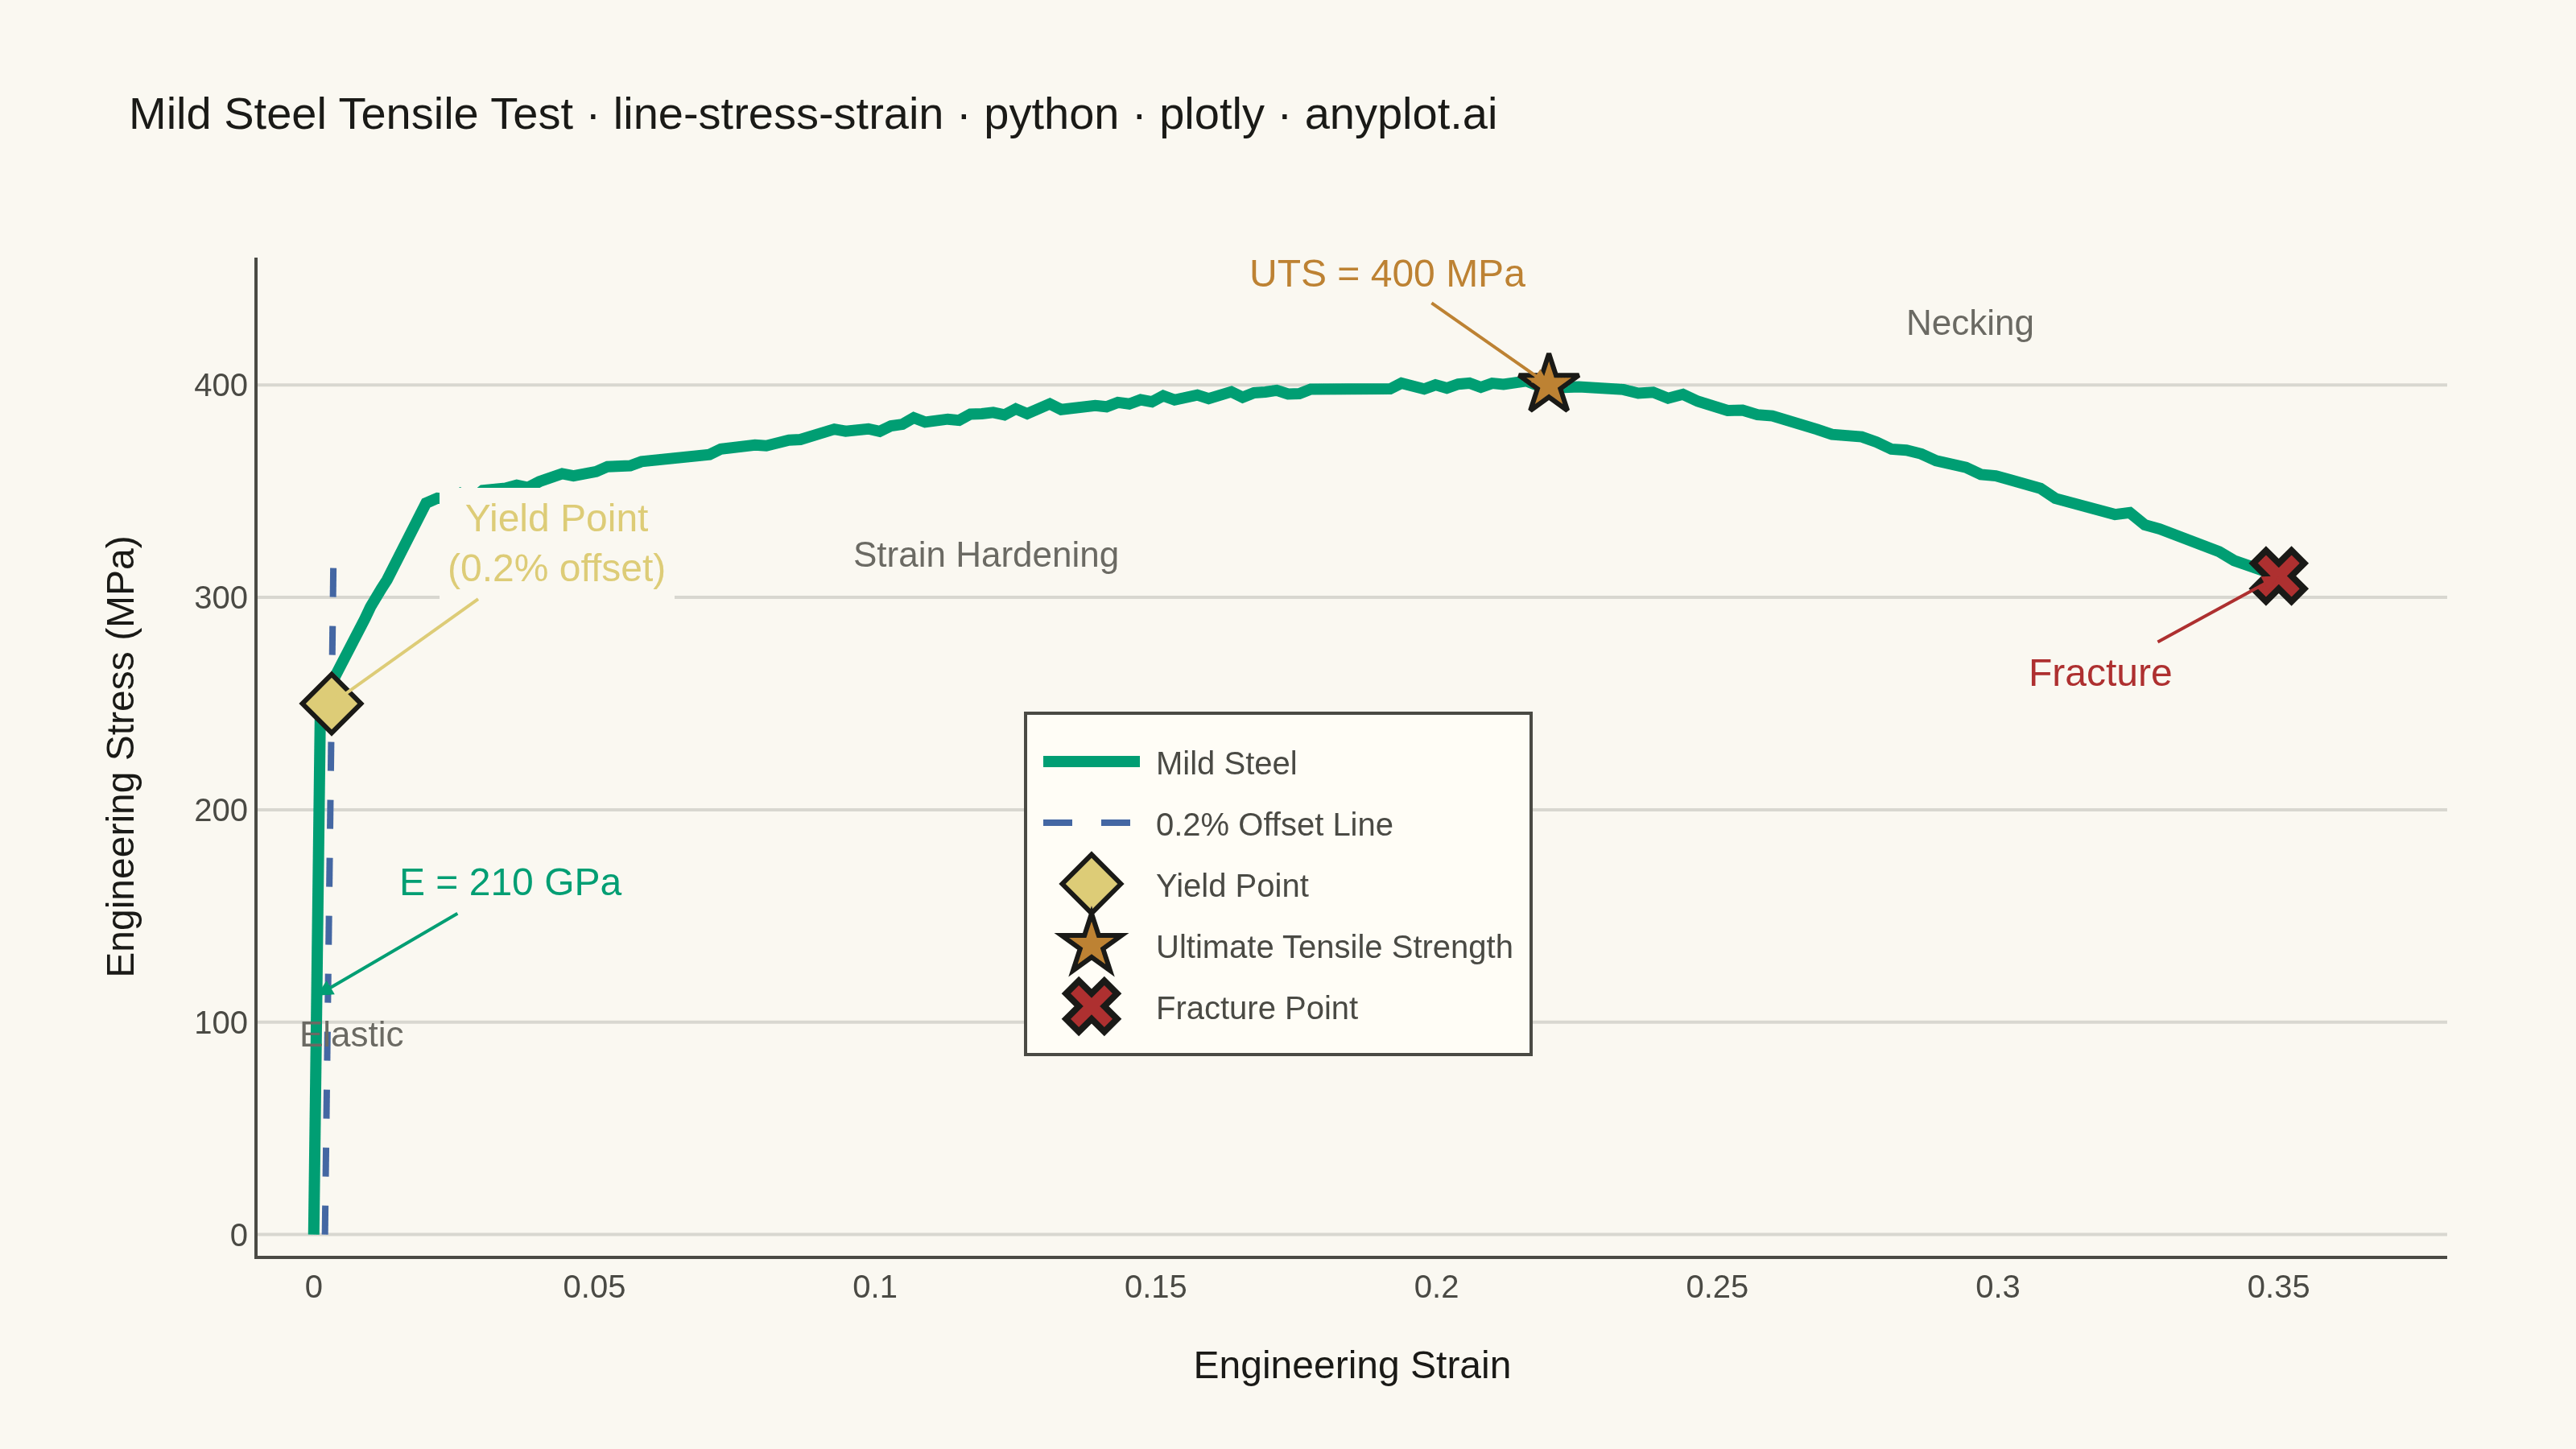
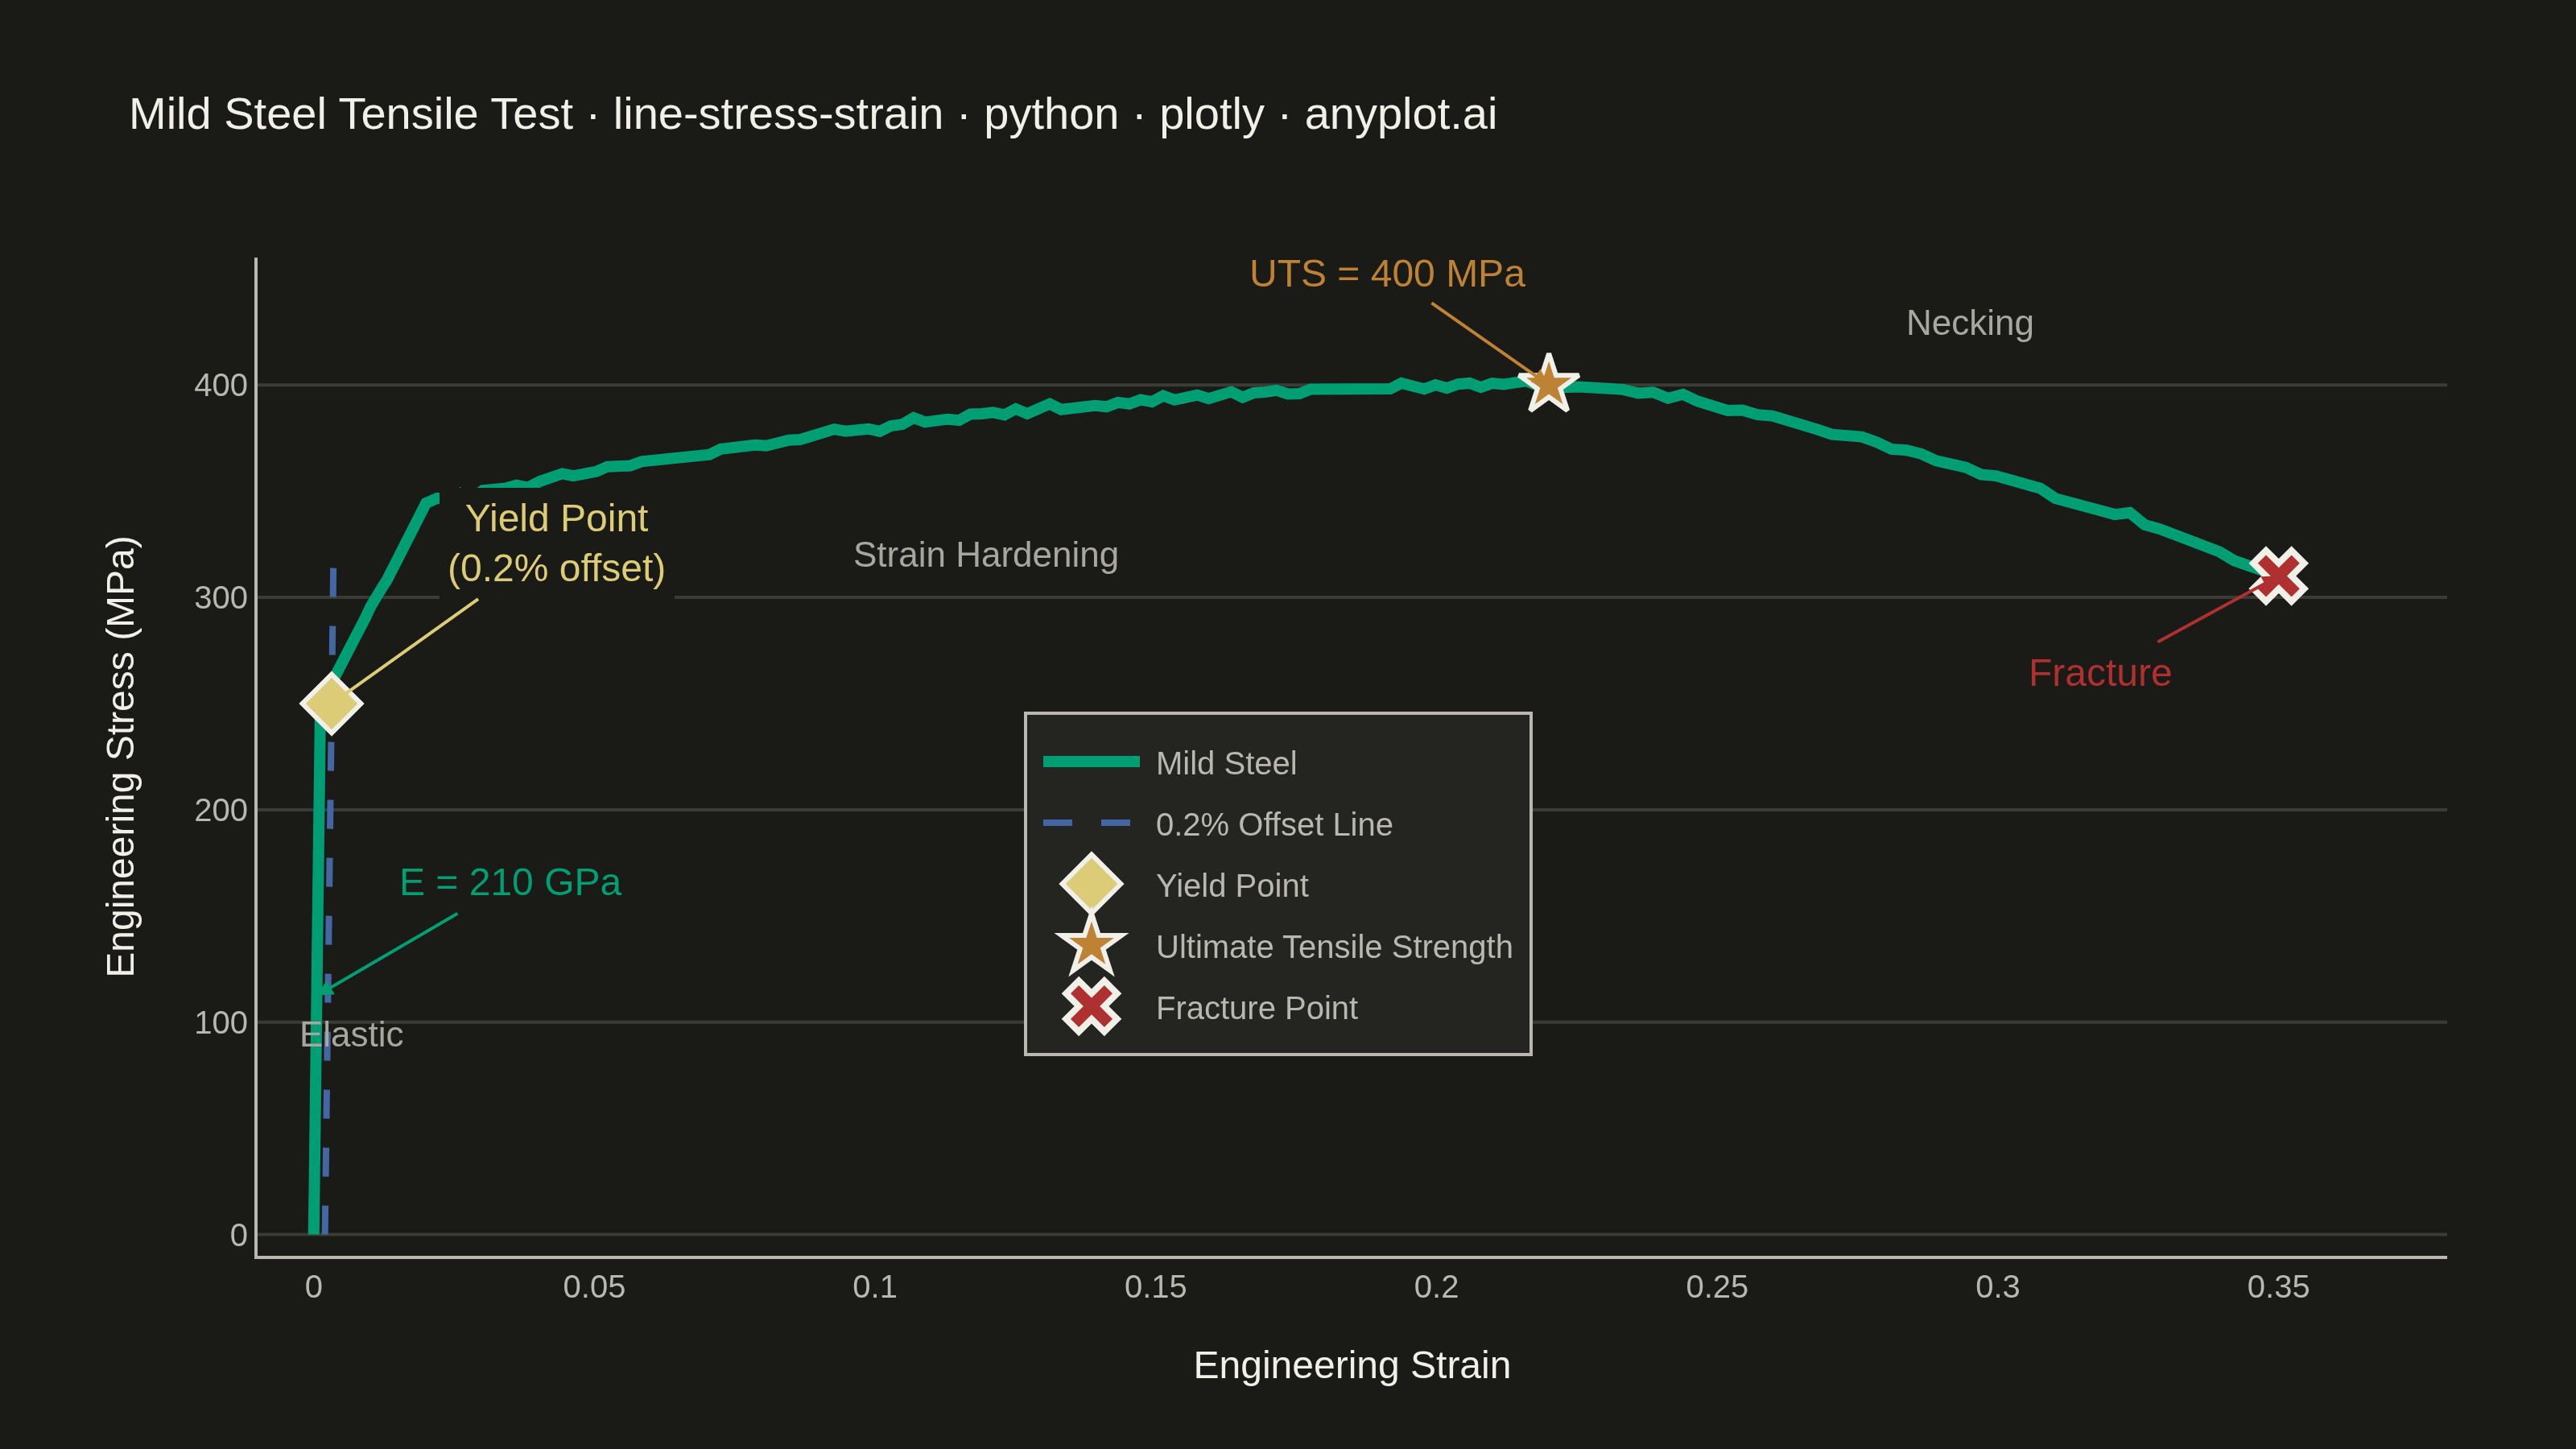
An engineering stress-strain curve visualizes the relationship between applied stress (MPa) and resulting strain (dimensionless) in a material under uniaxial tensile loading. The curve reveals distinct mechanical behavior regions — elastic deformation, yielding, strain hardening, and necking — culminating in fracture. It is the foundational plot for characterizing material mechanical properties and comparing material performance.
""" anyplot.ai
line-stress-strain: Engineering Stress-Strain Curve
Library: plotly 6.8.0 | Python 3.13.14
Quality: 89/100 | Updated: 2026-06-21
"""

import os

import numpy as np
import plotly.graph_objects as go


# Theme tokens — Imprint palette, theme-adaptive chrome
THEME = os.getenv("ANYPLOT_THEME", "light")
PAGE_BG = "#FAF8F1" if THEME == "light" else "#1A1A17"
ELEVATED_BG = "#FFFDF6" if THEME == "light" else "#242420"
INK = "#1A1A17" if THEME == "light" else "#F0EFE8"
INK_SOFT = "#4A4A44" if THEME == "light" else "#B8B7B0"
INK_MUTED = "#6B6A63" if THEME == "light" else "#A8A79F"
GRID = "rgba(26,26,23,0.15)" if THEME == "light" else "rgba(240,239,232,0.15)"

# Imprint palette — selected positions for semantic roles
BRAND = "#009E73"  # Imprint position 1 — main curve (Mild Steel)
BLUE = "#4467A3"  # Imprint position 3 — 0.2% offset reference line
OCHRE = "#BD8233"  # Imprint position 4 — UTS marker
RED = "#AE3030"  # Imprint position 5 — fracture (semantic: failure)
AMBER = "#DDCC77"  # semantic anchor — yield point (warning threshold)

# Data — Mild steel tensile test simulation
np.random.seed(42)

youngs_modulus = 210000  # MPa
yield_stress = 250  # MPa
uts = 400  # MPa
fracture_strain = 0.35
uts_strain = 0.22
yield_strain = yield_stress / youngs_modulus

# Elastic region (steep linear rise)
strain_elastic = np.linspace(0, yield_strain, 50)
stress_elastic = youngs_modulus * strain_elastic

# Yield plateau and early plastic deformation
strain_plateau = np.linspace(yield_strain, 0.02, 20)
stress_plateau = yield_stress + 5000 * (strain_plateau - yield_strain)

# Strain hardening (concave down curve toward UTS)
strain_hardening = np.linspace(0.02, uts_strain, 100)
t = (strain_hardening - 0.02) / (uts_strain - 0.02)
stress_hardening = stress_plateau[-1] + (uts - stress_plateau[-1]) * (1 - (1 - t) ** 2)

# Necking (stress drops from UTS to fracture)
strain_necking = np.linspace(uts_strain, fracture_strain, 50)
t_neck = (strain_necking - uts_strain) / (fracture_strain - uts_strain)
fracture_stress = 310
stress_necking = uts - (uts - fracture_stress) * t_neck**1.5

# Combine all regions
strain = np.concatenate([strain_elastic, strain_plateau, strain_hardening, strain_necking])
stress = np.concatenate([stress_elastic, stress_plateau, stress_hardening, stress_necking])

# Add slight noise for realism (skip elastic region for clean slope)
noise = np.random.normal(0, 1.0, len(strain))
noise[:50] = 0
stress = stress + noise
stress = np.maximum(stress, 0)

# 0.2% offset line for yield determination
offset_line_strain = np.linspace(0.002, 0.002 + yield_strain * 1.3, 50)
offset_line_stress = youngs_modulus * (offset_line_strain - 0.002)

# Key point coordinates
offset_yield_strain = yield_stress / youngs_modulus + 0.002
offset_yield_stress = yield_stress
uts_plot_strain = uts_strain
uts_plot_stress = uts
fracture_plot_strain = strain[-1]
fracture_plot_stress = stress[-1]

# Plot
fig = go.Figure()

# Main stress-strain curve — Imprint position 1 (brand green)
fig.add_trace(
    go.Scatter(
        x=strain,
        y=stress,
        mode="lines",
        line={"color": BRAND, "width": 3.5},
        name="Mild Steel",
        hovertemplate="Strain: %{x:.4f}<br>Stress: %{y:.1f} MPa<extra></extra>",
    )
)

# 0.2% offset line — Imprint position 3 (blue reference line)
fig.add_trace(
    go.Scatter(
        x=offset_line_strain,
        y=offset_line_stress,
        mode="lines",
        line={"color": BLUE, "width": 2, "dash": "dash"},
        name="0.2% Offset Line",
        hoverinfo="skip",
    )
)

# Yield point marker — amber (semantic: warning threshold)
fig.add_trace(
    go.Scatter(
        x=[offset_yield_strain],
        y=[offset_yield_stress],
        mode="markers",
        marker={"size": 14, "color": AMBER, "symbol": "diamond", "line": {"color": INK, "width": 1.5}},
        name="Yield Point",
        hovertemplate="Yield Point<br>Strain: %{x:.4f}<br>Stress: %{y:.1f} MPa<extra></extra>",
    )
)

# UTS marker — Imprint position 4 (ochre)
fig.add_trace(
    go.Scatter(
        x=[uts_plot_strain],
        y=[uts_plot_stress],
        mode="markers",
        marker={"size": 14, "color": OCHRE, "symbol": "star", "line": {"color": INK, "width": 1.5}},
        name="Ultimate Tensile Strength",
        hovertemplate="UTS<br>Strain: %{x:.4f}<br>Stress: %{y:.1f} MPa<extra></extra>",
    )
)

# Fracture point marker — Imprint position 5 / semantic red (failure)
fig.add_trace(
    go.Scatter(
        x=[fracture_plot_strain],
        y=[fracture_plot_stress],
        mode="markers",
        marker={"size": 14, "color": RED, "symbol": "x", "line": {"color": INK, "width": 2}},
        name="Fracture Point",
        hovertemplate="Fracture<br>Strain: %{x:.4f}<br>Stress: %{y:.1f} MPa<extra></extra>",
    )
)

# Young's modulus annotation — offset up-right to avoid crowding near origin
fig.add_annotation(
    x=yield_strain * 0.45,
    y=youngs_modulus * yield_strain * 0.45,
    text=f"E = {youngs_modulus // 1000} GPa",
    showarrow=True,
    arrowhead=2,
    arrowcolor=BRAND,
    ax=60,
    ay=-35,
    font={"size": 12, "color": BRAND},
    bgcolor=PAGE_BG,
    borderpad=2,
)

# Yield point annotation — offset up-right to avoid overlap with E annotation
fig.add_annotation(
    x=offset_yield_strain,
    y=offset_yield_stress,
    text="Yield Point<br>(0.2% offset)",
    showarrow=True,
    arrowhead=2,
    arrowcolor=AMBER,
    ax=70,
    ay=-50,
    font={"size": 12, "color": AMBER},
    bgcolor=PAGE_BG,
    borderpad=2,
)

# UTS annotation
fig.add_annotation(
    x=uts_plot_strain,
    y=uts_plot_stress,
    text=f"UTS = {uts} MPa",
    showarrow=True,
    arrowhead=2,
    arrowcolor=OCHRE,
    ax=-50,
    ay=-35,
    font={"size": 12, "color": OCHRE},
    bgcolor=PAGE_BG,
    borderpad=2,
)

# Fracture annotation
fig.add_annotation(
    x=fracture_plot_strain,
    y=fracture_plot_stress,
    text="Fracture",
    showarrow=True,
    arrowhead=2,
    arrowcolor=RED,
    ax=-55,
    ay=30,
    font={"size": 12, "color": RED},
    bgcolor=PAGE_BG,
    borderpad=2,
)

# Region labels — tertiary ink for structural readability
fig.add_annotation(x=0.007, y=95, text="Elastic", showarrow=False, font={"size": 11, "color": INK_MUTED})
fig.add_annotation(x=0.12, y=320, text="Strain Hardening", showarrow=False, font={"size": 11, "color": INK_MUTED})
fig.add_annotation(x=0.295, y=430, text="Necking", showarrow=False, font={"size": 11, "color": INK_MUTED})

# Title — mandatory format with length-aware font scaling
title = "Mild Steel Tensile Test · line-stress-strain · python · plotly · anyplot.ai"
title_fontsize = round(16 * 67 / max(67, len(title)))

fig.update_layout(
    autosize=False,
    paper_bgcolor=PAGE_BG,
    plot_bgcolor=PAGE_BG,
    font={"color": INK},
    title={"text": title, "font": {"size": title_fontsize, "color": INK}},
    xaxis={
        "title": {"text": "Engineering Strain", "font": {"size": 12, "color": INK}},
        "tickfont": {"size": 10, "color": INK_SOFT},
        "showgrid": False,
        "zeroline": False,
        "showline": True,
        "mirror": False,
        "linecolor": INK_SOFT,
        "range": [-0.01, 0.38],
    },
    yaxis={
        "title": {"text": "Engineering Stress (MPa)", "font": {"size": 12, "color": INK}},
        "tickfont": {"size": 10, "color": INK_SOFT},
        "showgrid": True,
        "gridcolor": GRID,
        "gridwidth": 1,
        "zeroline": False,
        "showline": True,
        "mirror": False,
        "linecolor": INK_SOFT,
        "range": [-10, 460],
    },
    legend={
        "font": {"size": 10, "color": INK_SOFT},
        "x": 0.98,
        "y": 0.05,
        "xanchor": "right",
        "yanchor": "bottom",
        "bgcolor": ELEVATED_BG,
        "bordercolor": INK_SOFT,
        "borderwidth": 1,
    },
    updatemenus=[
        {
            "type": "buttons",
            "direction": "right",
            "x": 0.0,
            "y": 1.10,
            "xanchor": "left",
            "yanchor": "top",
            "showactive": True,
            "bgcolor": ELEVATED_BG,
            "bordercolor": INK_SOFT,
            "borderwidth": 1,
            "font": {"color": INK_SOFT, "size": 10},
            "buttons": [
                {
                    "label": "Full Curve",
                    "method": "relayout",
                    "args": [{"xaxis.range": [-0.01, 0.38], "yaxis.range": [-10, 460]}],
                },
                {
                    "label": "Elastic Detail",
                    "method": "relayout",
                    "args": [{"xaxis.range": [-0.0001, 0.0015], "yaxis.range": [-10, 300]}],
                },
            ],
        }
    ],
    margin={"l": 80, "r": 40, "t": 100, "b": 60},
    width=800,
    height=450,
)

# Save — 3200×1800 px landscape (width=800 × scale=4, height=450 × scale=4)
fig.write_image(f"plot-{THEME}.png", width=800, height=450, scale=4)
fig.write_html(f"plot-{THEME}.html", include_plotlyjs="cdn")
Runnable source as JSON, for any HTTP client: https://api.anyplot.ai/specs/line-stress-strain/plotly/code. Any spec id and library id listed in llms-full.txt fit the same URL shape; every URL below is complete and callable.
{
  "spec_id": "line-stress-strain",
  "language": "python",
  "library": "plotly",
  "page": "https://anyplot.ai/line-stress-strain/python/plotly",
  "hub": "https://anyplot.ai/line-stress-strain",
  "code_json": "https://api.anyplot.ai/specs/line-stress-strain/plotly/code",
  "spec_json": "https://api.anyplot.ai/specs/line-stress-strain",
  "render_light_png": "https://storage.googleapis.com/anyplot-images/plots/line-stress-strain/python/plotly/plot-light.png",
  "render_dark_png": "https://storage.googleapis.com/anyplot-images/plots/line-stress-strain/python/plotly/plot-dark.png",
  "interactive_light_html": "https://storage.googleapis.com/anyplot-images/plots/line-stress-strain/python/plotly/plot-light.html",
  "interactive_dark_html": "https://storage.googleapis.com/anyplot-images/plots/line-stress-strain/python/plotly/plot-dark.html",
  "quality_score": 89.0,
  "license": "MIT",
  "guide": "https://anyplot.ai/llms.txt"
}
Part of Engineering Stress-Strain Curve on anyplot.ai.