The same plot in 14 other libraries — JavaScript: Chart.js, Apache ECharts, Highcharts, MUI X Charts; Python: Altair, Bokeh, lets-plot, Matplotlib, Plotly, plotnine, Pygal, Seaborn; R: ggplot2; Julia: Makie.jl. Compare all 15 side by side: Engineering Stress-Strain Curve in Python, R, Julia and JavaScript.
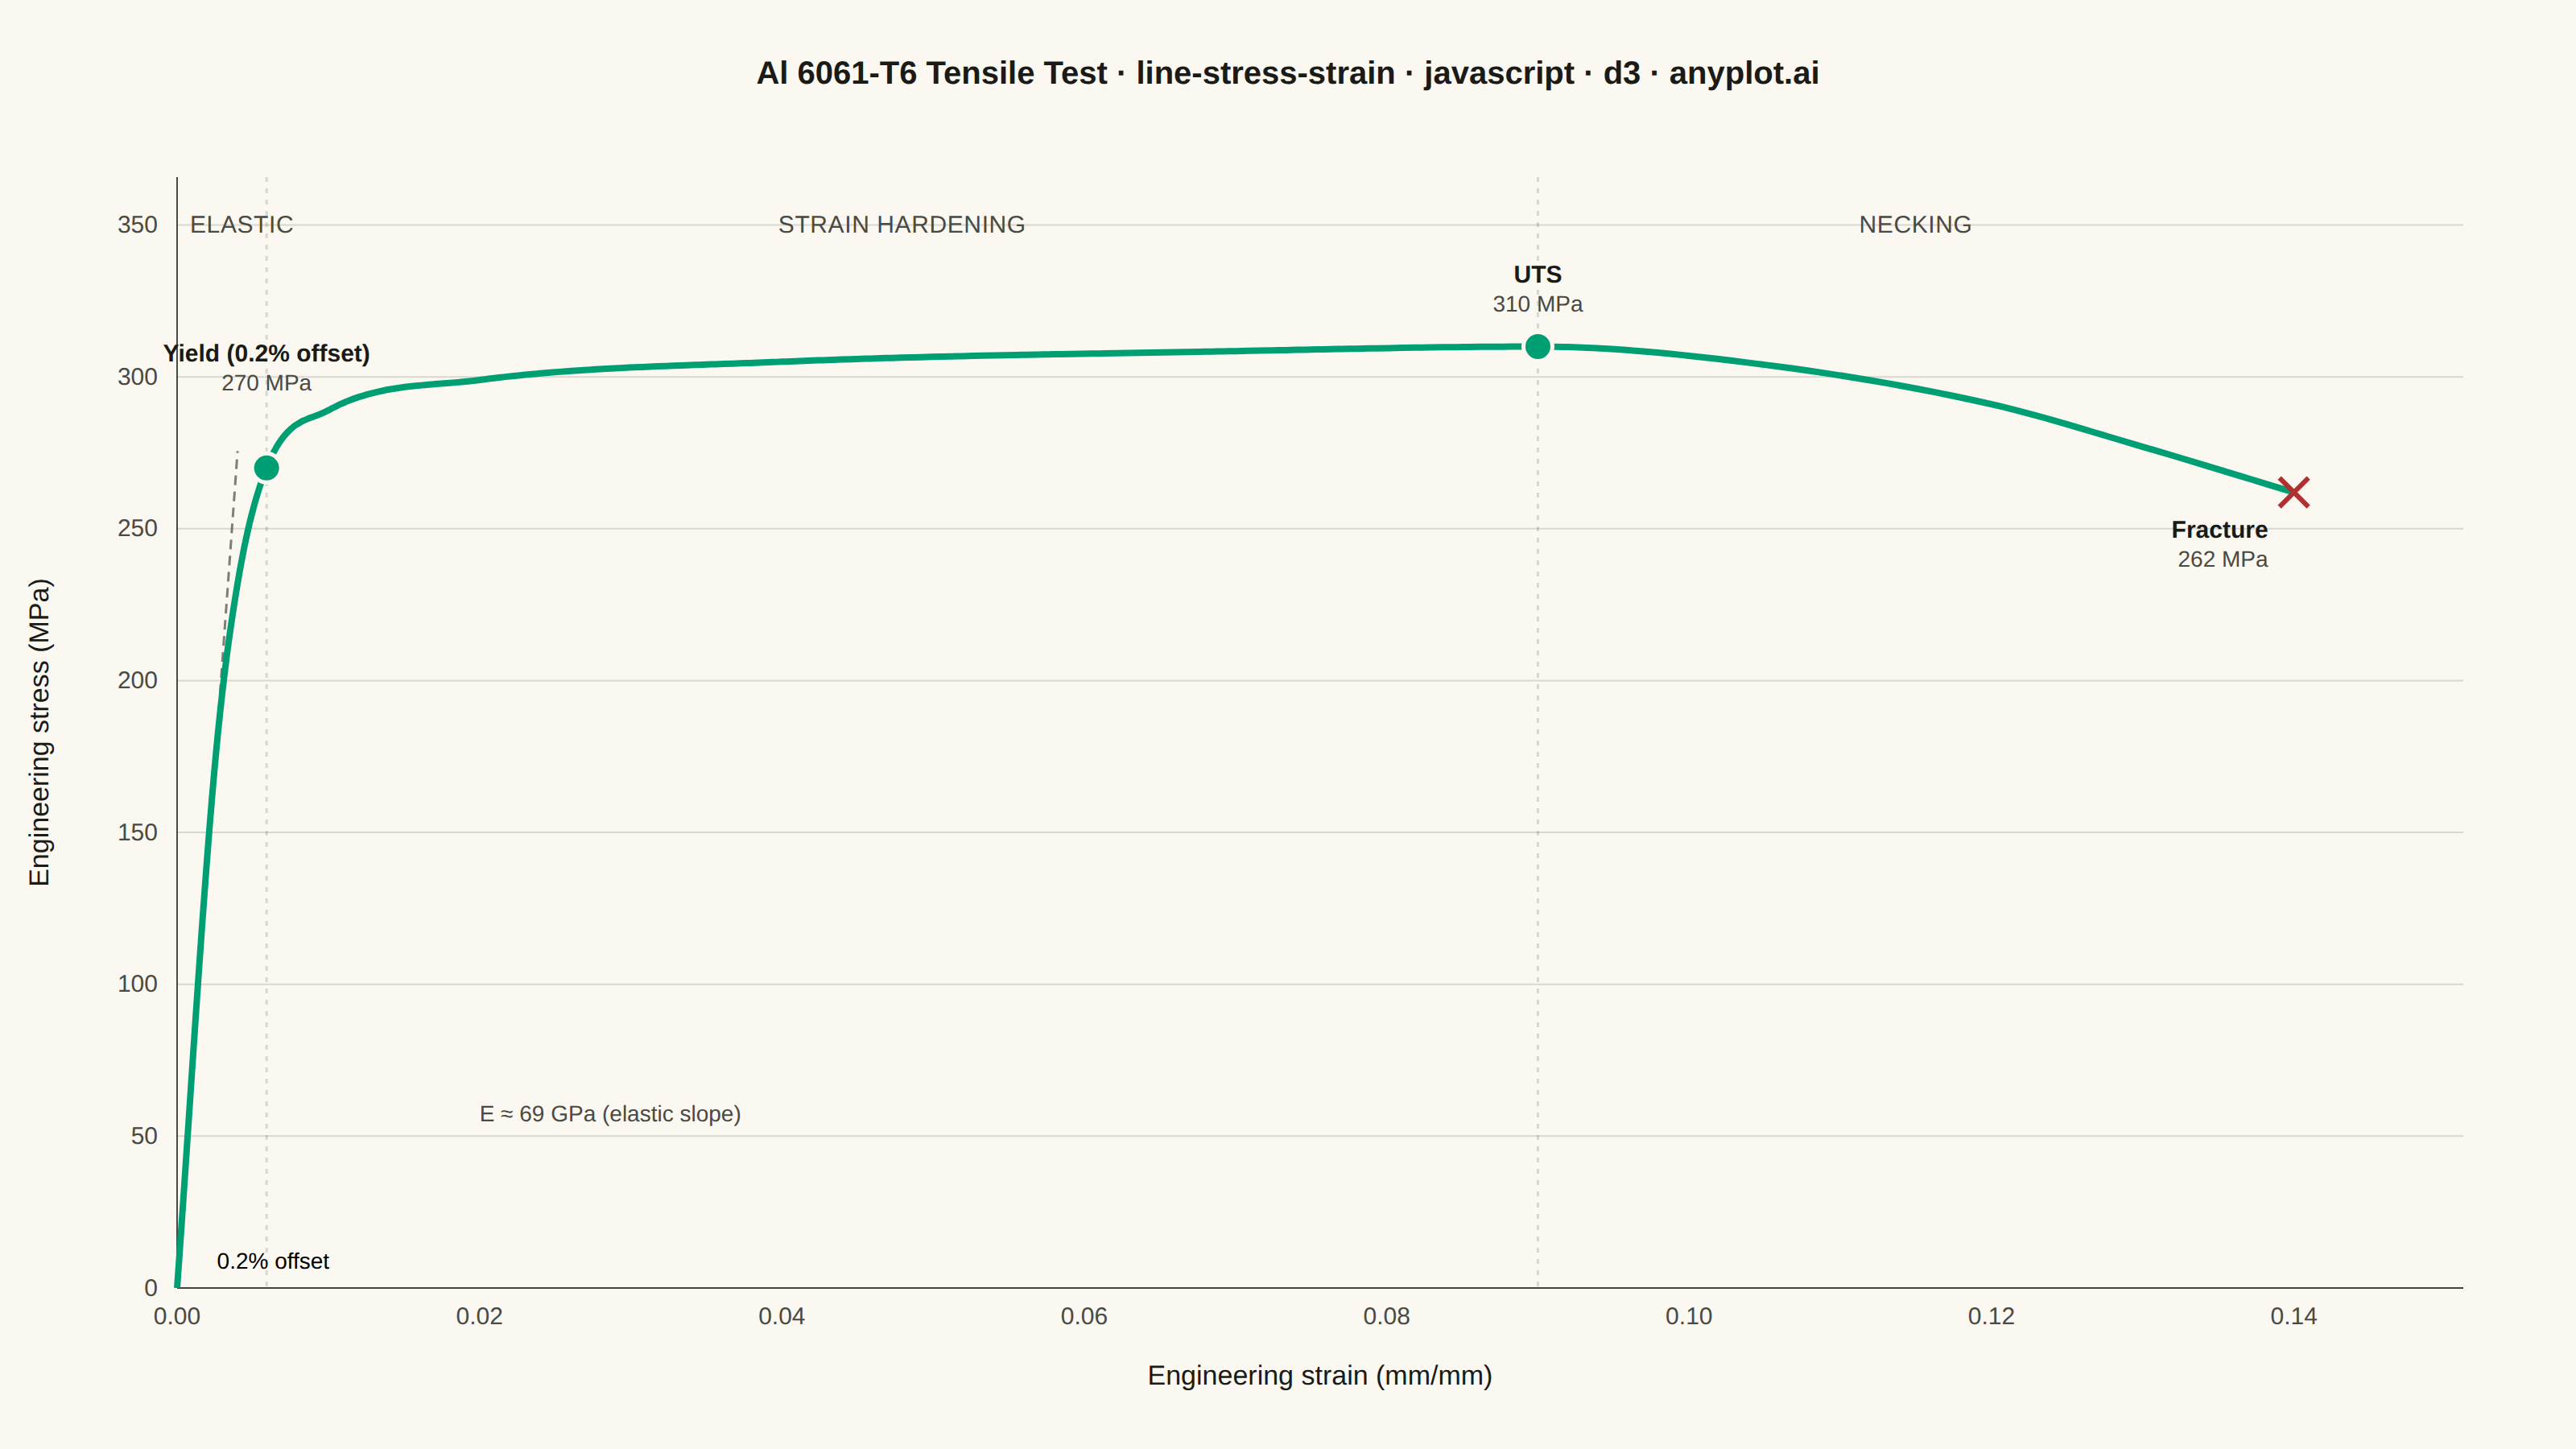
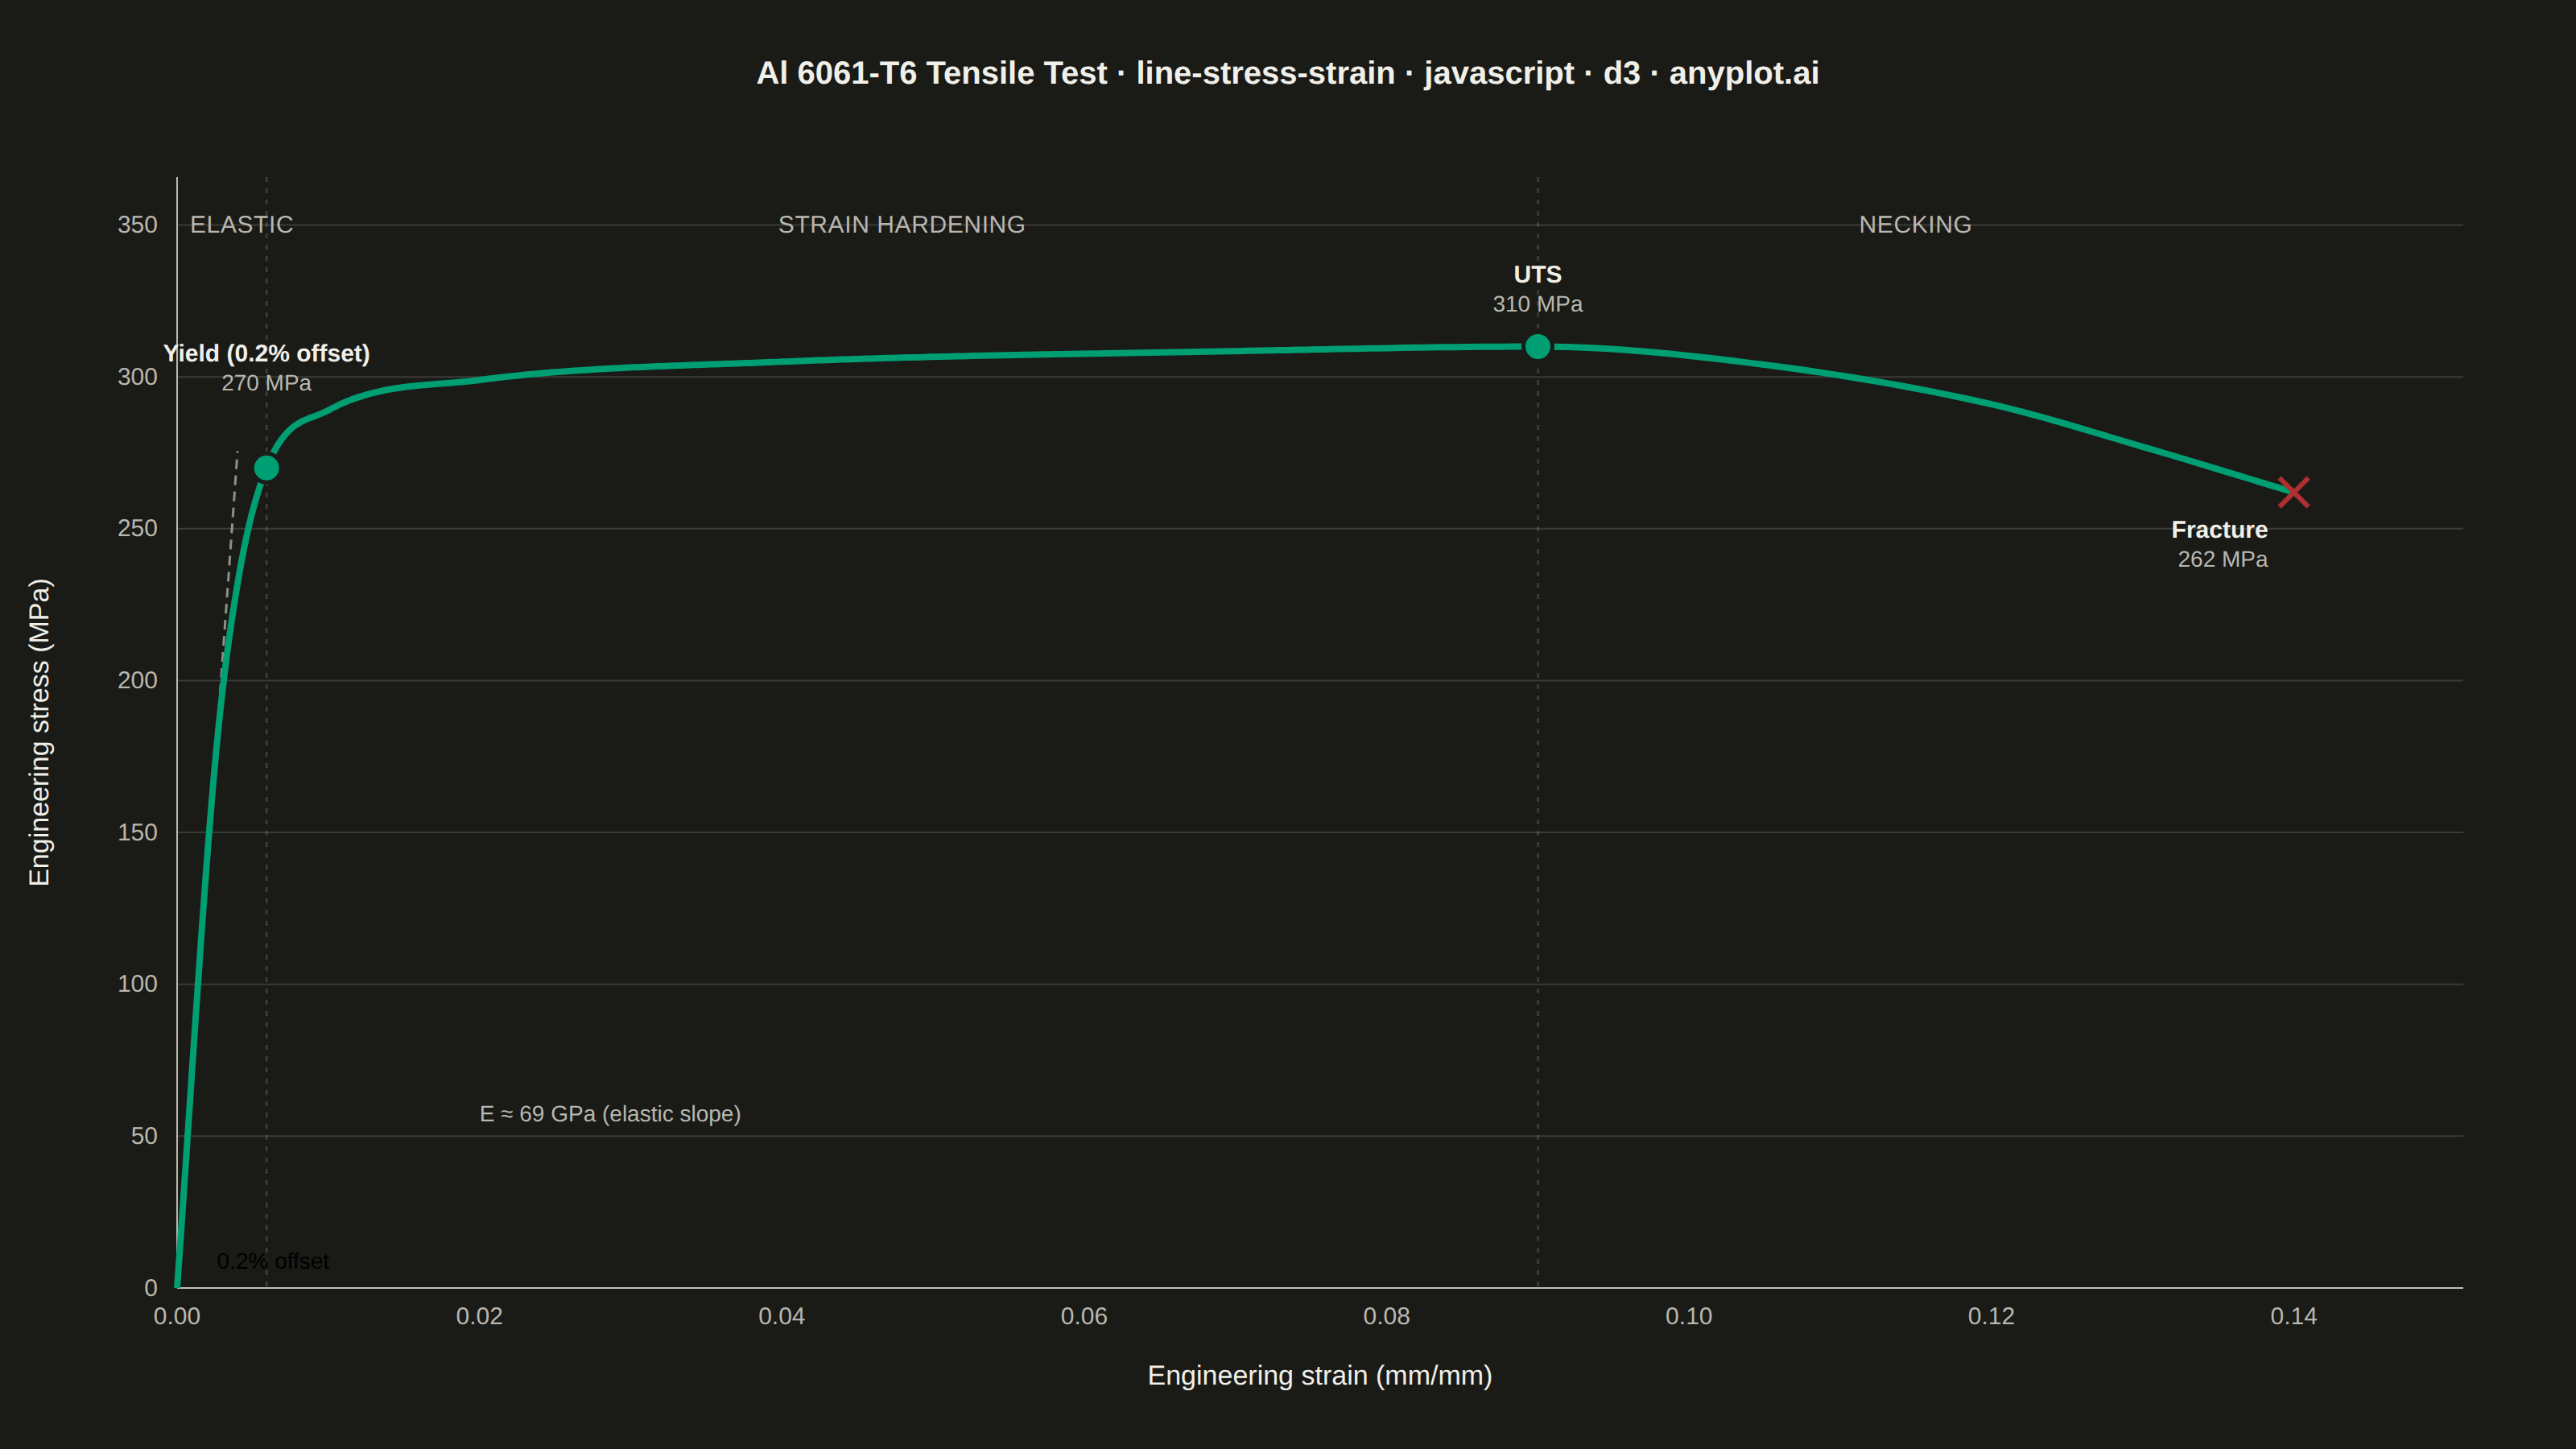
An engineering stress-strain curve visualizes the relationship between applied stress (MPa) and resulting strain (dimensionless) in a material under uniaxial tensile loading. The curve reveals distinct mechanical behavior regions — elastic deformation, yielding, strain hardening, and necking — culminating in fracture. It is the foundational plot for characterizing material mechanical properties and comparing material performance.
// anyplot.ai
// line-stress-strain: Engineering Stress-Strain Curve
// Library: d3 7.9.0 | JavaScript 22.23.2
// Quality: 85/100 | Created: 2026-08-24

const t = window.ANYPLOT_TOKENS;
const { width, height } = window.ANYPLOT_SIZE;
const margin = { top: 110, right: 70, bottom: 100, left: 110 };
const iw = width - margin.left - margin.right;
const ih = height - margin.top - margin.bottom;

// --- Material model (Al 6061-T6 tensile coupon, idealized) -----------------
// Control points trace the classic shape: linear-elastic rise, a knee into
// gradual strain hardening up to UTS, then softening (necking) to fracture.
const YOUNGS_MODULUS = 68900; // MPa
const CONTROL_STRAINS = [0, 0.0025, 0.004, 0.006, 0.01, 0.02, 0.04, 0.07, 0.09, 0.105, 0.12, 0.13, 0.14];
const CONTROL_STRESSES = [0, 172.25, 232, 271, 289, 299, 305, 308.5, 310, 304, 291, 277, 262];
const PROP_LIMIT_STRAIN = CONTROL_STRAINS[1];
const UTS_STRAIN = 0.09;
const UTS_STRESS = 310;
const FRACTURE_STRAIN = CONTROL_STRAINS[CONTROL_STRAINS.length - 1];
const FRACTURE_STRESS = CONTROL_STRESSES[CONTROL_STRESSES.length - 1];
const OFFSET_STRAIN = 0.002;

// Cubic Hermite basis on frac in [0, 1].
const hermite = (frac, p0, p1, m0, m1) => {
  const f2 = frac * frac;
  const f3 = f2 * frac;
  const h00 = 2 * f3 - 3 * f2 + 1;
  const h10 = f3 - 2 * f2 + frac;
  const h01 = -2 * f3 + 3 * f2;
  const h11 = f3 - f2;
  return h00 * p0 + h10 * m0 + h01 * p1 + h11 * m1;
};

// Fritsch-Carlson monotone tangents: interpolates through every control
// point smoothly without overshooting past neighboring values, including at
// the UTS peak where the secant sign flips (tangent naturally goes to 0).
const monotoneTangents = (xs, ys) => {
  const n = xs.length;
  const secants = [];
  for (let i = 0; i < n - 1; i++) secants.push((ys[i + 1] - ys[i]) / (xs[i + 1] - xs[i]));
  const m = new Array(n);
  m[0] = secants[0];
  m[n - 1] = secants[n - 2];
  for (let i = 1; i < n - 1; i++) {
    m[i] = secants[i - 1] * secants[i] <= 0 ? 0 : (secants[i - 1] + secants[i]) / 2;
  }
  for (let i = 0; i < n - 1; i++) {
    if (secants[i] === 0) {
      m[i] = 0;
      m[i + 1] = 0;
      continue;
    }
    const a = m[i] / secants[i];
    const b = m[i + 1] / secants[i];
    const s = a * a + b * b;
    if (s > 9) {
      const tau = 3 / Math.sqrt(s);
      m[i] = tau * a * secants[i];
      m[i + 1] = tau * b * secants[i];
    }
  }
  return m;
};

const controlTangents = monotoneTangents(CONTROL_STRAINS, CONTROL_STRESSES);

const stressAt = (strain) => {
  let i = 0;
  while (i < CONTROL_STRAINS.length - 2 && strain > CONTROL_STRAINS[i + 1]) i++;
  const span = CONTROL_STRAINS[i + 1] - CONTROL_STRAINS[i];
  const frac = (strain - CONTROL_STRAINS[i]) / span;
  return hermite(frac, CONTROL_STRESSES[i], CONTROL_STRESSES[i + 1], controlTangents[i] * span, controlTangents[i + 1] * span);
};

// --- Sample the curve (denser through the elastic/knee region) -------------
const SAMPLE_COUNT = 260;
const data = [];
for (let i = 0; i < SAMPLE_COUNT; i++) {
  const frac = i / (SAMPLE_COUNT - 1);
  const strain = FRACTURE_STRAIN * Math.pow(frac, 2.2);
  data.push({ strain, stress: stressAt(strain) });
}

// --- 0.2% offset method: locate the yield point by bisection ---------------
const offsetStressAt = (strain) => YOUNGS_MODULUS * (strain - OFFSET_STRAIN);
let lo = PROP_LIMIT_STRAIN;
let hi = UTS_STRAIN;
for (let i = 0; i < 60; i++) {
  const mid = (lo + hi) / 2;
  if (stressAt(mid) - offsetStressAt(mid) > 0) lo = mid;
  else hi = mid;
}
const yieldPoint = { strain: (lo + hi) / 2, stress: stressAt((lo + hi) / 2) };
const utsPoint = { strain: UTS_STRAIN, stress: UTS_STRESS };
const fracturePoint = { strain: FRACTURE_STRAIN, stress: FRACTURE_STRESS };

// --- Scales -------------------------------------------------------------
const x = d3.scaleLinear().domain([0, FRACTURE_STRAIN * 1.08]).range([0, iw]);
const y = d3.scaleLinear().domain([0, UTS_STRESS * 1.18]).range([ih, 0]);

// --- SVG mount ------------------------------------------------------------
const svg = d3.select("#container").append("svg").attr("width", width).attr("height", height);
const g = svg.append("g").attr("transform", `translate(${margin.left},${margin.top})`);

// --- Axes -------------------------------------------------------------------
const xAxis = g
  .append("g")
  .attr("transform", `translate(0,${ih})`)
  .call(d3.axisBottom(x).ticks(7).tickFormat(d3.format(".2f")).tickSize(0).tickPadding(12));
const yAxis = g
  .append("g")
  .call(d3.axisLeft(y).ticks(6).tickFormat(d3.format("d")).tickSize(0).tickPadding(12));
for (const axis of [xAxis, yAxis]) {
  axis.selectAll("text").attr("fill", t.inkSoft).style("font-size", "15px");
  axis.select(".domain").attr("stroke", t.inkSoft);
}

// y-axis gridlines, subtle
g.append("g")
  .selectAll("line")
  .data(y.ticks(6))
  .join("line")
  .attr("x1", 0)
  .attr("x2", iw)
  .attr("y1", (d) => y(d))
  .attr("y2", (d) => y(d))
  .attr("stroke", t.grid)
  .attr("stroke-width", 1);

// --- Region boundaries (elastic / strain hardening / necking) --------------
const regionDividers = [yieldPoint.strain, UTS_STRAIN];
g.selectAll(".region-divider")
  .data(regionDividers)
  .join("line")
  .attr("x1", (d) => x(d))
  .attr("x2", (d) => x(d))
  .attr("y1", 0)
  .attr("y2", ih)
  .attr("stroke", t.grid)
  .attr("stroke-width", 1.5)
  .attr("stroke-dasharray", "3,4");

const regionLabelY = ih * 0.05;
g.append("text")
  .attr("x", 8)
  .attr("y", regionLabelY)
  .attr("text-anchor", "start")
  .attr("fill", t.inkSoft)
  .style("font-size", "15px")
  .style("letter-spacing", "0.02em")
  .text("ELASTIC");
g.append("text")
  .attr("x", x((yieldPoint.strain + UTS_STRAIN) / 2))
  .attr("y", regionLabelY)
  .attr("text-anchor", "middle")
  .attr("fill", t.inkSoft)
  .style("font-size", "15px")
  .style("letter-spacing", "0.02em")
  .text("STRAIN HARDENING");
g.append("text")
  .attr("x", x((UTS_STRAIN + FRACTURE_STRAIN) / 2))
  .attr("y", regionLabelY)
  .attr("text-anchor", "middle")
  .attr("fill", t.inkSoft)
  .style("font-size", "15px")
  .style("letter-spacing", "0.02em")
  .text("NECKING");

// --- Elastic modulus reference line (tangent at slope E) -------------------
// Extended well past the proportional limit so the straight tangent visibly
// separates from the actual (bending) curve instead of merging with it. The
// label sits in the open plateau area rather than beside the tangent, which
// stays narrow even when lengthened since E dwarfs the yield stress.
const modulusEnd = PROP_LIMIT_STRAIN * 1.6;
g.append("line")
  .attr("x1", x(0))
  .attr("y1", y(0))
  .attr("x2", x(modulusEnd))
  .attr("y2", y(YOUNGS_MODULUS * modulusEnd))
  .attr("stroke", t.ink)
  .attr("stroke-width", 1.5)
  .attr("stroke-dasharray", "6,4")
  .attr("opacity", 0.55);
g.append("text")
  .attr("x", x(0.02))
  .attr("y", y(55))
  .attr("text-anchor", "start")
  .attr("fill", t.inkSoft)
  .style("font-size", "14px")
  .text(`E ≈ ${(YOUNGS_MODULUS / 1000).toFixed(0)} GPa (elastic slope)`);

// --- 0.2% offset construction line ------------------------------------------
g.append("line")
  .attr("x1", x(OFFSET_STRAIN))
  .attr("y1", y(0))
  .attr("x2", x(yieldPoint.strain))
  .attr("y2", y(yieldPoint.stress))
  .attr("stroke", t.muted)
  .attr("stroke-width", 1.5)
  .attr("stroke-dasharray", "6,4");
g.append("text")
  .attr("x", x(OFFSET_STRAIN) + 6)
  .attr("y", y(0) - 12)
  .attr("text-anchor", "start")
  .attr("fill", t.muted)
  .style("font-size", "14px")
  .text("0.2% offset");

// --- Stress-strain curve ------------------------------------------------
const line = d3
  .line()
  .x((d) => x(d.strain))
  .y((d) => y(d.stress))
  .curve(d3.curveMonotoneX);

g.append("path").datum(data).attr("d", line).attr("fill", "none").attr("stroke", t.palette[0]).attr("stroke-width", 4);

// --- Critical points ------------------------------------------------------
const markerStyle = (selection) => selection.attr("r", 9).attr("stroke", t.pageBg).attr("stroke-width", 2.5);

g.append("circle")
  .attr("cx", x(yieldPoint.strain))
  .attr("cy", y(yieldPoint.stress))
  .attr("fill", t.palette[0])
  .call(markerStyle);
g.append("text")
  .attr("x", x(yieldPoint.strain))
  .attr("y", y(yieldPoint.stress) - 66)
  .attr("text-anchor", "middle")
  .attr("fill", t.ink)
  .style("font-size", "15px")
  .style("font-weight", "600")
  .text("Yield (0.2% offset)");
g.append("text")
  .attr("x", x(yieldPoint.strain))
  .attr("y", y(yieldPoint.stress) - 48)
  .attr("text-anchor", "middle")
  .attr("fill", t.inkSoft)
  .style("font-size", "14px")
  .text(`${Math.round(yieldPoint.stress)} MPa`);

g.append("circle").attr("cx", x(utsPoint.strain)).attr("cy", y(utsPoint.stress)).attr("fill", t.palette[0]).call(markerStyle);
g.append("text")
  .attr("x", x(utsPoint.strain))
  .attr("y", y(utsPoint.stress) - 40)
  .attr("text-anchor", "middle")
  .attr("fill", t.ink)
  .style("font-size", "15px")
  .style("font-weight", "600")
  .text("UTS");
g.append("text")
  .attr("x", x(utsPoint.strain))
  .attr("y", y(utsPoint.stress) - 22)
  .attr("text-anchor", "middle")
  .attr("fill", t.inkSoft)
  .style("font-size", "14px")
  .text(`${Math.round(utsPoint.stress)} MPa`);

const fractureColor = t.palette[4]; // matte red — semantic anchor for failure
const fx = x(fracturePoint.strain);
const fy = y(fracturePoint.stress);
const crossSize = 9;
g.append("line").attr("x1", fx - crossSize).attr("y1", fy - crossSize).attr("x2", fx + crossSize).attr("y2", fy + crossSize).attr("stroke", fractureColor).attr("stroke-width", 3);
g.append("line").attr("x1", fx - crossSize).attr("y1", fy + crossSize).attr("x2", fx + crossSize).attr("y2", fy - crossSize).attr("stroke", fractureColor).attr("stroke-width", 3);
g.append("text")
  .attr("x", fx - 16)
  .attr("y", fy + 28)
  .attr("text-anchor", "end")
  .attr("fill", t.ink)
  .style("font-size", "15px")
  .style("font-weight", "600")
  .text("Fracture");
g.append("text")
  .attr("x", fx - 16)
  .attr("y", fy + 46)
  .attr("text-anchor", "end")
  .attr("fill", t.inkSoft)
  .style("font-size", "14px")
  .text(`${Math.round(fracturePoint.stress)} MPa`);

// --- Axis labels --------------------------------------------------------
g.append("text")
  .attr("x", iw / 2)
  .attr("y", ih + 60)
  .attr("text-anchor", "middle")
  .attr("fill", t.ink)
  .style("font-size", "17px")
  .text("Engineering strain (mm/mm)");
g.append("text")
  .attr("transform", "rotate(-90)")
  .attr("x", -ih / 2)
  .attr("y", -80)
  .attr("text-anchor", "middle")
  .attr("fill", t.ink)
  .style("font-size", "17px")
  .text("Engineering stress (MPa)");

// --- Title ------------------------------------------------------------------
const title = "Al 6061-T6 Tensile Test · line-stress-strain · javascript · d3 · anyplot.ai";
const titleFontSize = Math.max(14, Math.round(22 * Math.min(1, 67 / title.length)));
svg
  .append("text")
  .attr("x", width / 2)
  .attr("y", 52)
  .attr("text-anchor", "middle")
  .attr("fill", t.ink)
  .style("font-size", `${titleFontSize}px`)
  .style("font-weight", "600")
  .text(title);
Runnable source as JSON, for any HTTP client: https://api.anyplot.ai/specs/line-stress-strain/d3/code. Any spec id and library id listed in llms-full.txt fit the same URL shape; every URL below is complete and callable.
{
  "spec_id": "line-stress-strain",
  "language": "javascript",
  "library": "d3",
  "page": "https://anyplot.ai/line-stress-strain/javascript/d3",
  "hub": "https://anyplot.ai/line-stress-strain",
  "code_json": "https://api.anyplot.ai/specs/line-stress-strain/d3/code",
  "spec_json": "https://api.anyplot.ai/specs/line-stress-strain",
  "render_light_png": "https://storage.googleapis.com/anyplot-images/plots/line-stress-strain/javascript/d3/plot-light.png",
  "render_dark_png": "https://storage.googleapis.com/anyplot-images/plots/line-stress-strain/javascript/d3/plot-dark.png",
  "interactive_light_html": "https://storage.googleapis.com/anyplot-images/plots/line-stress-strain/javascript/d3/plot-light.html",
  "interactive_dark_html": "https://storage.googleapis.com/anyplot-images/plots/line-stress-strain/javascript/d3/plot-dark.html",
  "quality_score": 85.0,
  "license": "MIT",
  "guide": "https://anyplot.ai/llms.txt"
}
Part of Engineering Stress-Strain Curve on anyplot.ai.