The same plot in 14 other libraries — Python: Altair, Bokeh, lets-plot, Matplotlib, Plotly, plotnine, Pygal, Seaborn; Julia: Makie.jl; JavaScript: Chart.js, D3.js, Apache ECharts, Highcharts, MUI X Charts. Compare all 15 side by side: Engineering Stress-Strain Curve in Python, R, Julia and JavaScript.
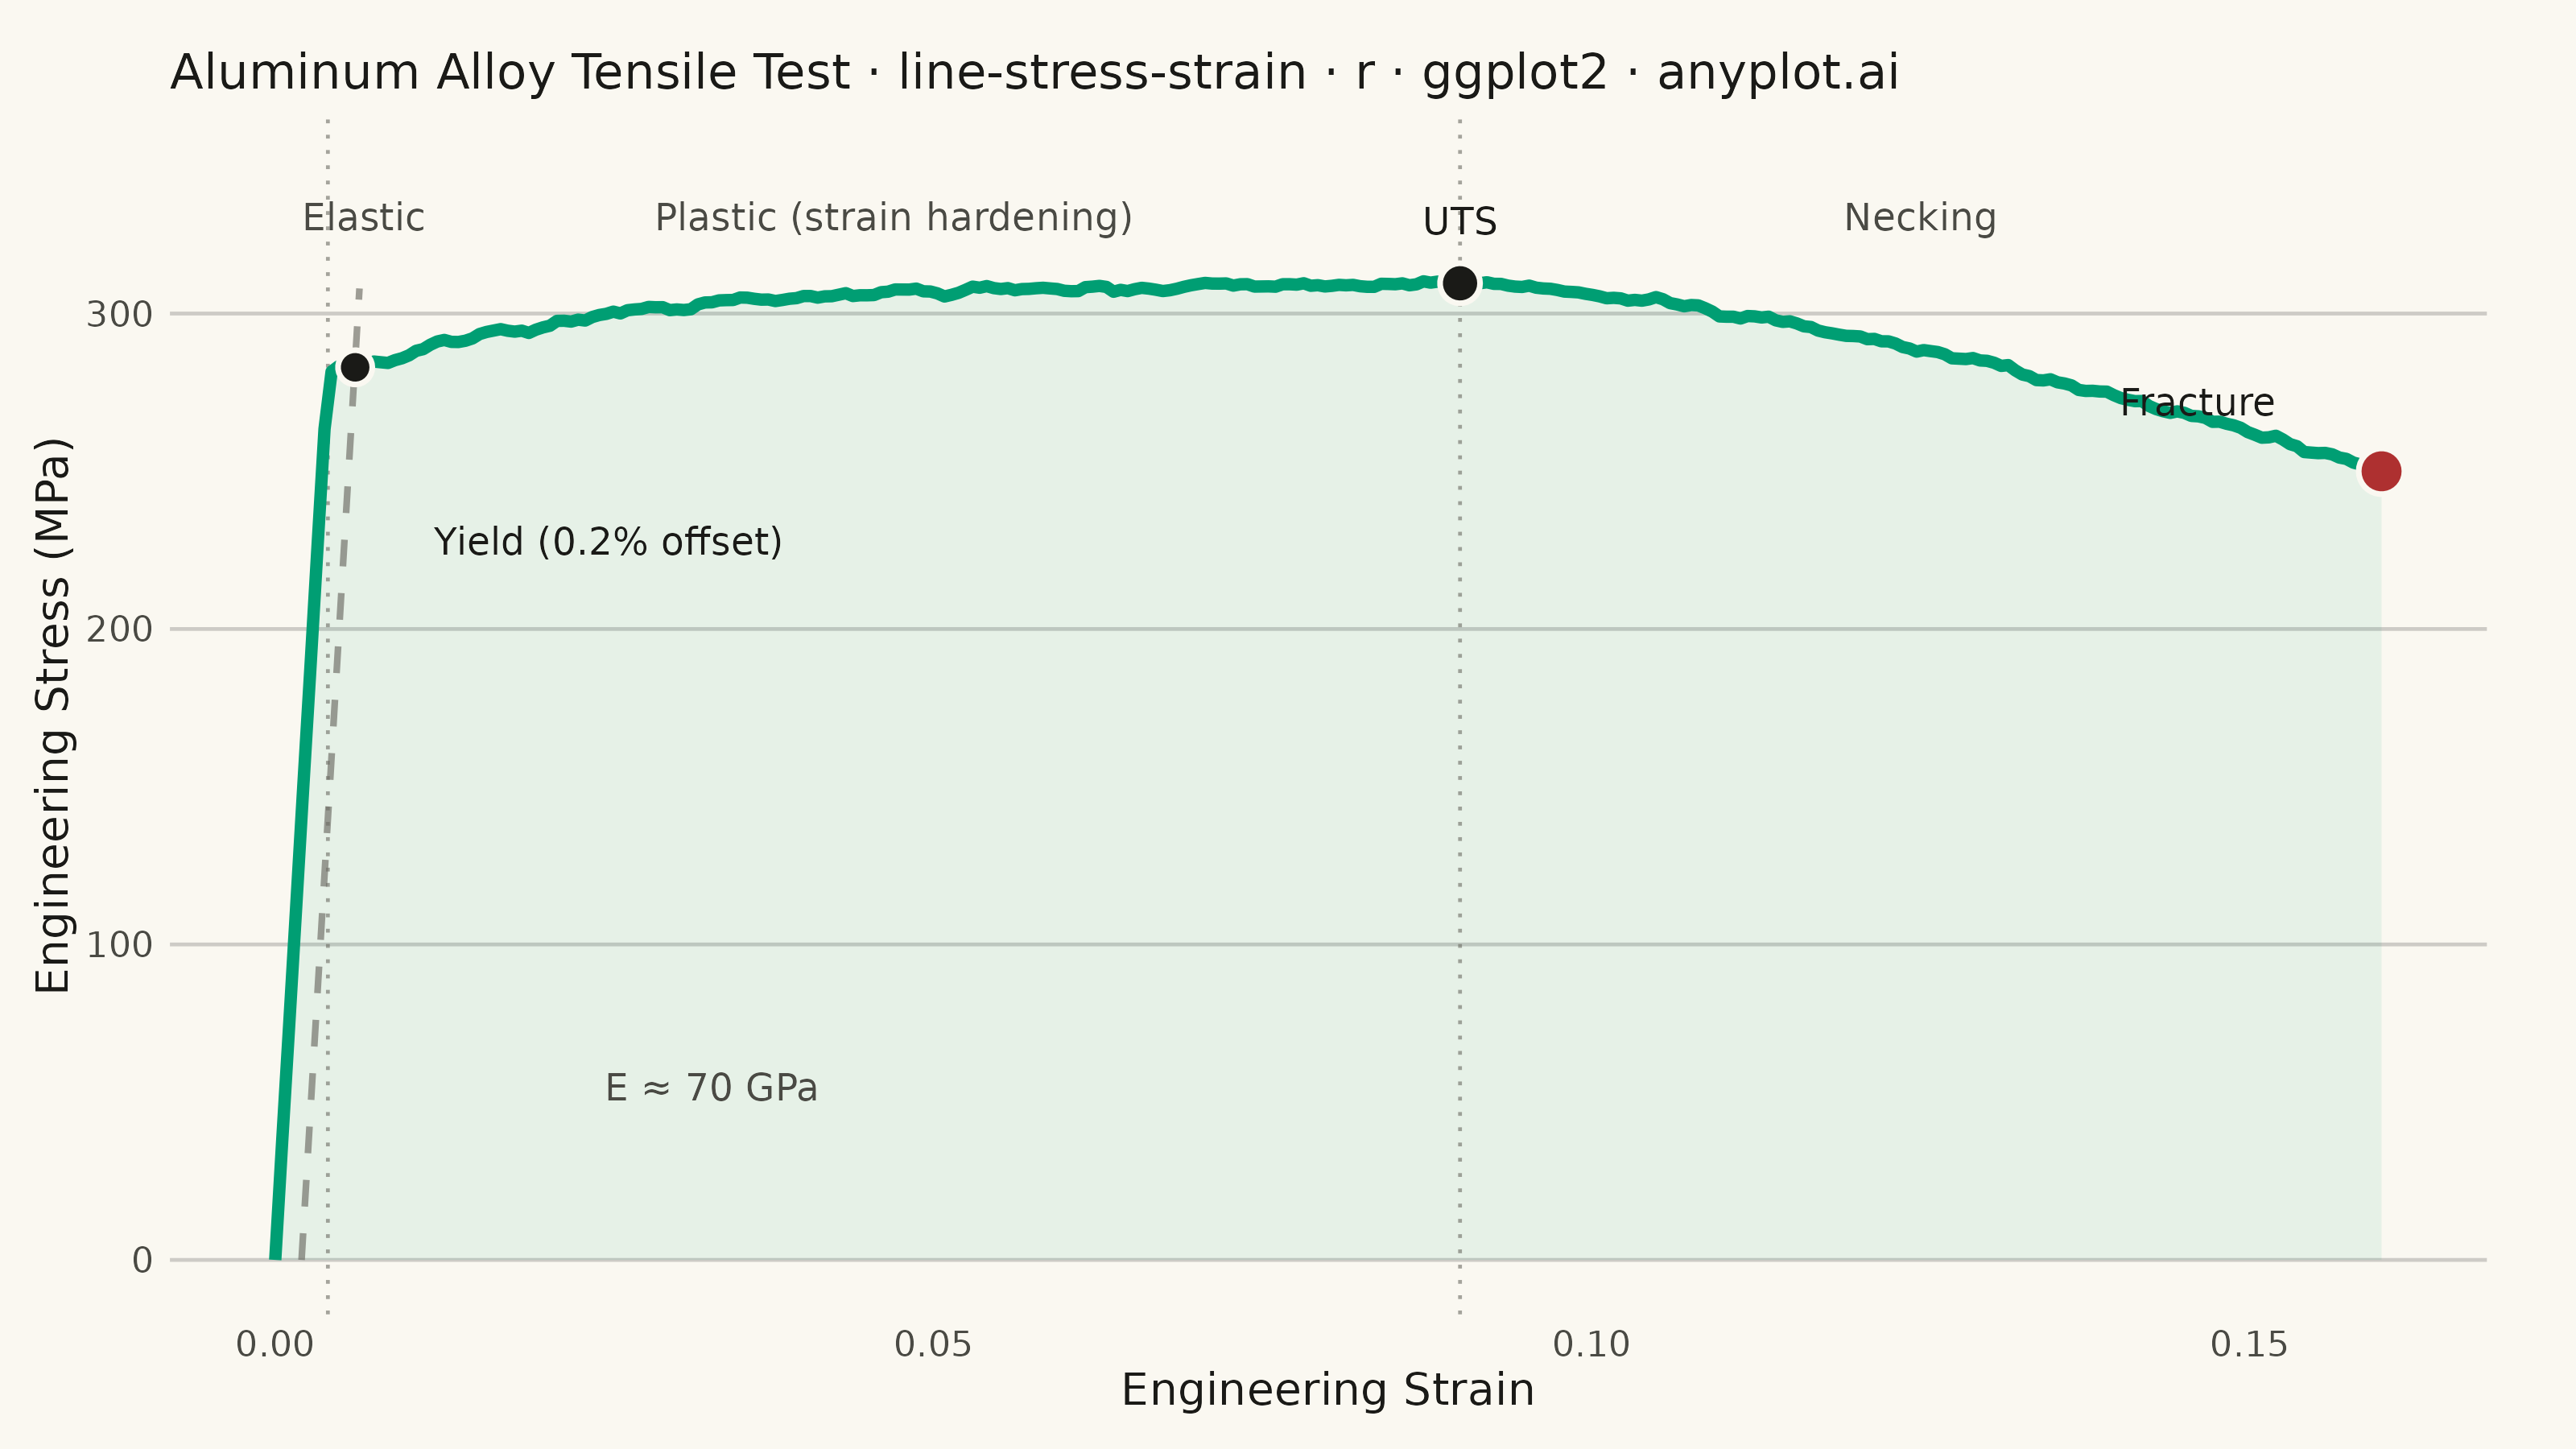
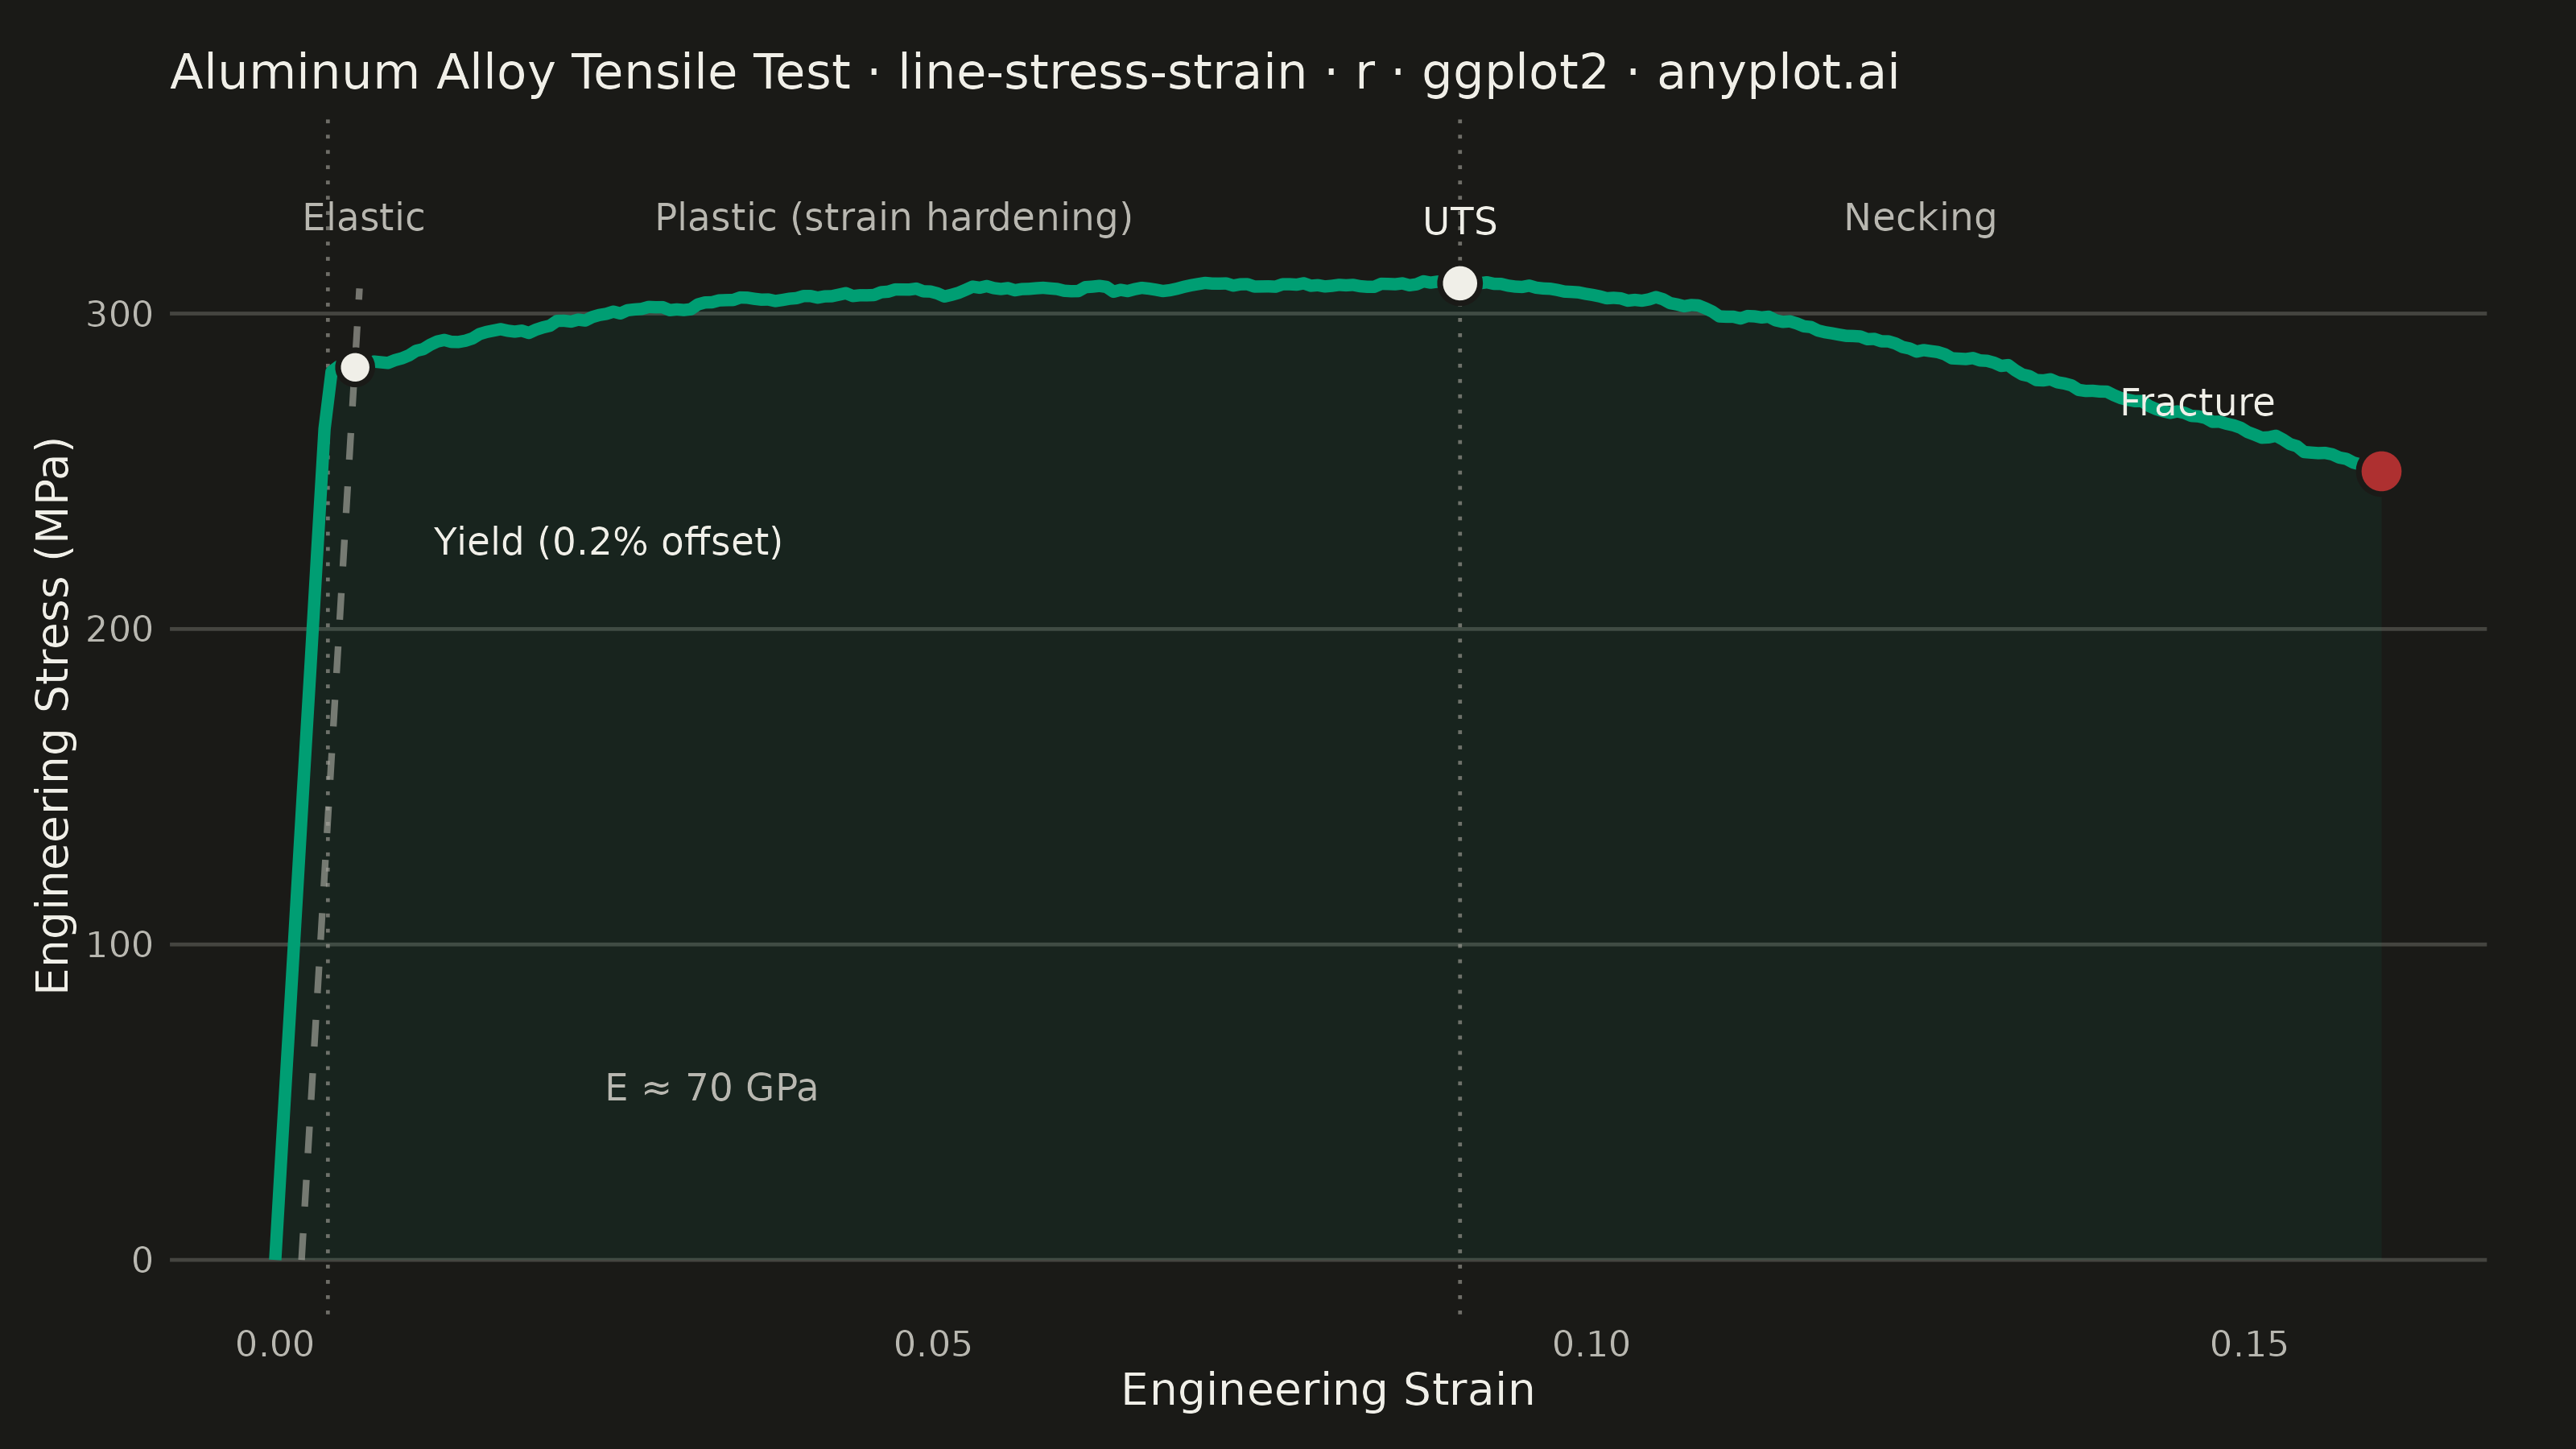
An engineering stress-strain curve visualizes the relationship between applied stress (MPa) and resulting strain (dimensionless) in a material under uniaxial tensile loading. The curve reveals distinct mechanical behavior regions — elastic deformation, yielding, strain hardening, and necking — culminating in fracture. It is the foundational plot for characterizing material mechanical properties and comparing material performance.
#' anyplot.ai
#' line-stress-strain: Engineering Stress-Strain Curve
#' Library: ggplot2 3.5.1 | R 4.4.1
#' Quality: 87/100 | Created: 2026-08-24

library(ggplot2)
library(ragg)

set.seed(42)

# --- Theme tokens ------------------------------------------------------------
THEME     <- Sys.getenv("ANYPLOT_THEME", "light")
PAGE_BG   <- if (THEME == "light") "#FAF8F1" else "#1A1A17"
INK       <- if (THEME == "light") "#1A1A17" else "#F0EFE8"
INK_SOFT  <- if (THEME == "light") "#4A4A44" else "#B8B7B0"
INK_MUTED <- if (THEME == "light") "#6B6A63" else "#A8A79F"
IMPRINT_PALETTE <- c("#009E73", "#C475FD", "#4467A3", "#BD8233",
                     "#AE3030", "#2ABCCD", "#954477", "#99B314")
BRAND <- IMPRINT_PALETTE[1]
BAD   <- IMPRINT_PALETTE[5]  # matte red — semantic anchor for fracture/failure
# ggplot2's element_line() has no alpha argument, so soften gridlines by
# baking a low-alpha channel into the color itself.
GRID_COLOR <- grDevices::adjustcolor(INK, alpha.f = 0.2)

# --- Material model (aluminum alloy, uniaxial tensile test) ------------------
elastic_modulus_mpa <- 70000  # ~70 GPa, aluminum alloy
e_proportional       <- 0.004 # strain at the proportional limit
stress_proportional  <- elastic_modulus_mpa * e_proportional
asymptote_mpa        <- 310   # hardening ceiling approached near UTS
e_uts                <- 0.09  # strain at ultimate tensile strength
hardening_decay      <- 0.02
fracture_stress_mpa  <- 250
e_fracture           <- 0.16

stress_uts_mpa <- asymptote_mpa -
  (asymptote_mpa - stress_proportional) * exp(-(e_uts - e_proportional) / hardening_decay)

material_curve <- function(strain) {
  ifelse(
    strain <= e_proportional,
    elastic_modulus_mpa * strain,
    ifelse(
      strain <= e_uts,
      asymptote_mpa - (asymptote_mpa - stress_proportional) *
        exp(-(strain - e_proportional) / hardening_decay),
      stress_uts_mpa - (stress_uts_mpa - fracture_stress_mpa) *
        ((strain - e_uts) / (e_fracture - e_uts))^1.5
    )
  )
}

# --- Sampled tensile-test data ------------------------------------------------
n_points    <- 300
strain      <- seq(0, e_fracture, length.out = n_points)
raw_noise   <- rnorm(n_points, mean = 0, sd = 1.5)
smooth_noise <- as.numeric(stats::filter(raw_noise, rep(1 / 4, 4), sides = 2))
smooth_noise[is.na(smooth_noise)] <- 0
stress_mpa  <- material_curve(strain) + smooth_noise
df <- tibble::tibble(strain = strain, stress_mpa = stress_mpa)

# --- Critical points: yield (0.2% offset), UTS, fracture ---------------------
offset_root <- uniroot(
  function(s) material_curve(s) - elastic_modulus_mpa * (s - 0.002),
  interval = c(e_proportional, e_uts)
)
yield_strain <- offset_root$root
yield_stress <- material_curve(yield_strain)

critical_points <- tibble::tibble(
  label      = c("Yield (0.2% offset)", "UTS", "Fracture"),
  strain     = c(yield_strain, e_uts, e_fracture),
  stress_mpa = c(yield_stress, stress_uts_mpa, fracture_stress_mpa),
  fill_color = c(INK, INK, BAD),
  point_size = c(3.0, 3.6, 4.2)  # size hierarchy: yield -> UTS -> fracture
)

offset_y_end <- min(340, yield_stress + 25)
offset_x_end <- 0.002 + offset_y_end / elastic_modulus_mpa
offset_line <- tibble::tibble(
  strain     = c(0.002, offset_x_end),
  stress_mpa = c(0, offset_y_end)
)

# --- Title (fontsize scales with title length, see plot-generator.md) --------
plot_title  <- "Aluminum Alloy Tensile Test · line-stress-strain · r · ggplot2 · anyplot.ai"
title_ratio <- if (nchar(plot_title) > 67) 67 / nchar(plot_title) else 1.0
title_size  <- max(8, round(12 * title_ratio))

# --- Plot ----------------------------------------------------------------------
p <- ggplot(df, aes(strain, stress_mpa)) +
  geom_ribbon(aes(ymin = 0, ymax = stress_mpa), fill = BRAND, alpha = 0.08) +
  geom_vline(xintercept = c(e_proportional, e_uts), linetype = "dotted",
             color = INK_MUTED, linewidth = 0.4, alpha = 0.6) +
  geom_line(data = offset_line, aes(strain, stress_mpa),
            linetype = "dashed", color = INK_MUTED, linewidth = 0.7, alpha = 0.65) +
  geom_line(color = BRAND, linewidth = 1.3) +
  geom_point(data = critical_points, aes(strain, stress_mpa),
             shape = 21, size = critical_points$point_size, fill = critical_points$fill_color,
             color = PAGE_BG, stroke = 0.9) +
  annotate("text", x = e_proportional / 2, y = 335, label = "Elastic",
           hjust = 0, vjust = 1, size = 3.0, color = INK_SOFT) +
  annotate("text", x = (e_proportional + e_uts) / 2, y = 335,
           label = "Plastic (strain hardening)",
           hjust = 0.5, vjust = 1, size = 3.0, color = INK_SOFT) +
  annotate("text", x = (e_uts + e_fracture) / 2, y = 335, label = "Necking",
           hjust = 0.5, vjust = 1, size = 3.0, color = INK_SOFT) +
  annotate("text", x = 0.025, y = 55,
           label = paste0("E ≈ ", round(elastic_modulus_mpa / 1000), " GPa"),
           hjust = 0, size = 3.0, color = INK_SOFT) +
  annotate("text", x = yield_strain + 0.006, y = yield_stress - 55,
           label = "Yield (0.2% offset)", hjust = 0, size = 3.0, color = INK) +
  annotate("text", x = e_uts, y = stress_uts_mpa + 20,
           label = "UTS", hjust = 0.5, size = 3.0, color = INK) +
  annotate("text", x = e_fracture - 0.008, y = fracture_stress_mpa + 22,
           label = "Fracture", hjust = 1, size = 3.0, color = INK) +
  labs(
    x     = "Engineering Strain",
    y     = "Engineering Stress (MPa)",
    title = plot_title
  ) +
  coord_cartesian(ylim = c(0, 345)) +
  theme_minimal(base_size = 8) +
  theme(
    plot.background    = element_rect(fill = PAGE_BG, color = PAGE_BG),
    panel.background   = element_rect(fill = PAGE_BG, color = NA),
    panel.grid.major.y = element_line(color = GRID_COLOR, linewidth = 0.4),
    panel.grid.major.x = element_blank(),
    panel.grid.minor   = element_blank(),
    axis.title         = element_text(color = INK, size = 10),
    axis.text          = element_text(color = INK_SOFT, size = 8),
    axis.ticks         = element_blank(),
    plot.title         = element_text(color = INK, size = title_size),
    plot.margin        = margin(12, 20, 8, 8)
  )

ggsave(
  filename = sprintf("plot-%s.png", THEME),
  plot     = p,
  device   = ragg::agg_png,
  width    = 8,
  height   = 4.5,
  units    = "in",
  dpi      = 400
)
Runnable source as JSON, for any HTTP client: https://api.anyplot.ai/specs/line-stress-strain/ggplot2/code. Any spec id and library id listed in llms-full.txt fit the same URL shape; every URL below is complete and callable.
{
  "spec_id": "line-stress-strain",
  "language": "r",
  "library": "ggplot2",
  "page": "https://anyplot.ai/line-stress-strain/r/ggplot2",
  "hub": "https://anyplot.ai/line-stress-strain",
  "code_json": "https://api.anyplot.ai/specs/line-stress-strain/ggplot2/code",
  "spec_json": "https://api.anyplot.ai/specs/line-stress-strain",
  "render_light_png": "https://storage.googleapis.com/anyplot-images/plots/line-stress-strain/r/ggplot2/plot-light.png",
  "render_dark_png": "https://storage.googleapis.com/anyplot-images/plots/line-stress-strain/r/ggplot2/plot-dark.png",
  "quality_score": 87.0,
  "license": "MIT",
  "guide": "https://anyplot.ai/llms.txt"
}
Part of Engineering Stress-Strain Curve on anyplot.ai.