The same plot in 14 other libraries — JavaScript: Chart.js, D3.js, Apache ECharts, MUI X Charts; Python: Altair, Bokeh, lets-plot, Matplotlib, Plotly, plotnine, Pygal, Seaborn; R: ggplot2; Julia: Makie.jl. Compare all 15 side by side: Engineering Stress-Strain Curve in Python, R, Julia and JavaScript.
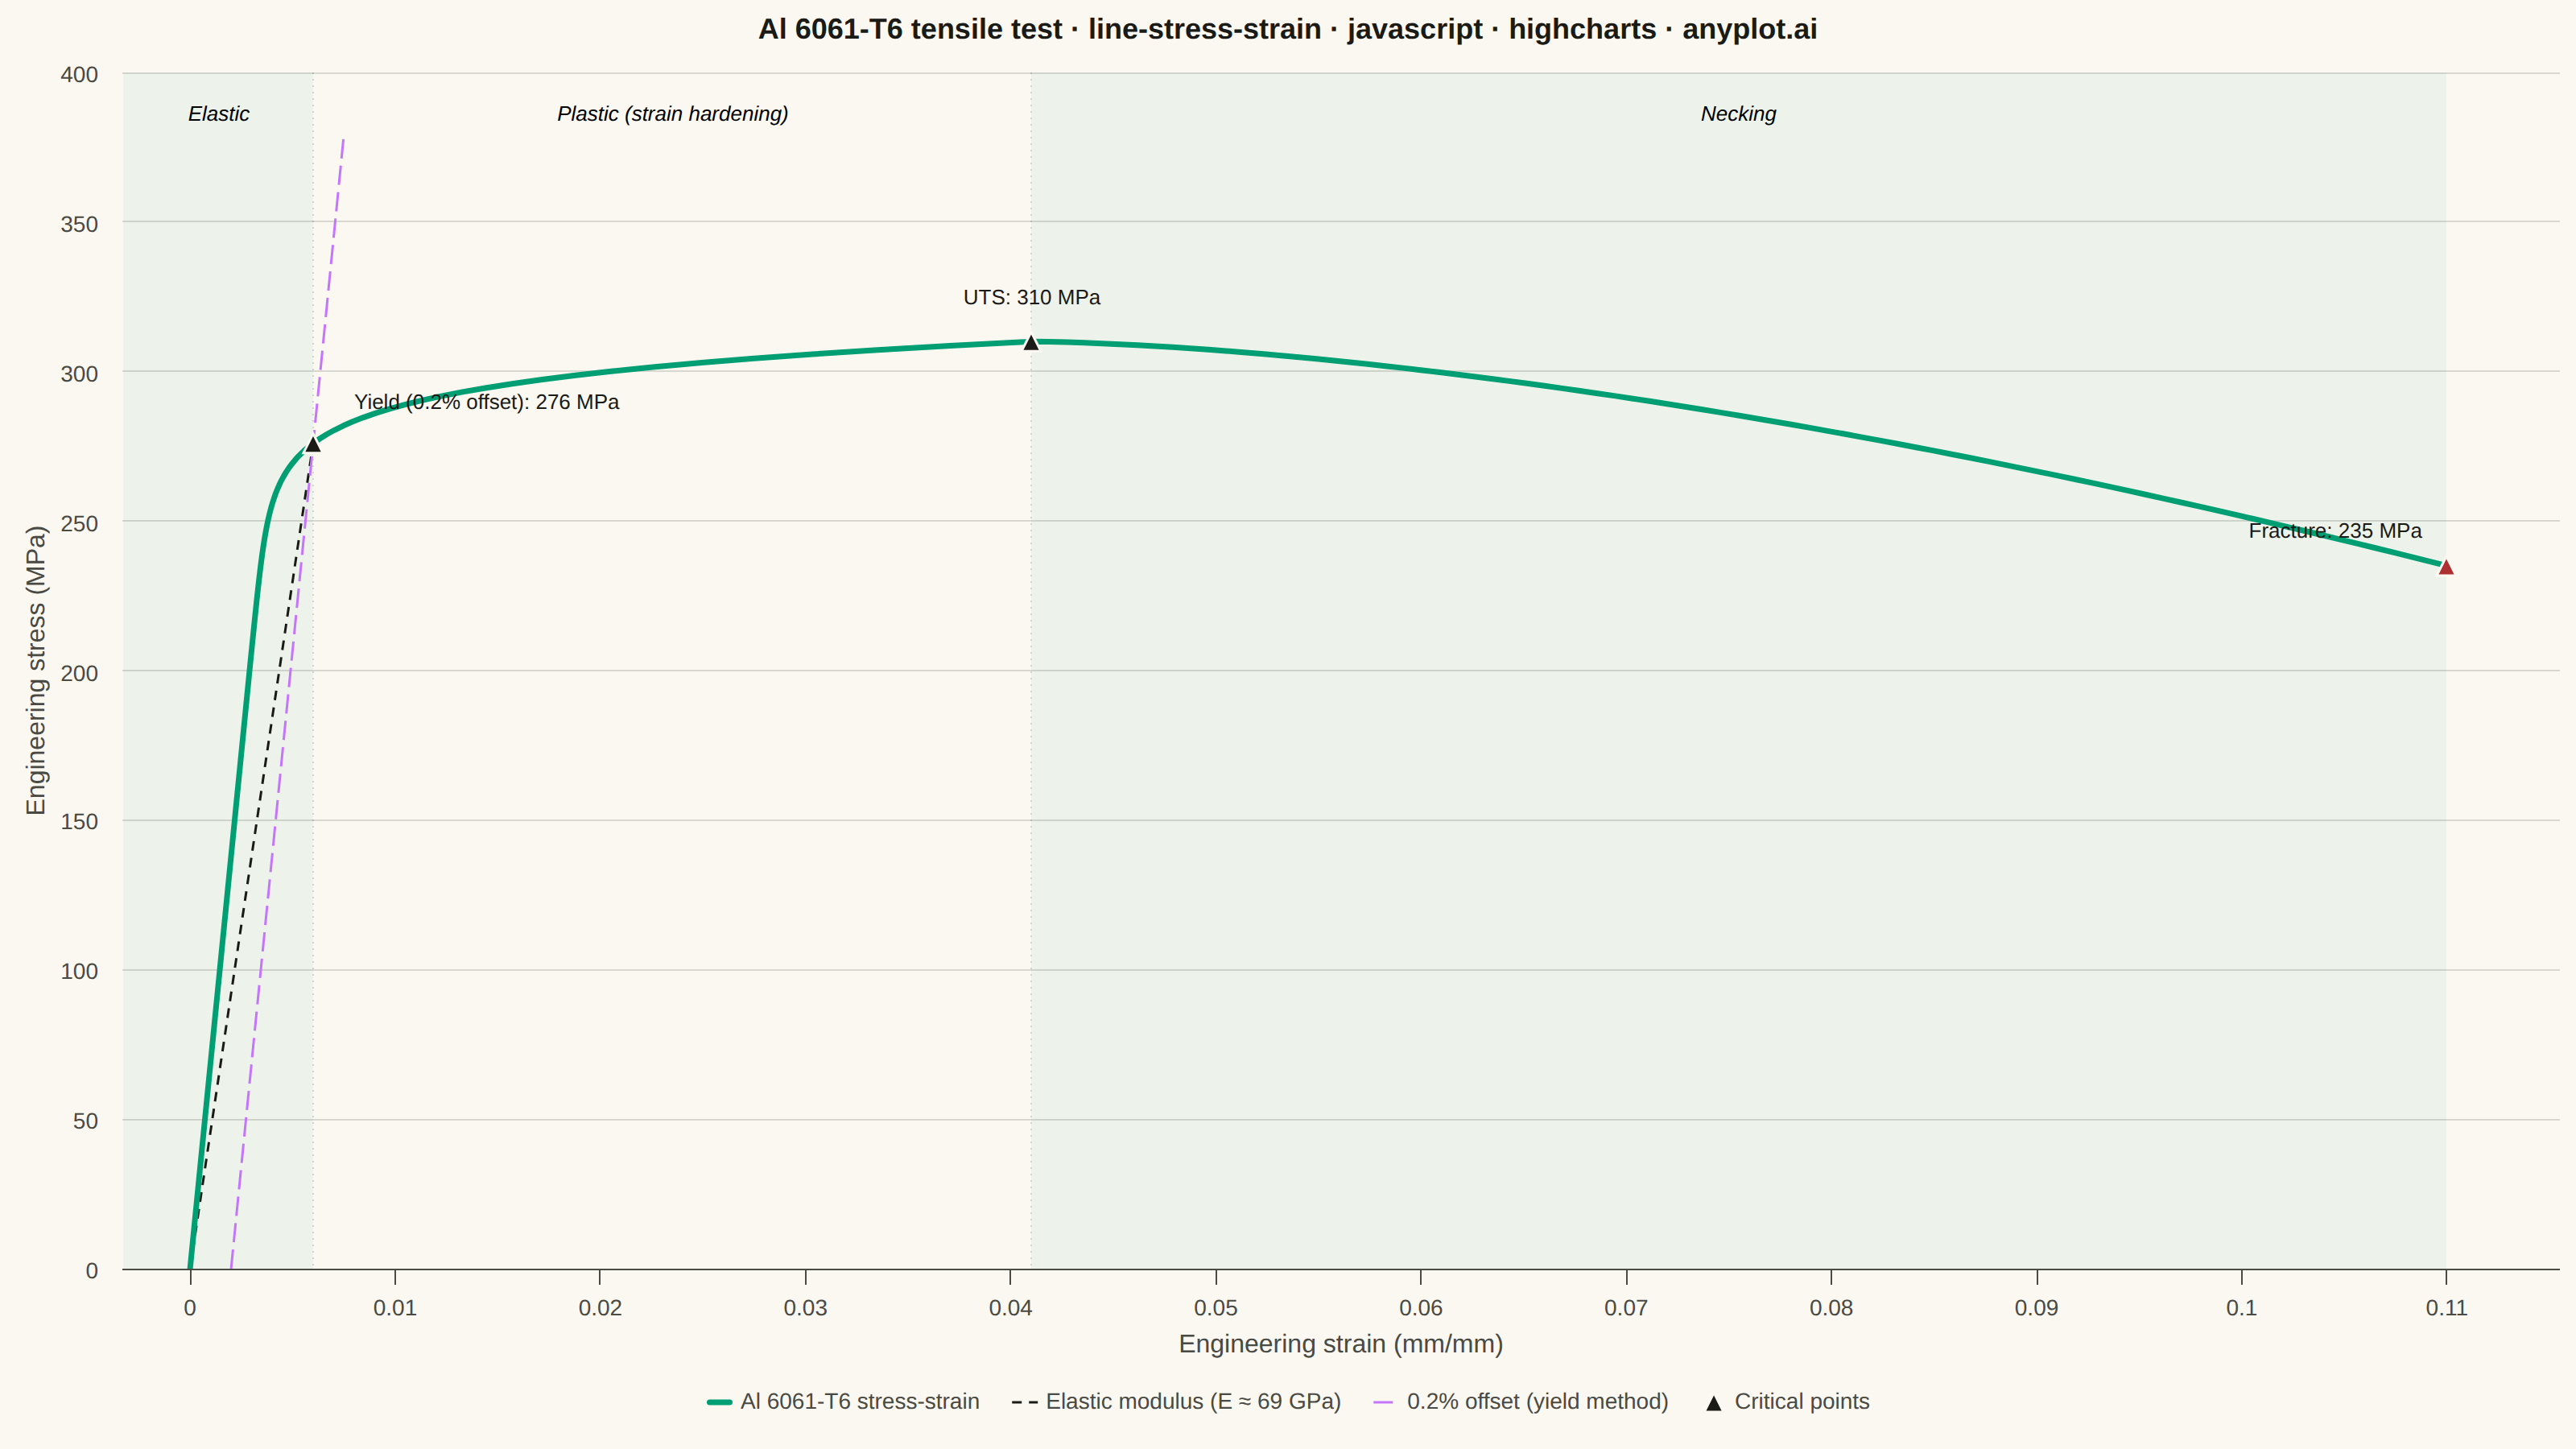
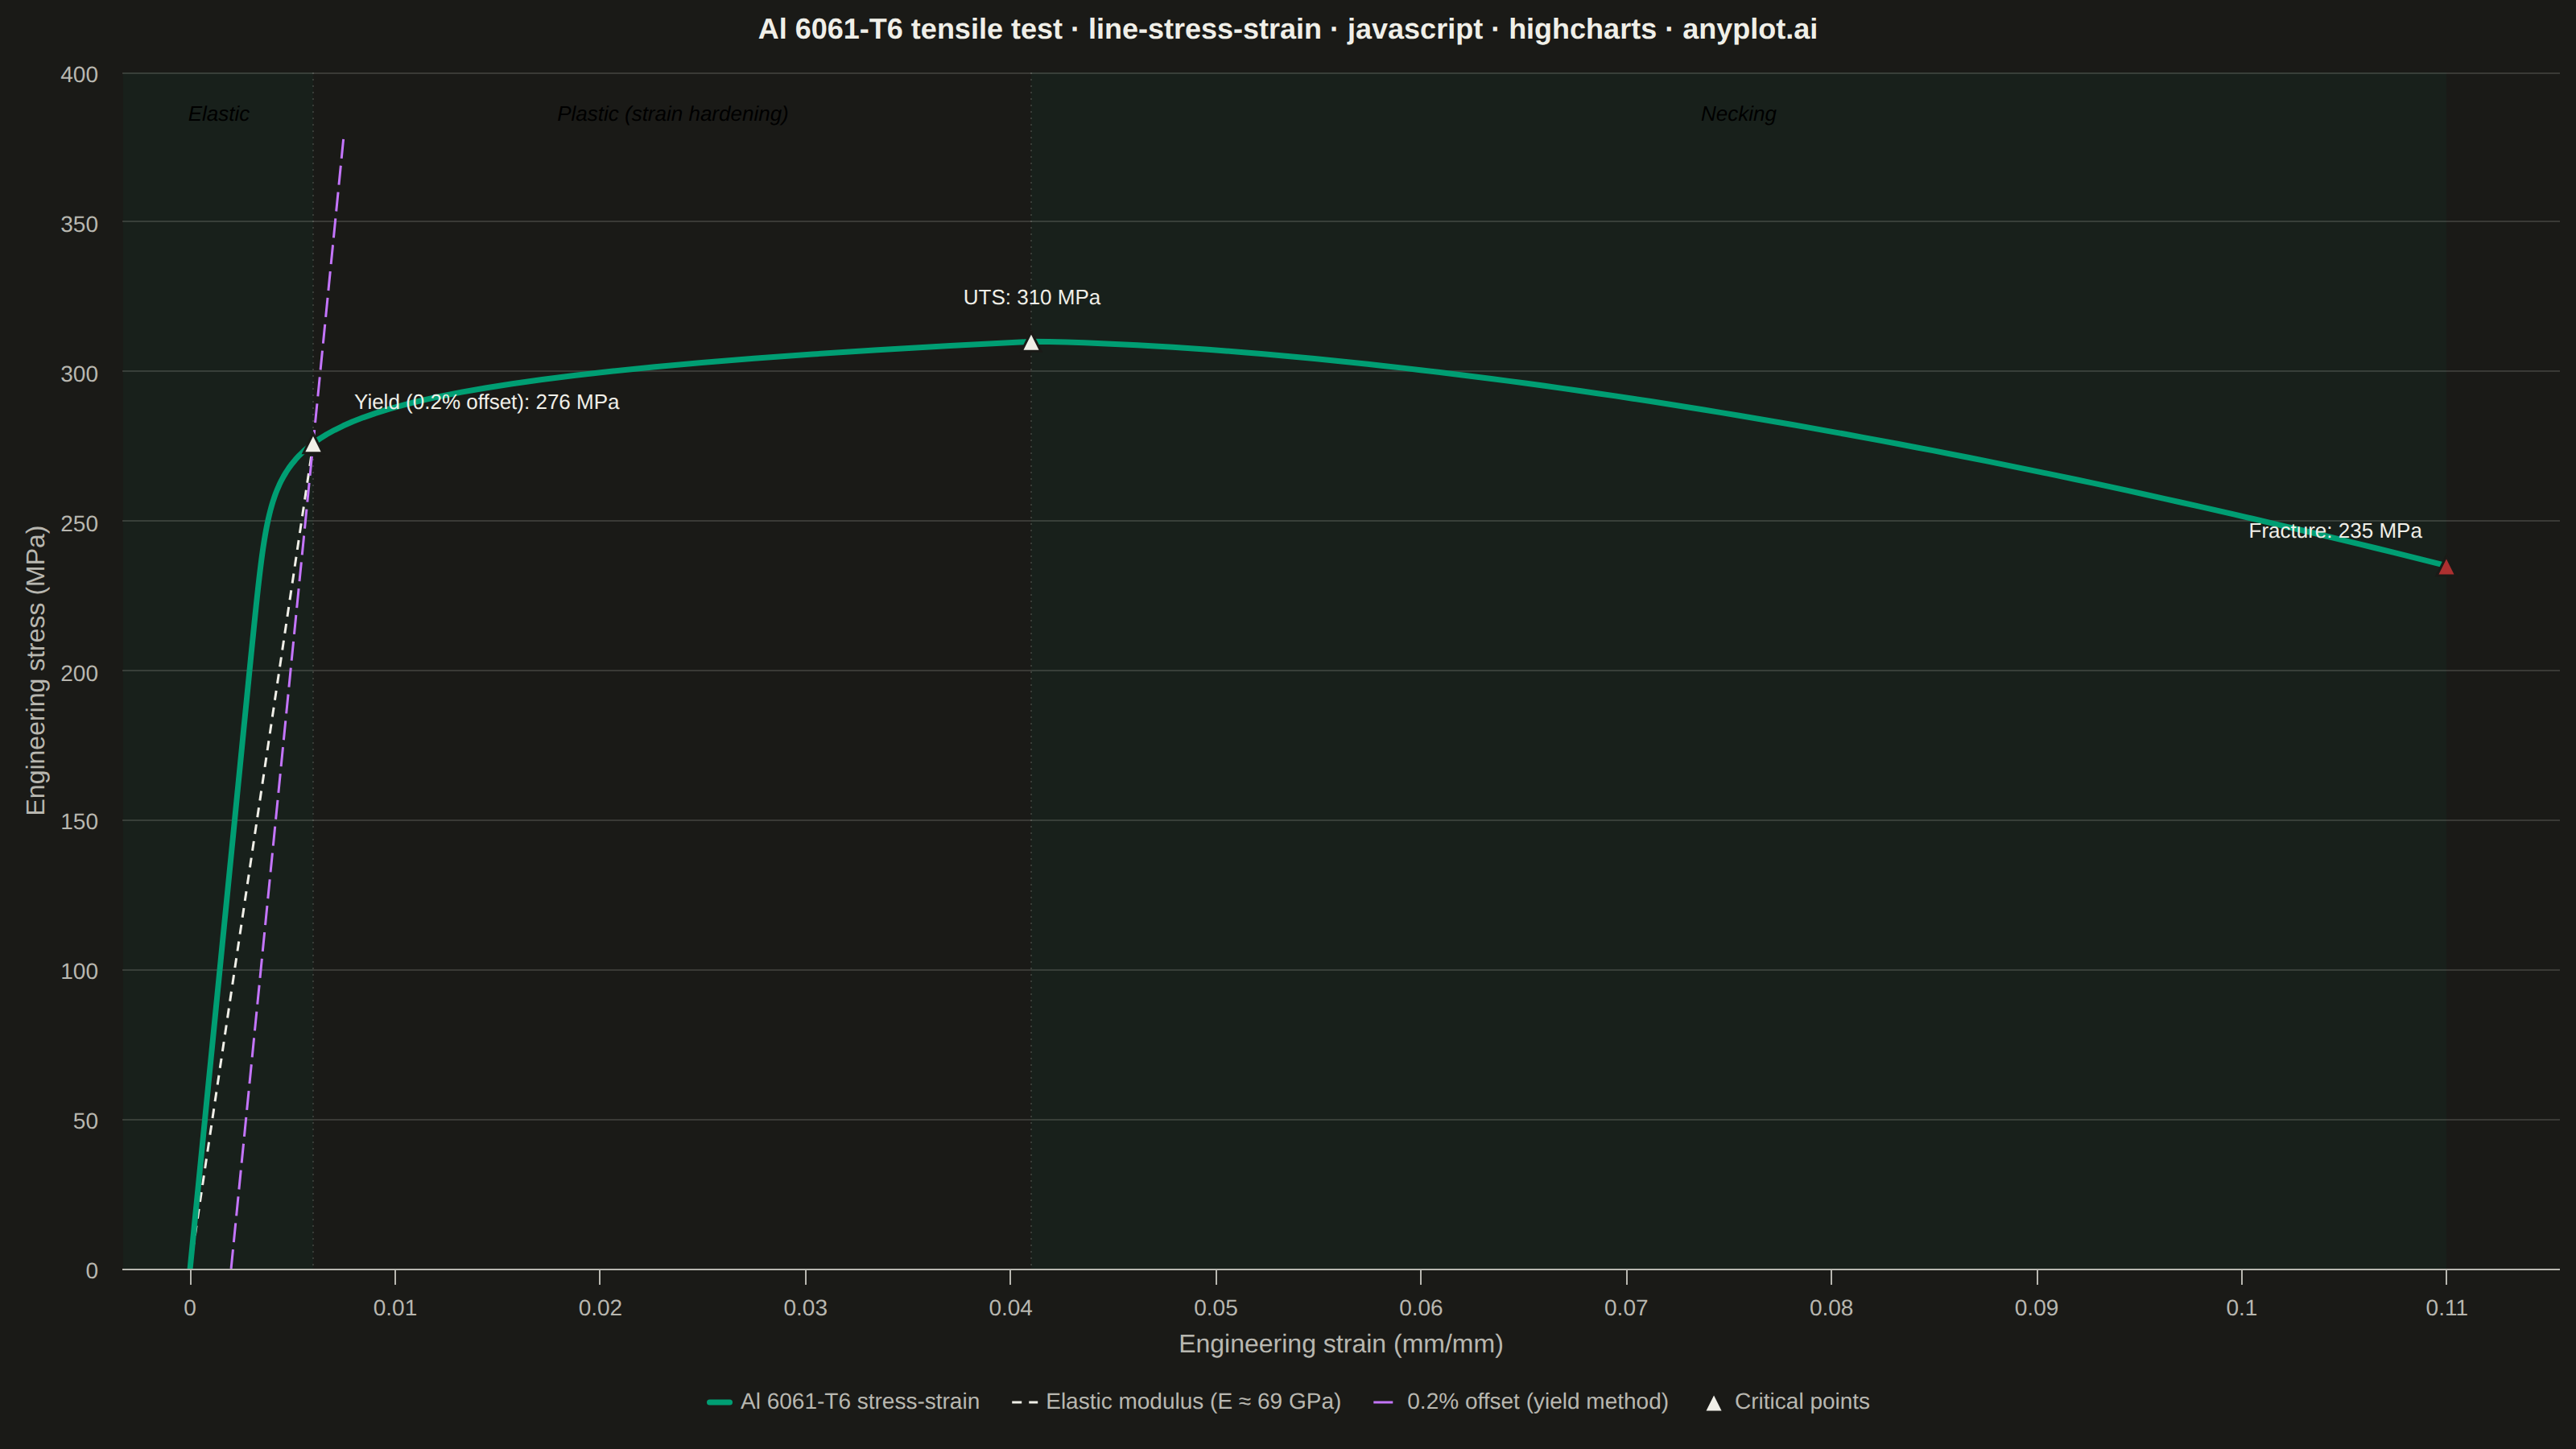
An engineering stress-strain curve visualizes the relationship between applied stress (MPa) and resulting strain (dimensionless) in a material under uniaxial tensile loading. The curve reveals distinct mechanical behavior regions — elastic deformation, yielding, strain hardening, and necking — culminating in fracture. It is the foundational plot for characterizing material mechanical properties and comparing material performance.
// anyplot.ai
// line-stress-strain: Engineering Stress-Strain Curve
// Library: highcharts 12.6.0 | JavaScript 22.23.2
// Quality: 89/100 | Created: 2026-08-24

const t = window.ANYPLOT_TOKENS;

// --- Data: Aluminum 6061-T6 tensile test (Ramberg-Osgood elastic-plastic model) --
const E = 69000; // Young's modulus, MPa
const sigmaY = 276; // 0.2% offset yield strength, MPa
const sigmaUTS = 310; // ultimate tensile strength, MPa
const sigmaFracture = 235; // fracture stress, MPa
const roExponent = 25; // Ramberg-Osgood hardening exponent

const curve = [];
const hardeningSteps = 220;
for (let i = 0; i <= hardeningSteps; i++) {
  const sigma = (sigmaUTS * i) / hardeningSteps;
  const strain = sigma / E + 0.002 * Math.pow(sigma / sigmaY, roExponent);
  curve.push([strain, sigma]);
}
const strainAtUTS = curve[curve.length - 1][0];
const strainAtFracture = 0.11;

const neckingSteps = 80;
for (let i = 1; i <= neckingSteps; i++) {
  const frac = i / neckingSteps;
  const strain = strainAtUTS + frac * (strainAtFracture - strainAtUTS);
  const stress = sigmaUTS - (sigmaUTS - sigmaFracture) * Math.pow(frac, 1.6);
  curve.push([strain, stress]);
}

// 0.2% offset method: yield point is where the curve meets the offset line
const strainAtYield = sigmaY / E + 0.002;

const elasticModulusLine = [
  [0, 0],
  [strainAtYield, sigmaY],
];
const offsetLine = [
  [0.002, 0],
  [strainAtYield + 0.0015, E * (strainAtYield + 0.0015 - 0.002)],
];

// x-axis min pulled slightly negative so the origin-anchored elastic-modulus
// and offset construction lines get breathing room from the left edge.
const xAxisMin = -strainAtFracture * 0.03;

const criticalPoints = [
  {
    x: strainAtYield,
    y: sigmaY,
    name: "Yield (0.2% offset)",
    color: t.ink,
    dataLabels: { align: "left", x: 20, y: -14 },
  },
  {
    x: strainAtUTS,
    y: sigmaUTS,
    name: "UTS",
    color: t.ink,
    dataLabels: { align: "center", x: 0, y: -16 },
  },
  {
    x: strainAtFracture,
    y: sigmaFracture,
    name: "Fracture",
    color: t.palette[4],
    dataLabels: { align: "right", x: -10, y: -10 },
  },
];

// --- Title (scaled to the mandated + descriptive prefix length) ------------
const titleText = "Al 6061-T6 tensile test · line-stress-strain · javascript · highcharts · anyplot.ai";
const titleLen = titleText.length;
const titleFontSize = Math.max(14, Math.round(22 * (titleLen > 67 ? 67 / titleLen : 1)));

// --- Chart -------------------------------------------------------------------
Highcharts.chart("container", {
  chart: {
    type: "line",
    backgroundColor: "transparent",
    animation: false,
    style: { fontFamily: "inherit" },
  },
  credits: { enabled: false },
  colors: t.palette,
  title: {
    text: titleText,
    style: { color: t.ink, fontSize: `${titleFontSize}px`, fontWeight: "600" },
  },
  xAxis: {
    title: { text: "Engineering strain (mm/mm)", style: { color: t.inkSoft, fontSize: "16px" } },
    min: xAxisMin,
    max: strainAtFracture * 1.05,
    lineColor: t.inkSoft,
    tickColor: t.inkSoft,
    gridLineWidth: 0,
    labels: { style: { color: t.inkSoft, fontSize: "14px" } },
    plotBands: [
      { from: xAxisMin, to: strainAtYield, color: Highcharts.color(t.palette[0]).setOpacity(0.05).get(), label: { text: "Elastic", align: "center", verticalAlign: "top", y: 30, style: { color: t.inkMuted, fontSize: "13px", fontStyle: "italic" } } },
      { from: strainAtYield, to: strainAtUTS, color: "transparent", label: { text: "Plastic (strain hardening)", align: "center", verticalAlign: "top", y: 30, style: { color: t.inkMuted, fontSize: "13px", fontStyle: "italic" } } },
      { from: strainAtUTS, to: strainAtFracture, color: Highcharts.color(t.palette[0]).setOpacity(0.05).get(), label: { text: "Necking", align: "center", verticalAlign: "top", y: 30, style: { color: t.inkMuted, fontSize: "13px", fontStyle: "italic" } } },
    ],
    plotLines: [
      { value: strainAtYield, color: t.grid, width: 1, dashStyle: "Dot", zIndex: 0 },
      { value: strainAtUTS, color: t.grid, width: 1, dashStyle: "Dot", zIndex: 0 },
    ],
  },
  yAxis: {
    title: { text: "Engineering stress (MPa)", style: { color: t.inkSoft, fontSize: "16px" } },
    min: 0,
    lineColor: t.inkSoft,
    tickColor: t.inkSoft,
    gridLineColor: t.grid,
    labels: { style: { color: t.inkSoft, fontSize: "14px" } },
  },
  legend: {
    align: "center",
    verticalAlign: "bottom",
    itemStyle: { color: t.inkSoft, fontSize: "14px" },
    itemHoverStyle: { color: t.ink },
  },
  tooltip: {
    headerFormat: "",
    pointFormat: "strain {point.x:.3f} · stress {point.y:.0f} MPa",
  },
  plotOptions: {
    series: { animation: false },
    line: { marker: { enabled: false } },
  },
  series: [
    {
      name: "Al 6061-T6 stress-strain",
      type: "line",
      data: curve,
      color: t.palette[0],
      lineWidth: 3.5,
      zIndex: 3,
    },
    {
      name: "Elastic modulus (E ≈ 69 GPa)",
      type: "line",
      data: elasticModulusLine,
      color: t.ink,
      lineWidth: 1.5,
      dashStyle: "Dash",
      enableMouseTracking: false,
      zIndex: 1,
    },
    {
      name: "0.2% offset (yield method)",
      type: "line",
      data: offsetLine,
      color: t.palette[1],
      lineWidth: 1.5,
      dashStyle: "LongDash",
      enableMouseTracking: false,
      zIndex: 1,
    },
    {
      name: "Critical points",
      type: "scatter",
      data: criticalPoints,
      color: t.ink,
      marker: { enabled: true, radius: 6, lineWidth: 1.5, lineColor: t.pageBg },
      dataLabels: {
        enabled: true,
        formatter() {
          return `${this.point.name}: ${Math.round(this.y)} MPa`;
        },
        style: { color: t.ink, fontSize: "13px", fontWeight: "500", textOutline: "none" },
        verticalAlign: "bottom",
        y: -12,
      },
      zIndex: 4,
    },
  ],
});
Runnable source as JSON, for any HTTP client: https://api.anyplot.ai/specs/line-stress-strain/highcharts/code. Any spec id and library id listed in llms-full.txt fit the same URL shape; every URL below is complete and callable.
{
  "spec_id": "line-stress-strain",
  "language": "javascript",
  "library": "highcharts",
  "page": "https://anyplot.ai/line-stress-strain/javascript/highcharts",
  "hub": "https://anyplot.ai/line-stress-strain",
  "code_json": "https://api.anyplot.ai/specs/line-stress-strain/highcharts/code",
  "spec_json": "https://api.anyplot.ai/specs/line-stress-strain",
  "render_light_png": "https://storage.googleapis.com/anyplot-images/plots/line-stress-strain/javascript/highcharts/plot-light.png",
  "render_dark_png": "https://storage.googleapis.com/anyplot-images/plots/line-stress-strain/javascript/highcharts/plot-dark.png",
  "interactive_light_html": "https://storage.googleapis.com/anyplot-images/plots/line-stress-strain/javascript/highcharts/plot-light.html",
  "interactive_dark_html": "https://storage.googleapis.com/anyplot-images/plots/line-stress-strain/javascript/highcharts/plot-dark.html",
  "quality_score": 89.0,
  "license": "MIT",
  "guide": "https://anyplot.ai/llms.txt"
}
Part of Engineering Stress-Strain Curve on anyplot.ai.