The same plot in 14 other libraries — Python: Altair, Bokeh, lets-plot, Matplotlib, Plotly, plotnine, Pygal, Seaborn; R: ggplot2; JavaScript: Chart.js, D3.js, Apache ECharts, Highcharts, MUI X Charts. Compare all 15 side by side: Engineering Stress-Strain Curve in Python, R, Julia and JavaScript.
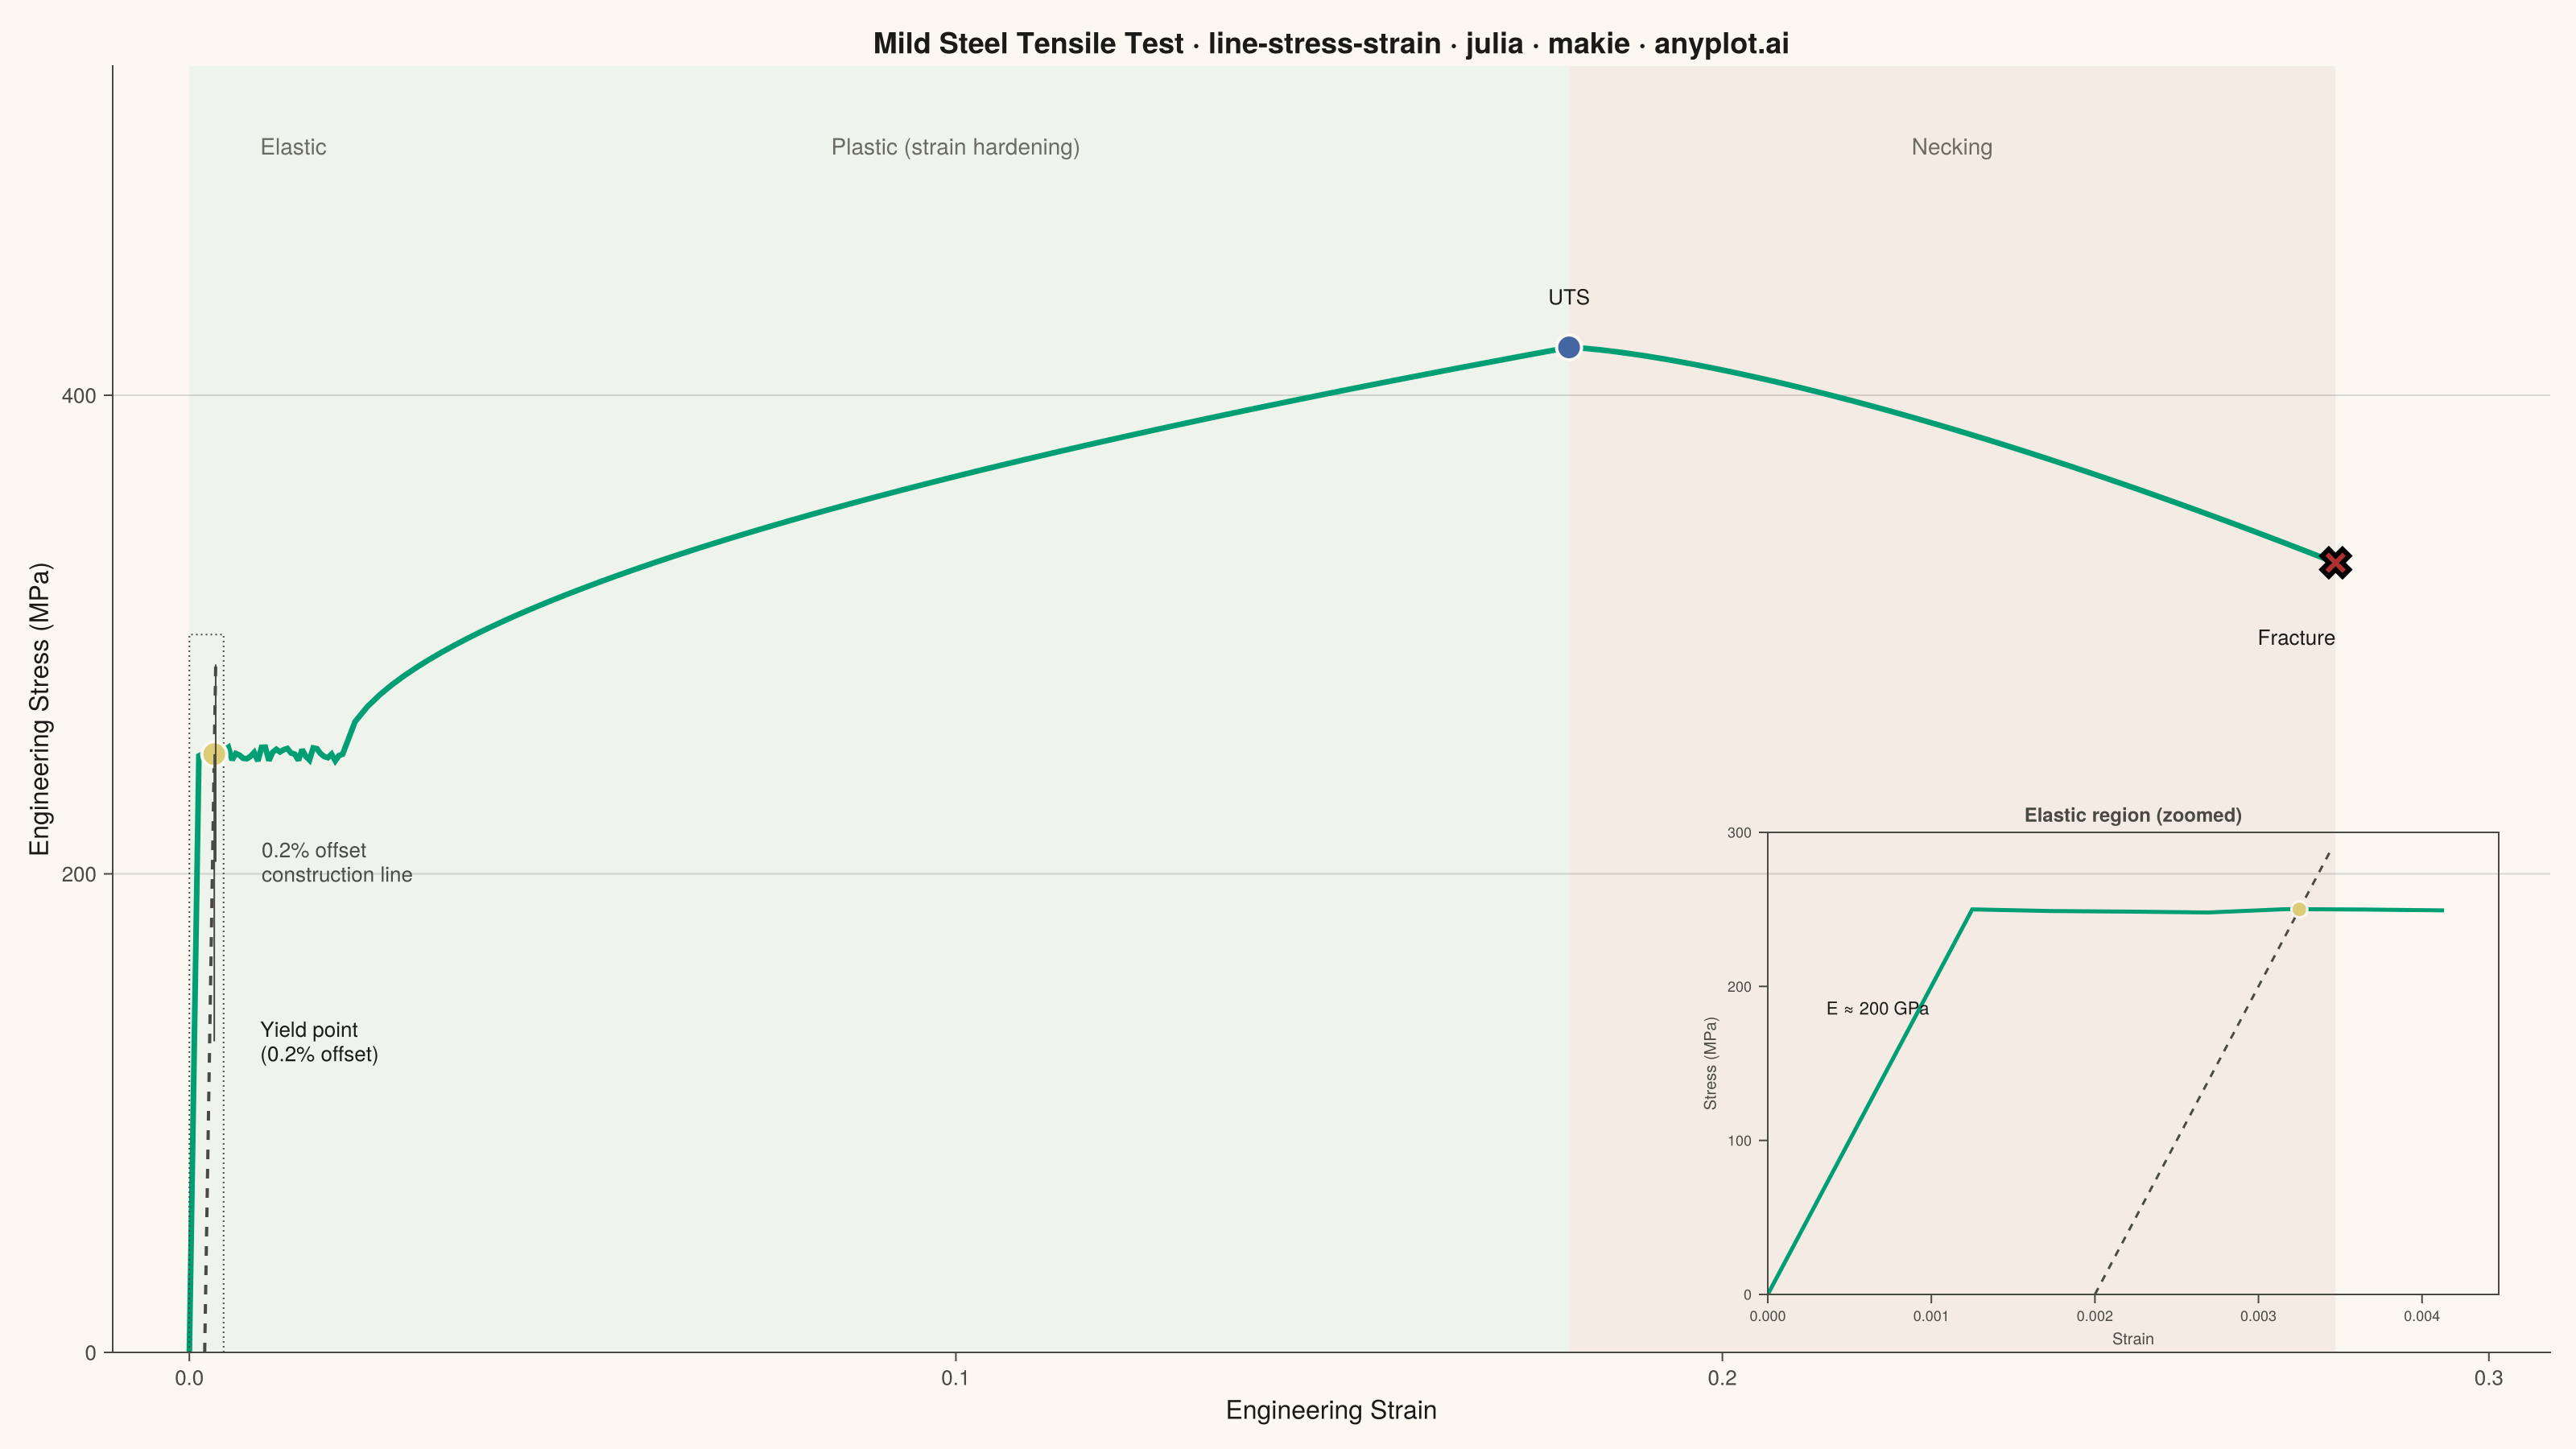
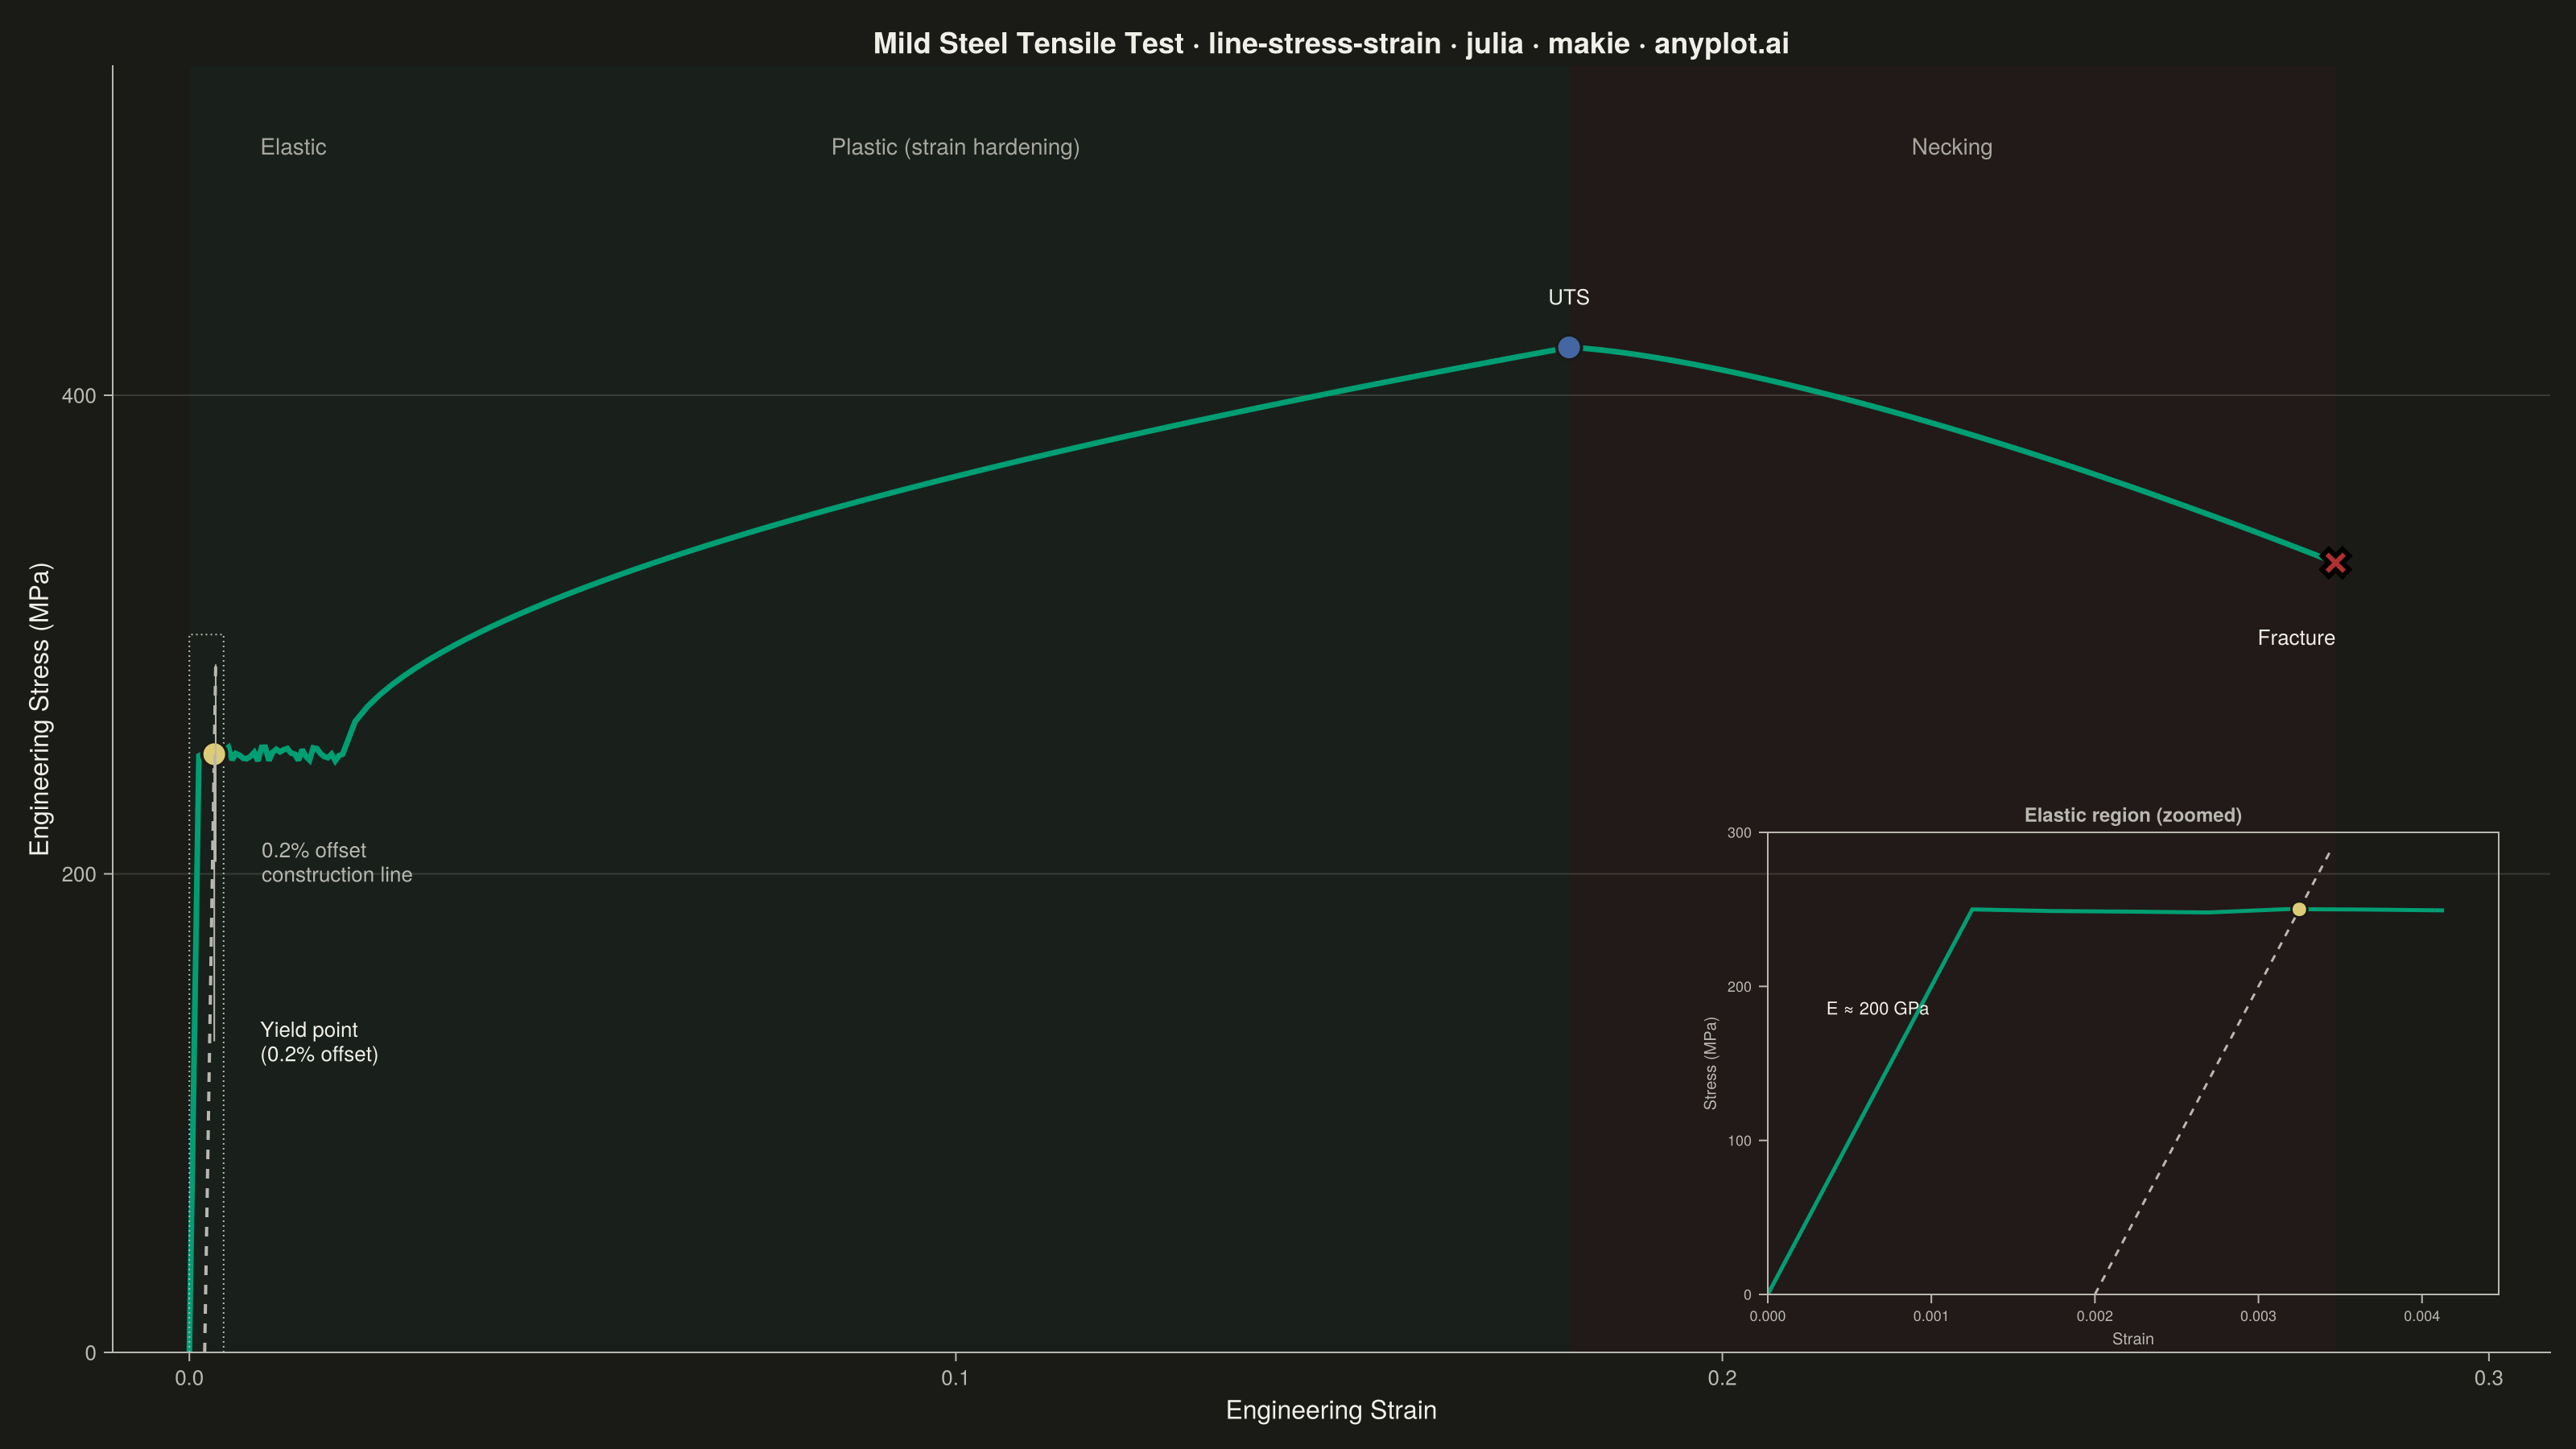
An engineering stress-strain curve visualizes the relationship between applied stress (MPa) and resulting strain (dimensionless) in a material under uniaxial tensile loading. The curve reveals distinct mechanical behavior regions — elastic deformation, yielding, strain hardening, and necking — culminating in fracture. It is the foundational plot for characterizing material mechanical properties and comparing material performance.
# anyplot.ai
# line-stress-strain: Engineering Stress-Strain Curve
# Library: makie 0.21.9 | Julia 1.11.9
# Quality: 94/100 | Created: 2026-08-24

using CairoMakie
using Colors
using Random

Random.seed!(42)

# --- Theme tokens (see prompts/default-style-guide.md "Theme-adaptive Chrome") ---
const THEME     = get(ENV, "ANYPLOT_THEME", "light")
const PAGE_BG   = THEME == "light" ? colorant"#FAF8F1" : colorant"#1A1A17"
const INK       = THEME == "light" ? colorant"#1A1A17" : colorant"#F0EFE8"
const INK_SOFT  = THEME == "light" ? colorant"#4A4A44" : colorant"#B8B7B0"
const INK_MUTED = THEME == "light" ? colorant"#6B6A63" : colorant"#A8A79F"

# Imprint categorical palette — first series always brand green
const IMPRINT_PALETTE = [
    colorant"#009E73", colorant"#C475FD", colorant"#4467A3", colorant"#BD8233",
    colorant"#AE3030", colorant"#2ABCCD", colorant"#954477", colorant"#99B314",
]
const BRAND = IMPRINT_PALETTE[1]
const ANYPLOT_AMBER = colorant"#DDCC77"

# --- Data: mild steel tensile test -------------------------------------------
elastic_modulus   = 200_000.0  # MPa (Young's modulus, mild steel)
yield_stress      = 250.0      # MPa (upper yield point)
yield_strain      = yield_stress / elastic_modulus
luders_end_strain = 0.02       # end of the Luders (yield) plateau
uts_strain        = 0.18
uts_stress        = 420.0      # MPa
fracture_strain   = 0.28
fracture_stress   = 330.0      # MPa

n_elastic = 20
elastic_strain = collect(range(0.0, yield_strain; length=n_elastic))
elastic_stress = elastic_modulus .* elastic_strain

n_luders = 40
luders_strain = collect(range(yield_strain, luders_end_strain; length=n_luders))
luders_serration = (rand(n_luders) .- 0.5) .* 6.0
luders_stress = fill(yield_stress, n_luders) .+ luders_serration
luders_stress[1] = yield_stress
luders_stress[end] = yield_stress

n_hardening = 100
hardening_strain = collect(range(luders_end_strain, uts_strain; length=n_hardening))
hardening_progress = (hardening_strain .- luders_end_strain) ./ (uts_strain - luders_end_strain)
hardening_stress = yield_stress .+ (uts_stress - yield_stress) .* hardening_progress .^ 0.55

n_necking = 50
necking_strain = collect(range(uts_strain, fracture_strain; length=n_necking))
necking_progress = (necking_strain .- uts_strain) ./ (fracture_strain - uts_strain)
necking_stress = uts_stress .- (uts_stress - fracture_stress) .* necking_progress .^ 1.4

strain = vcat(elastic_strain, luders_strain[2:end], hardening_strain[2:end], necking_strain[2:end])
stress = vcat(elastic_stress, luders_stress[2:end], hardening_stress[2:end], necking_stress[2:end])

# 0.2% offset construction line — parallel to the elastic slope, shifted by 0.002 strain
offset = 0.002
offset_strain_end = offset + (yield_stress * 1.15) / elastic_modulus
offset_line_strain = [offset, offset_strain_end]
offset_line_stress = elastic_modulus .* (offset_line_strain .- offset)
yield_point_strain = offset + yield_stress / elastic_modulus
yield_point_stress = yield_stress

# Bounds of the elastic-region inset (zoomed view of the near-vertical rise)
zoom_x_max = offset_strain_end * 1.3
zoom_y_max = yield_stress * 1.2

# --- Title (scale fontsize to length; 67-char baseline) -----------------------
title_str = "Mild Steel Tensile Test · line-stress-strain · julia · makie · anyplot.ai"
title_ratio = length(title_str) > 67 ? 67 / length(title_str) : 1.0
title_fontsize = round(Int, 20 * title_ratio)

# --- Plot ----------------------------------------------------------------------
fig = Figure(size=(1600, 900), fontsize=14, backgroundcolor=PAGE_BG)

ax = Axis(
    fig[1, 1];
    title = title_str,
    titlesize = title_fontsize,
    titlecolor = INK,
    xlabel = "Engineering Strain",
    ylabel = "Engineering Stress (MPa)",
    xlabelsize = 16,
    ylabelsize = 16,
    xlabelcolor = INK,
    ylabelcolor = INK,
    xticklabelsize = 13,
    yticklabelsize = 13,
    xticklabelcolor = INK_SOFT,
    yticklabelcolor = INK_SOFT,
    xtickcolor = INK_SOFT,
    ytickcolor = INK_SOFT,
    backgroundcolor = PAGE_BG,
    topspinevisible = false,
    rightspinevisible = false,
    leftspinecolor = INK_SOFT,
    bottomspinecolor = INK_SOFT,
    xgridvisible = false,
    ygridcolor = RGBAf(INK.r, INK.g, INK.b, 0.15),
    yminorgridvisible = false,
)

xlims!(ax, -0.01, fracture_strain * 1.1)
ylims!(ax, 0, uts_stress * 1.28)

# Region bands — loading (elastic + strain hardening, brand tint) vs.
# necking (semantic red tint, foreshadowing fracture). The elastic segment
# is too narrow in strain to shade on its own (it is a near-vertical rise),
# so it is called out with the "Elastic" text label below instead.
vspan!(ax, 0.0, uts_strain; color=(IMPRINT_PALETTE[1], 0.05))
vspan!(ax, uts_strain, fracture_strain; color=(IMPRINT_PALETTE[5], 0.06))

label_y = uts_stress * 1.2
text!(ax, yield_strain + 0.008, label_y; text="Elastic",
      color=INK_MUTED, fontsize=14, align=(:left, :center))
text!(ax, (luders_end_strain + uts_strain) / 2, label_y; text="Plastic (strain hardening)",
      color=INK_MUTED, fontsize=14, align=(:center, :center))
text!(ax, (uts_strain + fracture_strain) / 2, label_y; text="Necking",
      color=INK_MUTED, fontsize=14, align=(:center, :center))

# 0.2% offset construction line
lines!(ax, offset_line_strain, offset_line_stress; color=INK_SOFT, linewidth=2, linestyle=:dash)

# Stress-strain curve — first (and only) series, always Imprint position 1
lines!(ax, strain, stress; color=BRAND, linewidth=3.5)

# Dotted marker box around the elastic region, linking it to the zoomed inset below
lines!(ax, [0.0, zoom_x_max, zoom_x_max, 0.0, 0.0], [0.0, 0.0, zoom_y_max, zoom_y_max, 0.0];
       color=INK_SOFT, linewidth=1, linestyle=:dot)

# Critical points — labels pulled well clear of the crowded origin cluster.
# Each leader drops straight down from its marker (staying at constant strain,
# so it never cuts diagonally across the near-flat Luders plateau) before
# stepping right into open space below the curve for the label text.
scatter!(ax, [yield_point_strain], [yield_point_stress];
         color=ANYPLOT_AMBER, markersize=22, strokewidth=2, strokecolor=PAGE_BG)
yield_leader_y = 130.0
lines!(ax, [yield_point_strain, yield_point_strain], [yield_point_stress, yield_leader_y];
       color=INK_SOFT, linewidth=1)
text!(ax, yield_point_strain + 0.006, yield_leader_y; text="Yield point\n(0.2% offset)",
      color=INK, fontsize=13, align=(:left, :center))

offset_leader_y = 205.0
lines!(ax, [offset_strain_end, offset_strain_end], [offset_line_stress[end], offset_leader_y];
       color=INK_SOFT, linewidth=1)
text!(ax, offset_strain_end + 0.006, offset_leader_y; text="0.2% offset\nconstruction line",
      color=INK_SOFT, fontsize=13, align=(:left, :center))

scatter!(ax, [uts_strain], [uts_stress];
         color=IMPRINT_PALETTE[3], markersize=22, strokewidth=2, strokecolor=PAGE_BG)
text!(ax, uts_strain, uts_stress + 16; text="UTS",
      color=INK, fontsize=13, align=(:center, :bottom))

scatter!(ax, [fracture_strain], [fracture_stress];
         color=IMPRINT_PALETTE[5], markersize=24, marker=:xcross, strokewidth=3)
text!(ax, fracture_strain, fracture_stress - 26; text="Fracture",
      color=INK, fontsize=13, align=(:right, :top))

# --- Elastic-region inset: makes the near-vertical modulus slope genuinely
# visible instead of just annotated in text (addresses DE-03 review feedback).
# Occupies the bottom-right of the main axis, where the curve never reaches.
inset_ax = Axis(
    fig[1, 1];
    width = Relative(0.30),
    height = Relative(0.36),
    halign = 0.97,
    valign = 0.07,
    backgroundcolor = PAGE_BG,
    title = "Elastic region (zoomed)",
    titlesize = 12,
    titlecolor = INK_SOFT,
    xlabel = "Strain",
    ylabel = "Stress (MPa)",
    xlabelsize = 10,
    ylabelsize = 10,
    xlabelcolor = INK_SOFT,
    ylabelcolor = INK_SOFT,
    xticklabelsize = 9,
    yticklabelsize = 9,
    xticklabelcolor = INK_SOFT,
    yticklabelcolor = INK_SOFT,
    xtickcolor = INK_SOFT,
    ytickcolor = INK_SOFT,
    topspinevisible = true,
    rightspinevisible = true,
    topspinecolor = INK_SOFT,
    rightspinecolor = INK_SOFT,
    leftspinecolor = INK_SOFT,
    bottomspinecolor = INK_SOFT,
    xgridvisible = false,
    ygridvisible = false,
)

zoom_mask = strain .<= zoom_x_max
lines!(inset_ax, strain[zoom_mask], stress[zoom_mask]; color=BRAND, linewidth=2.5)
lines!(inset_ax, offset_line_strain, offset_line_stress; color=INK_SOFT, linewidth=1.5, linestyle=:dash)
scatter!(inset_ax, [yield_point_strain], [yield_point_stress];
         color=ANYPLOT_AMBER, markersize=14, strokewidth=1.5, strokecolor=PAGE_BG)
text!(inset_ax, zoom_x_max * 0.08, zoom_y_max * 0.62; text="E ≈ 200 GPa",
      color=INK, fontsize=11, align=(:left, :center))

xlims!(inset_ax, 0, zoom_x_max)
ylims!(inset_ax, 0, zoom_y_max)

# --- Save ------------------------------------------------------------------
save("plot-$(THEME).png", fig; px_per_unit=2)
Runnable source as JSON, for any HTTP client: https://api.anyplot.ai/specs/line-stress-strain/makie/code. Any spec id and library id listed in llms-full.txt fit the same URL shape; every URL below is complete and callable.
{
  "spec_id": "line-stress-strain",
  "language": "julia",
  "library": "makie",
  "page": "https://anyplot.ai/line-stress-strain/julia/makie",
  "hub": "https://anyplot.ai/line-stress-strain",
  "code_json": "https://api.anyplot.ai/specs/line-stress-strain/makie/code",
  "spec_json": "https://api.anyplot.ai/specs/line-stress-strain",
  "render_light_png": "https://storage.googleapis.com/anyplot-images/plots/line-stress-strain/julia/makie/plot-light.png",
  "render_dark_png": "https://storage.googleapis.com/anyplot-images/plots/line-stress-strain/julia/makie/plot-dark.png",
  "quality_score": 94.0,
  "license": "MIT",
  "guide": "https://anyplot.ai/llms.txt"
}
Part of Engineering Stress-Strain Curve on anyplot.ai.