The same plot in 14 other libraries — JavaScript: Chart.js, D3.js, Highcharts, MUI X Charts; Python: Altair, Bokeh, lets-plot, Matplotlib, Plotly, plotnine, Pygal, Seaborn; R: ggplot2; Julia: Makie.jl. Compare all 15 side by side: Engineering Stress-Strain Curve in Python, R, Julia and JavaScript.
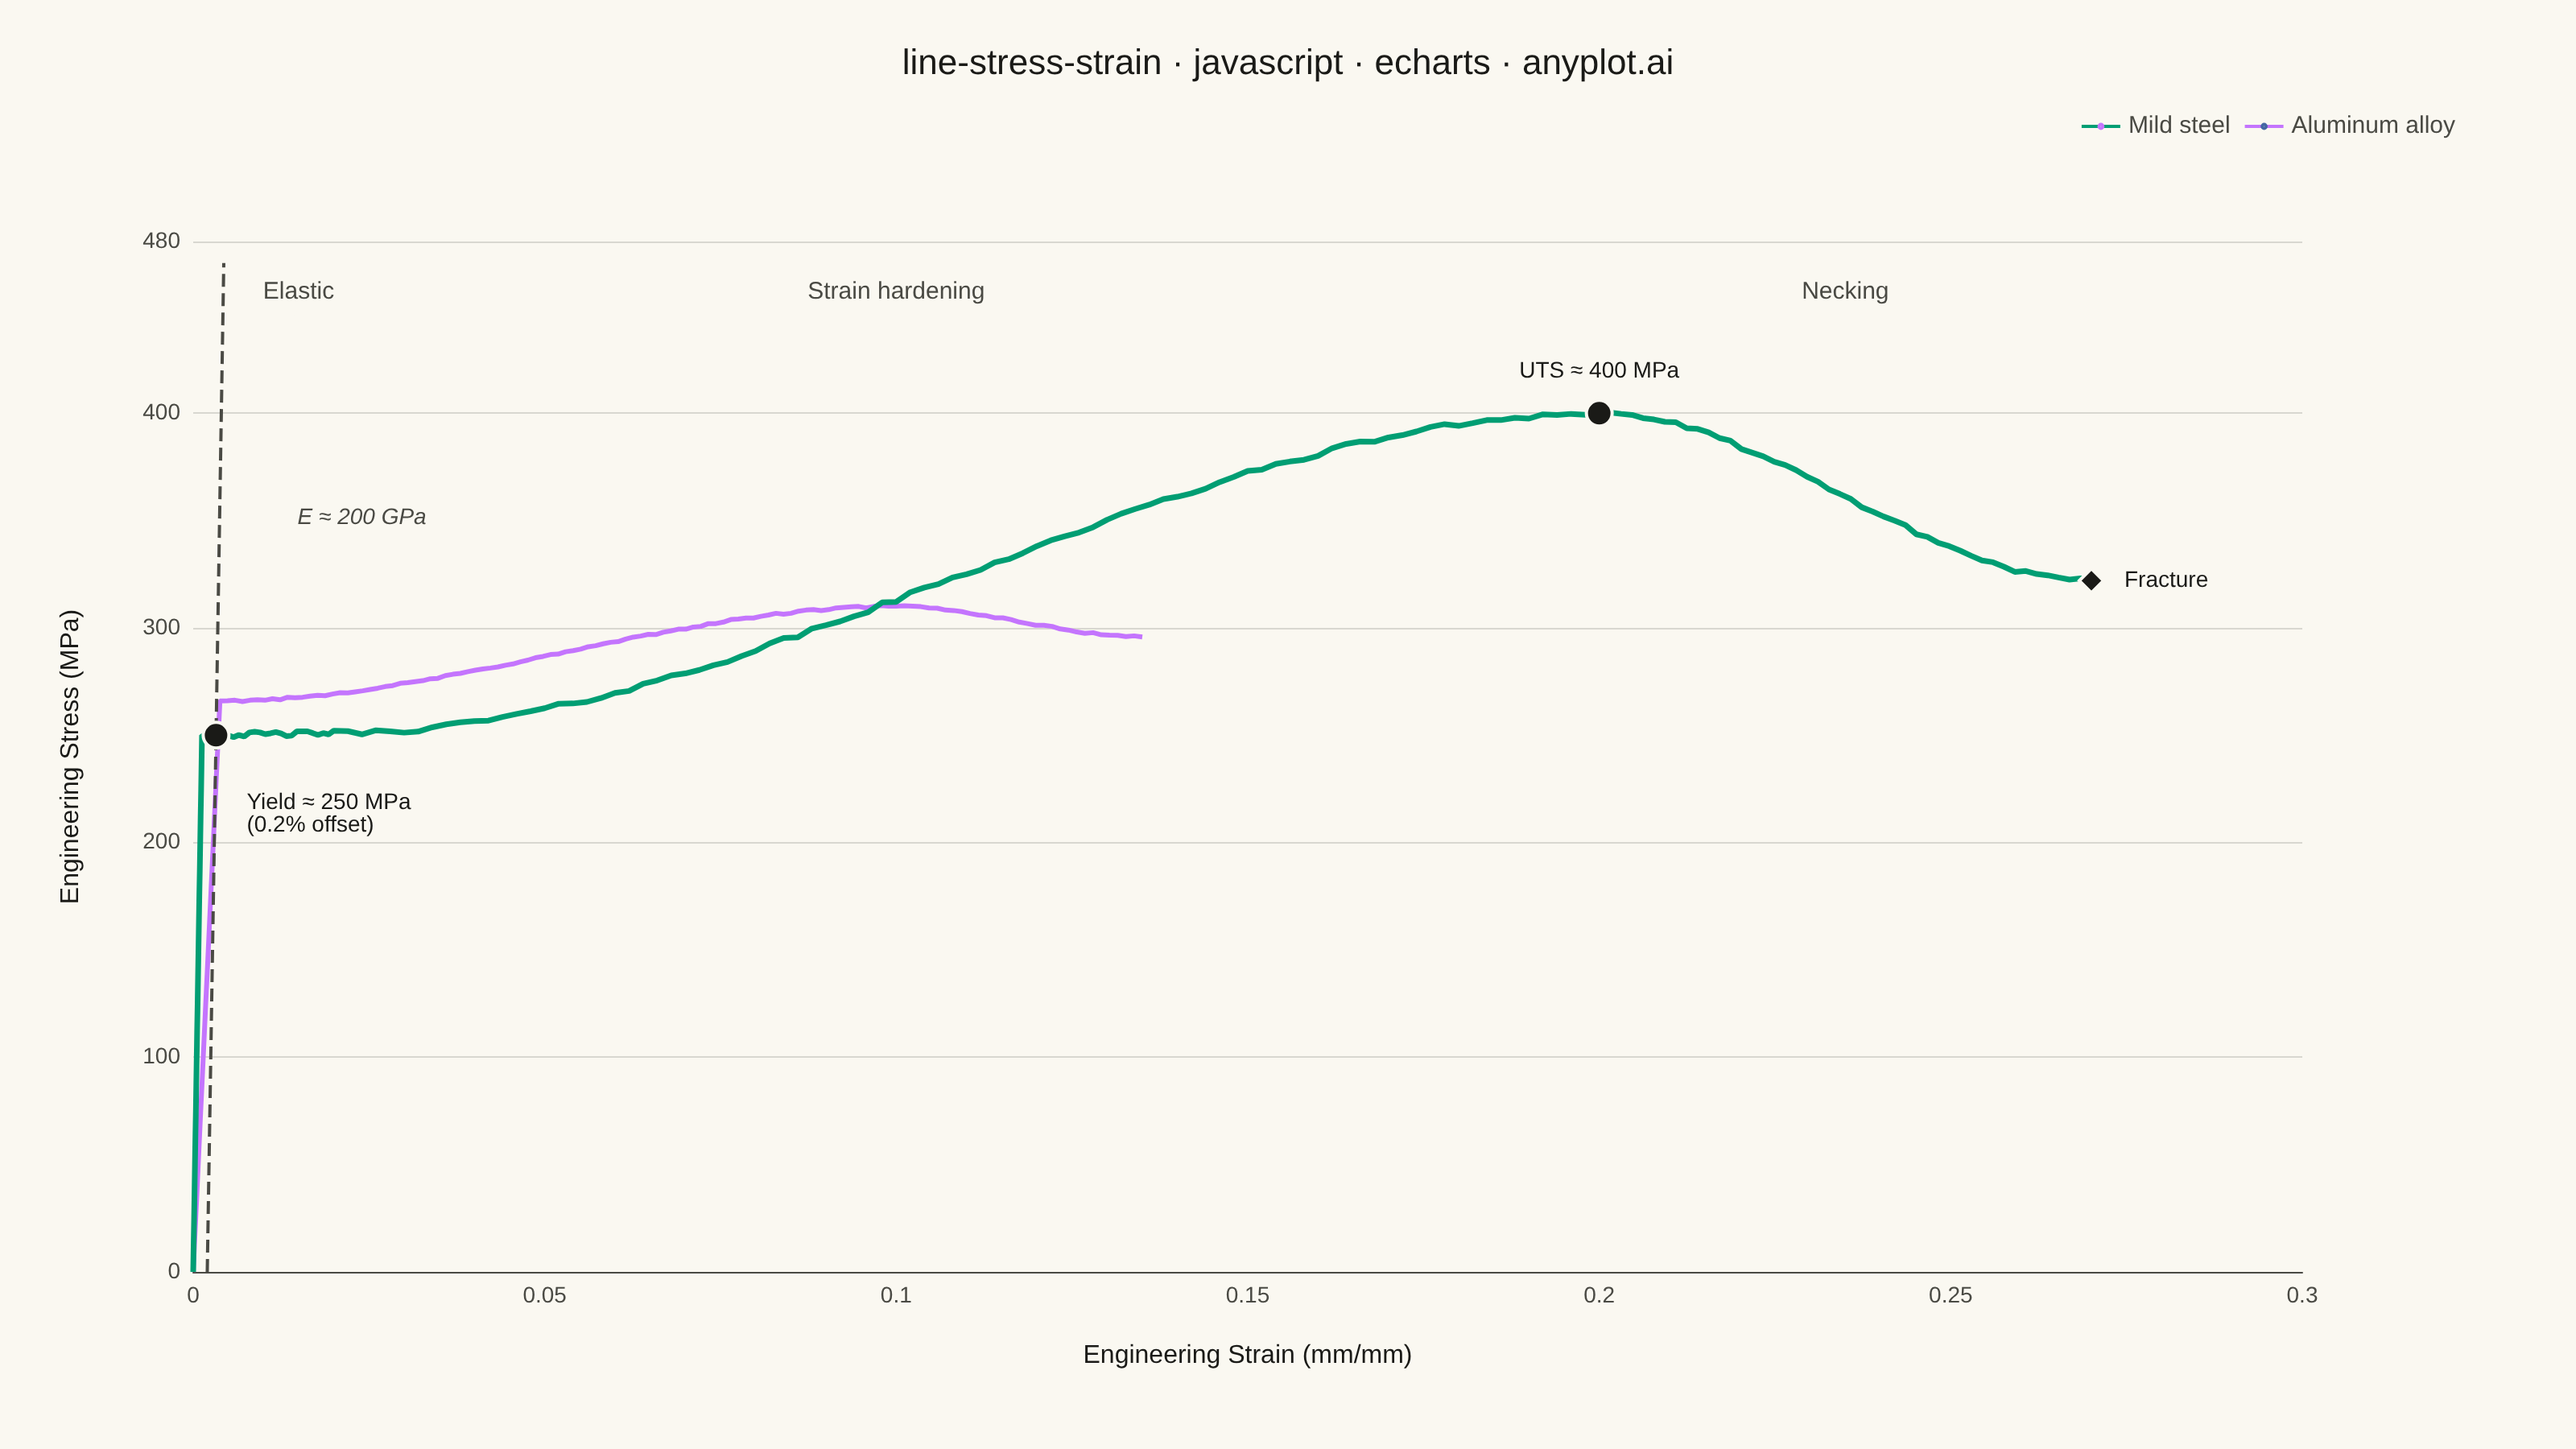
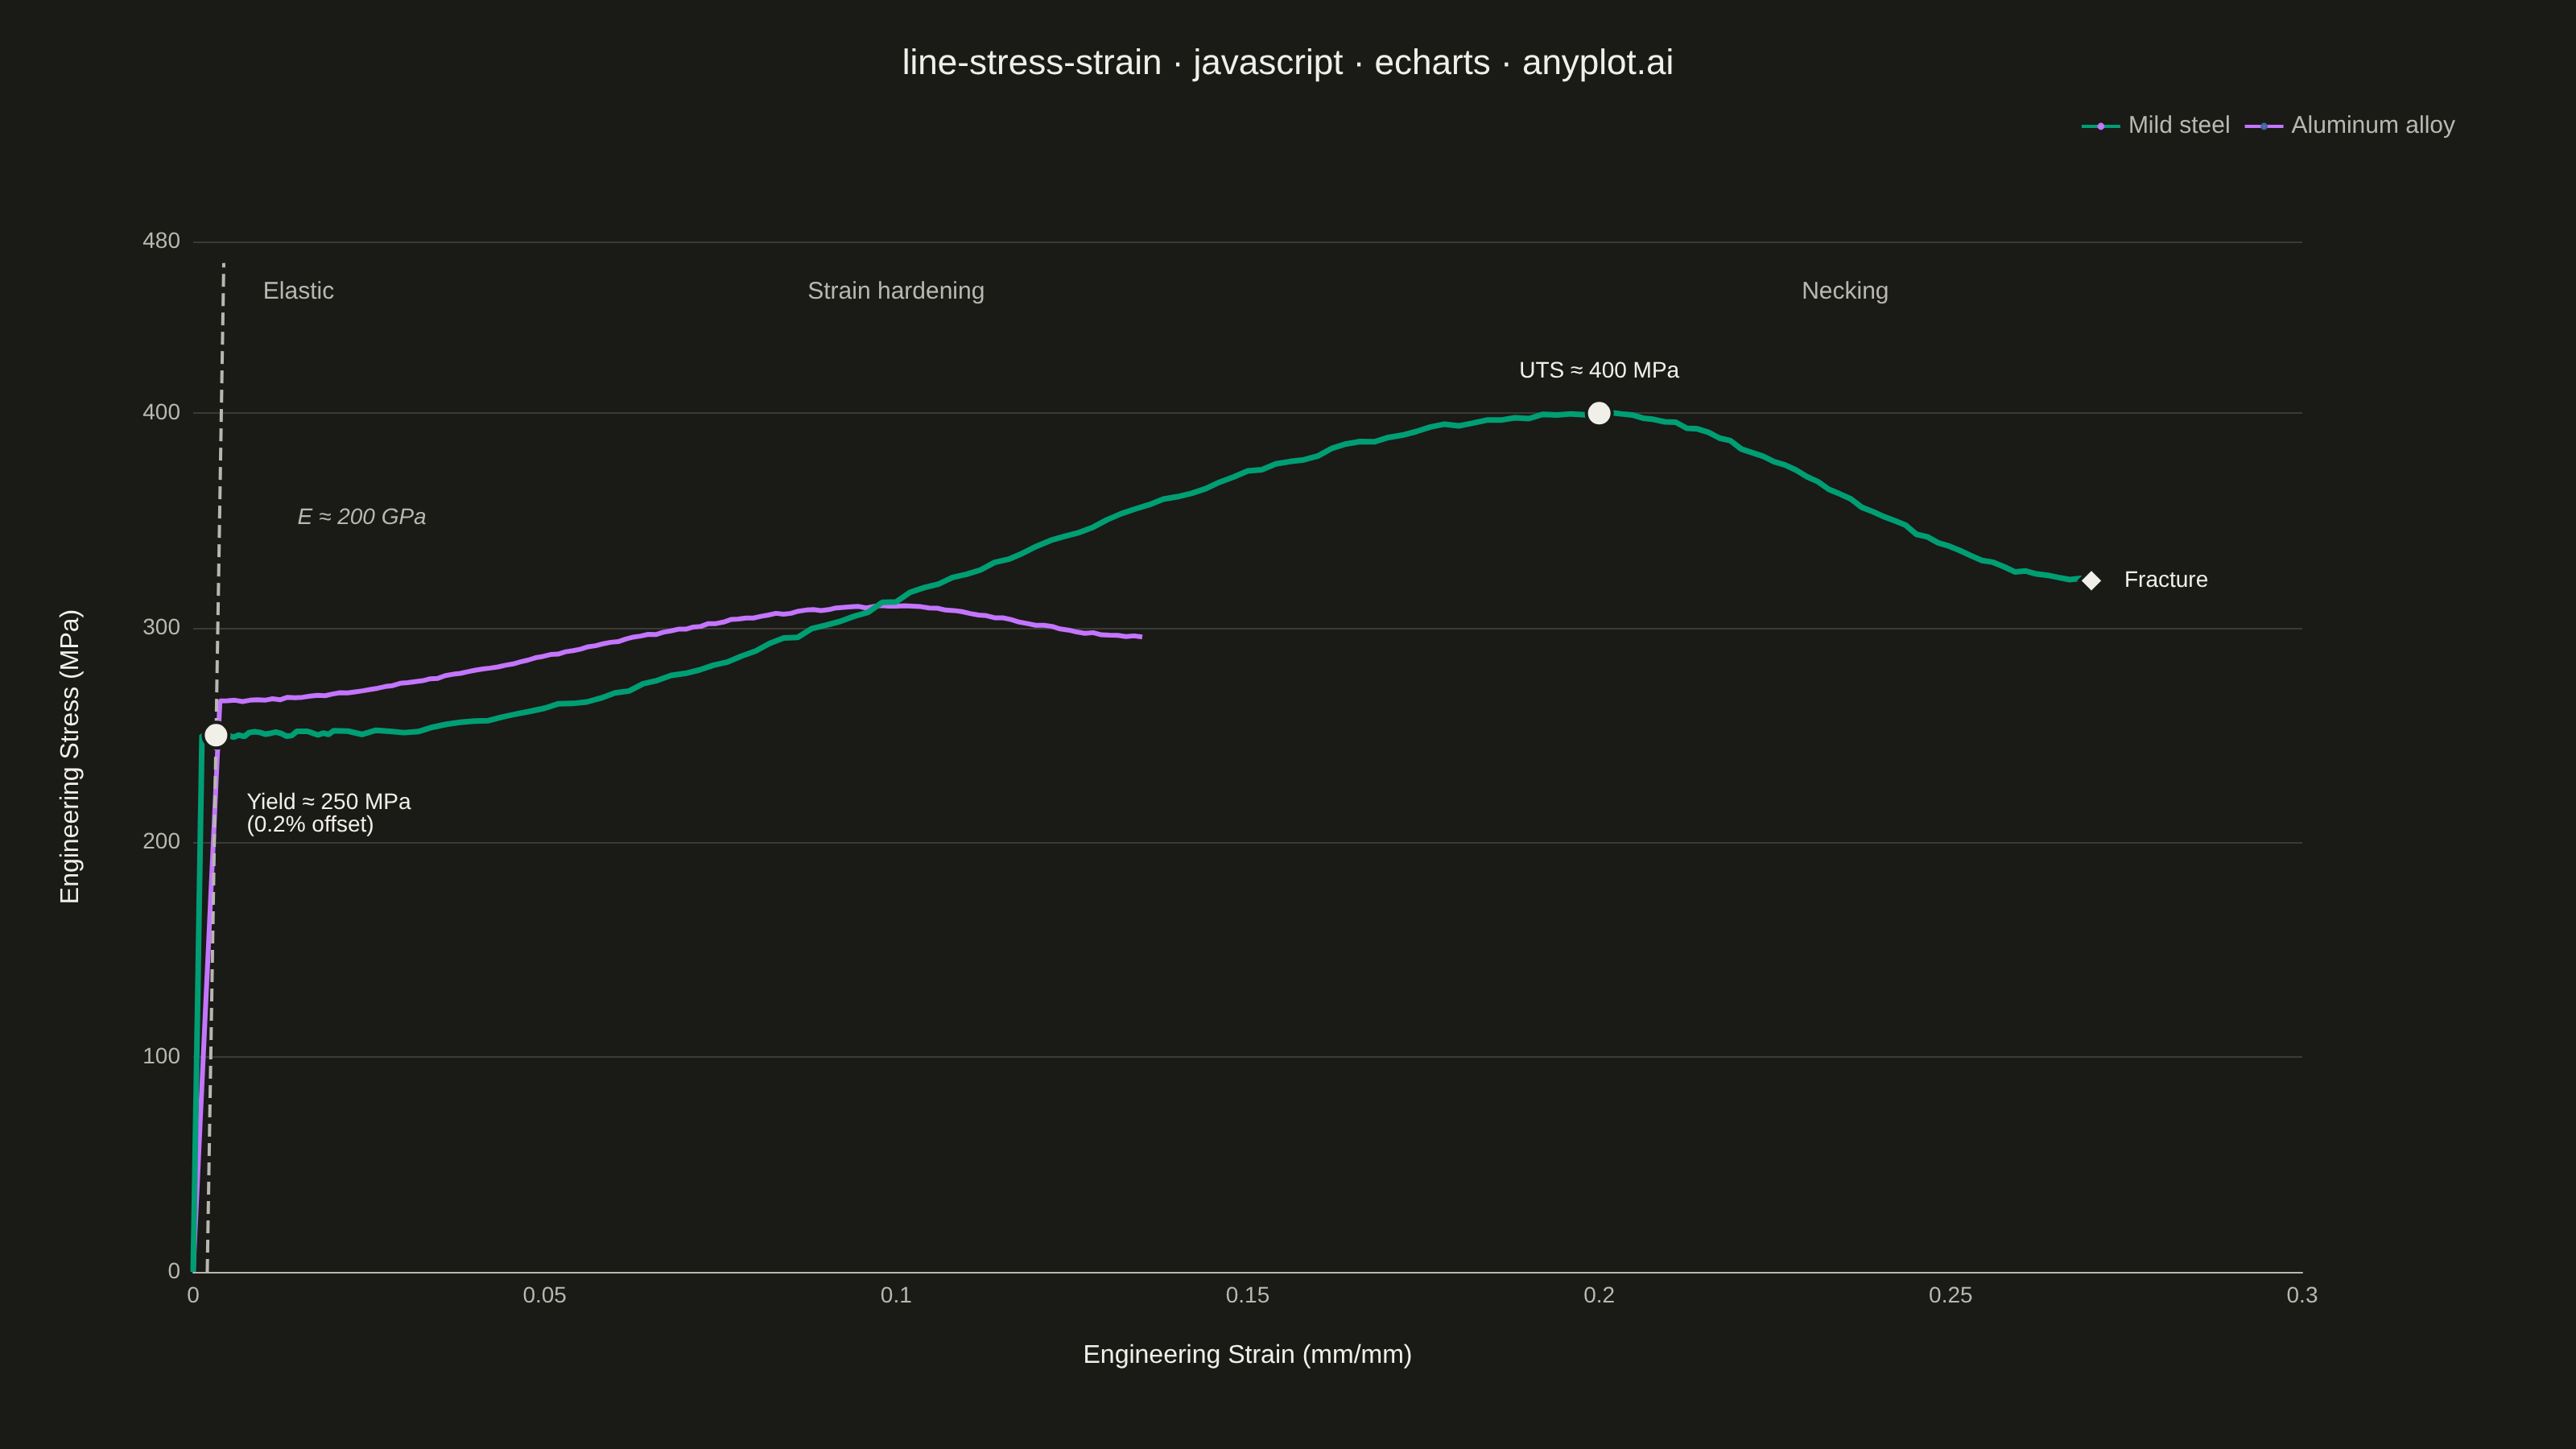
An engineering stress-strain curve visualizes the relationship between applied stress (MPa) and resulting strain (dimensionless) in a material under uniaxial tensile loading. The curve reveals distinct mechanical behavior regions — elastic deformation, yielding, strain hardening, and necking — culminating in fracture. It is the foundational plot for characterizing material mechanical properties and comparing material performance.
// anyplot.ai
// line-stress-strain: Engineering Stress-Strain Curve
// Library: echarts 6.1.0 | JavaScript 22.23.2
// Quality: 91/100 | Created: 2026-08-24

const t = window.ANYPLOT_TOKENS;

// --- Deterministic noise (small-amplitude, fixed-seed LCG) ------------------
function lcg(seed) {
  let state = seed >>> 0;
  return function () {
    state = (1664525 * state + 1013904223) >>> 0;
    return state / 4294967296;
  };
}
const rand = lcg(42);

// --- Piecewise stress-strain curve builder -----------------------------------
// `knots` are [strain, stress] control points; `segments[i]` describes the leg
// between knots[i] and knots[i+1]: point count, whether to ease the stress
// interpolation (smoothstep, for a rounded knee/plateau/necking shape) or keep
// it linear (Hooke's law elastic region), and noise amplitude in MPa.
function buildCurve(knots, segments) {
  const strain = [];
  const stress = [];
  for (let s = 0; s < segments.length; s++) {
    const [x0, y0] = knots[s];
    const [x1, y1] = knots[s + 1];
    const { n, eased, noise } = segments[s];
    const start = s === 0 ? 0 : 1;
    for (let i = start; i <= n; i++) {
      const tt = i / n;
      const et = eased ? tt * tt * (3 - 2 * tt) : tt;
      const strainVal = x0 + (x1 - x0) * tt;
      let stressVal = y0 + (y1 - y0) * et;
      if (noise) stressVal += (rand() - 0.5) * noise;
      strain.push(Number(strainVal.toFixed(5)));
      stress.push(Number(stressVal.toFixed(1)));
    }
  }
  return strain.map((s, i) => [s, stress[i]]);
}

// --- Mild steel: sharp yield point + Luders plateau + hardening + necking ---
const STEEL_E = 200000; // MPa (Young's modulus, ~200 GPa)
const STEEL_YIELD_STRAIN = 0.00125;
const STEEL_YIELD_STRESS = STEEL_E * STEEL_YIELD_STRAIN; // 250 MPa
const STEEL_UTS_STRAIN = 0.2;
const STEEL_UTS_STRESS = 400;
const STEEL_FRACTURE_STRAIN = 0.27;
const STEEL_FRACTURE_STRESS = 322;

const steelCurve = buildCurve(
  [
    [0, 0],
    [STEEL_YIELD_STRAIN, STEEL_YIELD_STRESS],
    [0.02, 251],
    [STEEL_UTS_STRAIN, STEEL_UTS_STRESS],
    [STEEL_FRACTURE_STRAIN, STEEL_FRACTURE_STRESS],
  ],
  [
    { n: 20, eased: false, noise: 0 }, // elastic (Hooke's law, no noise)
    { n: 25, eased: false, noise: 2.5 }, // Luders plateau (serrated yielding)
    { n: 90, eased: true, noise: 2.5 }, // strain hardening
    { n: 45, eased: true, noise: 2 }, // necking to fracture
  ],
);

// --- Aluminum alloy: gradual rounded knee, lower ductility, comparison series
const AL_E = 70000; // MPa (Young's modulus, ~70 GPa)
const AL_KNEE_STRAIN = 0.0038;
const AL_KNEE_STRESS = AL_E * AL_KNEE_STRAIN;
const AL_UTS_STRAIN = 0.1;
const AL_UTS_STRESS = 310;
const AL_FRACTURE_STRAIN = 0.135;
const AL_FRACTURE_STRESS = 296;

const aluminumCurve = buildCurve(
  [
    [0, 0],
    [AL_KNEE_STRAIN, AL_KNEE_STRESS],
    [AL_UTS_STRAIN, AL_UTS_STRESS],
    [AL_FRACTURE_STRAIN, AL_FRACTURE_STRESS],
  ],
  [
    { n: 15, eased: false, noise: 0 }, // elastic (Hooke's law, no noise)
    { n: 90, eased: true, noise: 1 }, // rounded knee into gradual hardening
    { n: 30, eased: true, noise: 1 }, // necking to fracture
  ],
);

// --- 0.2% offset construction line: parallel to the elastic modulus slope,
// shifted 0.002 strain — its intersection with the curve is the offset yield
// point. For steel's flat plateau, that intersection sits at ~250 MPa.
const offsetIntersectionStrain = 0.002 + STEEL_YIELD_STRESS / STEEL_E;
const offsetLineEndStrain = offsetIntersectionStrain + 0.0011;
const offsetLine = [
  [0.002, 0],
  [offsetLineEndStrain, STEEL_E * (offsetLineEndStrain - 0.002)],
];

// --- Init ---------------------------------------------------------------------
const chart = echarts.init(document.getElementById("container"));

// --- Option ---------------------------------------------------------------
chart.setOption({
  animation: false,
  color: t.palette,
  backgroundColor: "transparent",
  title: {
    text: "line-stress-strain · javascript · echarts · anyplot.ai",
    left: "center",
    top: 24,
    textStyle: { color: t.ink, fontSize: 22, fontWeight: 500 },
  },
  legend: {
    data: ["Mild steel", "Aluminum alloy"],
    top: 66,
    right: 70,
    textStyle: { color: t.inkSoft, fontSize: 15 },
    itemWidth: 24,
    itemHeight: 3,
  },
  grid: { left: 120, right: 170, top: 150, bottom: 110 },
  xAxis: {
    type: "value",
    name: "Engineering Strain (mm/mm)",
    nameLocation: "middle",
    nameGap: 44,
    min: 0,
    max: 0.3,
    nameTextStyle: { color: t.ink, fontSize: 16 },
    axisLabel: { color: t.inkSoft, fontSize: 14 },
    axisLine: { lineStyle: { color: t.inkSoft } },
    axisTick: { show: false },
    splitLine: { show: false },
  },
  yAxis: {
    type: "value",
    name: "Engineering Stress (MPa)",
    nameLocation: "middle",
    nameGap: 68,
    min: 0,
    max: 480,
    nameTextStyle: { color: t.ink, fontSize: 16 },
    axisLabel: { color: t.inkSoft, fontSize: 14 },
    axisLine: { show: false },
    axisTick: { show: false },
    splitLine: { lineStyle: { color: t.grid } },
  },
  series: [
    {
      name: "0.2% Offset",
      type: "line",
      data: offsetLine,
      showSymbol: false,
      silent: true,
      lineStyle: { color: t.inkSoft, width: 2, type: "dashed" },
      z: 2,
    },
    {
      name: "Mild steel",
      type: "line",
      data: steelCurve,
      showSymbol: false,
      smooth: false,
      lineStyle: { color: t.palette[0], width: 3.5 },
      z: 3,
      markPoint: {
        symbolSize: 16,
        itemStyle: { color: t.ink, borderColor: t.pageBg, borderWidth: 2 },
        label: { color: t.ink, fontSize: 14, fontWeight: 500 },
        data: [
          {
            name: "Yield",
            coord: [offsetIntersectionStrain, STEEL_YIELD_STRESS],
            symbol: "circle",
            label: {
              formatter: "Yield ≈ 250 MPa\n(0.2% offset)",
              position: [28, 44],
            },
          },
          {
            name: "UTS",
            coord: [STEEL_UTS_STRAIN, STEEL_UTS_STRESS],
            symbol: "circle",
            label: {
              formatter: `UTS ≈ ${STEEL_UTS_STRESS} MPa`,
              position: "top",
              distance: 10,
            },
          },
          {
            name: "Fracture",
            coord: [STEEL_FRACTURE_STRAIN, STEEL_FRACTURE_STRESS],
            symbol: "diamond",
            symbolSize: 15,
            label: {
              formatter: "Fracture",
              position: "right",
              distance: 12,
            },
          },
          {
            name: "Modulus label",
            coord: [0.024, 340],
            symbol: "circle",
            symbolSize: 4,
            itemStyle: { color: t.pageBg, borderColor: t.pageBg },
            label: {
              show: true,
              formatter: "E ≈ 200 GPa",
              color: t.inkSoft,
              fontSize: 14,
              fontStyle: "italic",
              position: "top",
            },
          },
          {
            name: "Elastic phase",
            coord: [0.015, 445],
            symbol: "circle",
            symbolSize: 4,
            itemStyle: { color: t.pageBg, borderColor: t.pageBg },
            label: {
              show: true,
              formatter: "Elastic",
              color: t.inkSoft,
              fontSize: 15,
              fontWeight: 500,
              position: "top",
            },
          },
          {
            name: "Hardening phase",
            coord: [0.1, 445],
            symbol: "circle",
            symbolSize: 4,
            itemStyle: { color: t.pageBg, borderColor: t.pageBg },
            label: {
              show: true,
              formatter: "Strain hardening",
              color: t.inkSoft,
              fontSize: 15,
              fontWeight: 500,
              position: "top",
            },
          },
          {
            name: "Necking phase",
            coord: [0.235, 445],
            symbol: "circle",
            symbolSize: 4,
            itemStyle: { color: t.pageBg, borderColor: t.pageBg },
            label: {
              show: true,
              formatter: "Necking",
              color: t.inkSoft,
              fontSize: 15,
              fontWeight: 500,
              position: "top",
            },
          },
        ],
      },
    },
    {
      name: "Aluminum alloy",
      type: "line",
      data: aluminumCurve,
      showSymbol: false,
      smooth: false,
      lineStyle: { color: t.palette[1], width: 3 },
      z: 1,
    },
  ],
});
Runnable source as JSON, for any HTTP client: https://api.anyplot.ai/specs/line-stress-strain/echarts/code. Any spec id and library id listed in llms-full.txt fit the same URL shape; every URL below is complete and callable.
{
  "spec_id": "line-stress-strain",
  "language": "javascript",
  "library": "echarts",
  "page": "https://anyplot.ai/line-stress-strain/javascript/echarts",
  "hub": "https://anyplot.ai/line-stress-strain",
  "code_json": "https://api.anyplot.ai/specs/line-stress-strain/echarts/code",
  "spec_json": "https://api.anyplot.ai/specs/line-stress-strain",
  "render_light_png": "https://storage.googleapis.com/anyplot-images/plots/line-stress-strain/javascript/echarts/plot-light.png",
  "render_dark_png": "https://storage.googleapis.com/anyplot-images/plots/line-stress-strain/javascript/echarts/plot-dark.png",
  "interactive_light_html": "https://storage.googleapis.com/anyplot-images/plots/line-stress-strain/javascript/echarts/plot-light.html",
  "interactive_dark_html": "https://storage.googleapis.com/anyplot-images/plots/line-stress-strain/javascript/echarts/plot-dark.html",
  "quality_score": 91.0,
  "license": "MIT",
  "guide": "https://anyplot.ai/llms.txt"
}
Part of Engineering Stress-Strain Curve on anyplot.ai.