The same plot in 14 other libraries — JavaScript: Chart.js, D3.js, Apache ECharts, Highcharts; Python: Altair, Bokeh, lets-plot, Matplotlib, Plotly, plotnine, Pygal, Seaborn; R: ggplot2; Julia: Makie.jl. Compare all 15 side by side: Engineering Stress-Strain Curve in Python, R, Julia and JavaScript.
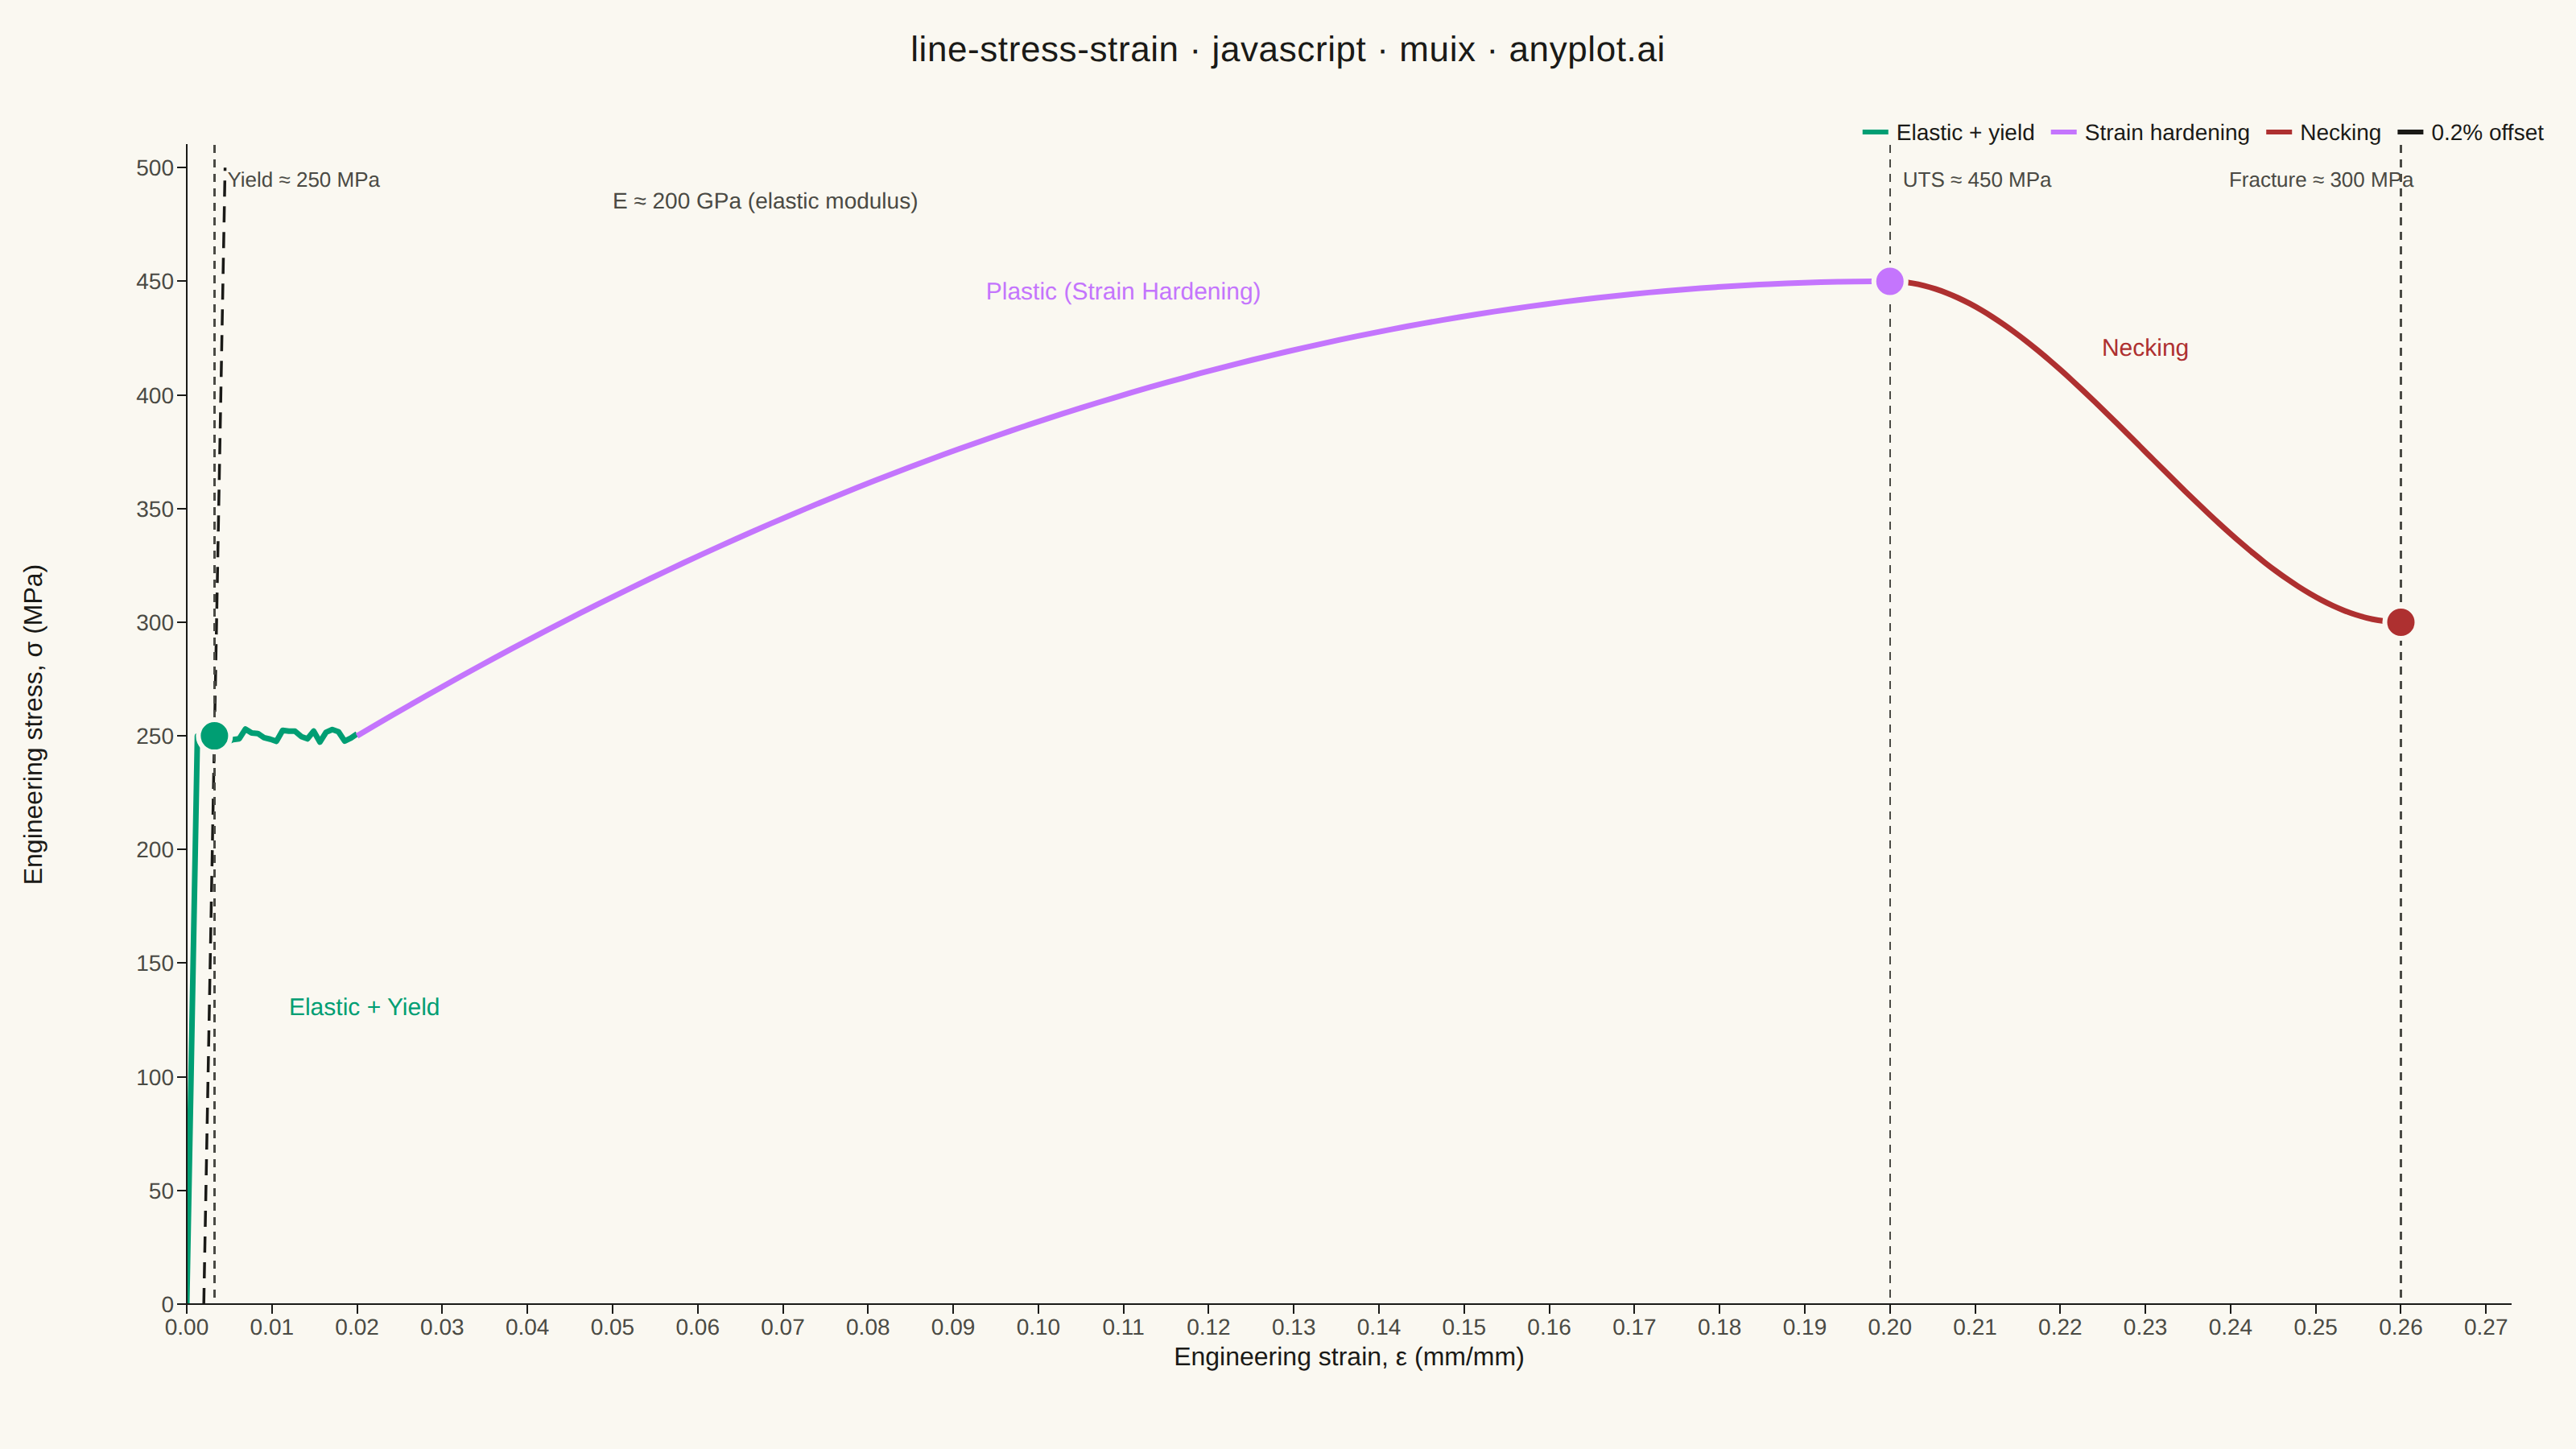
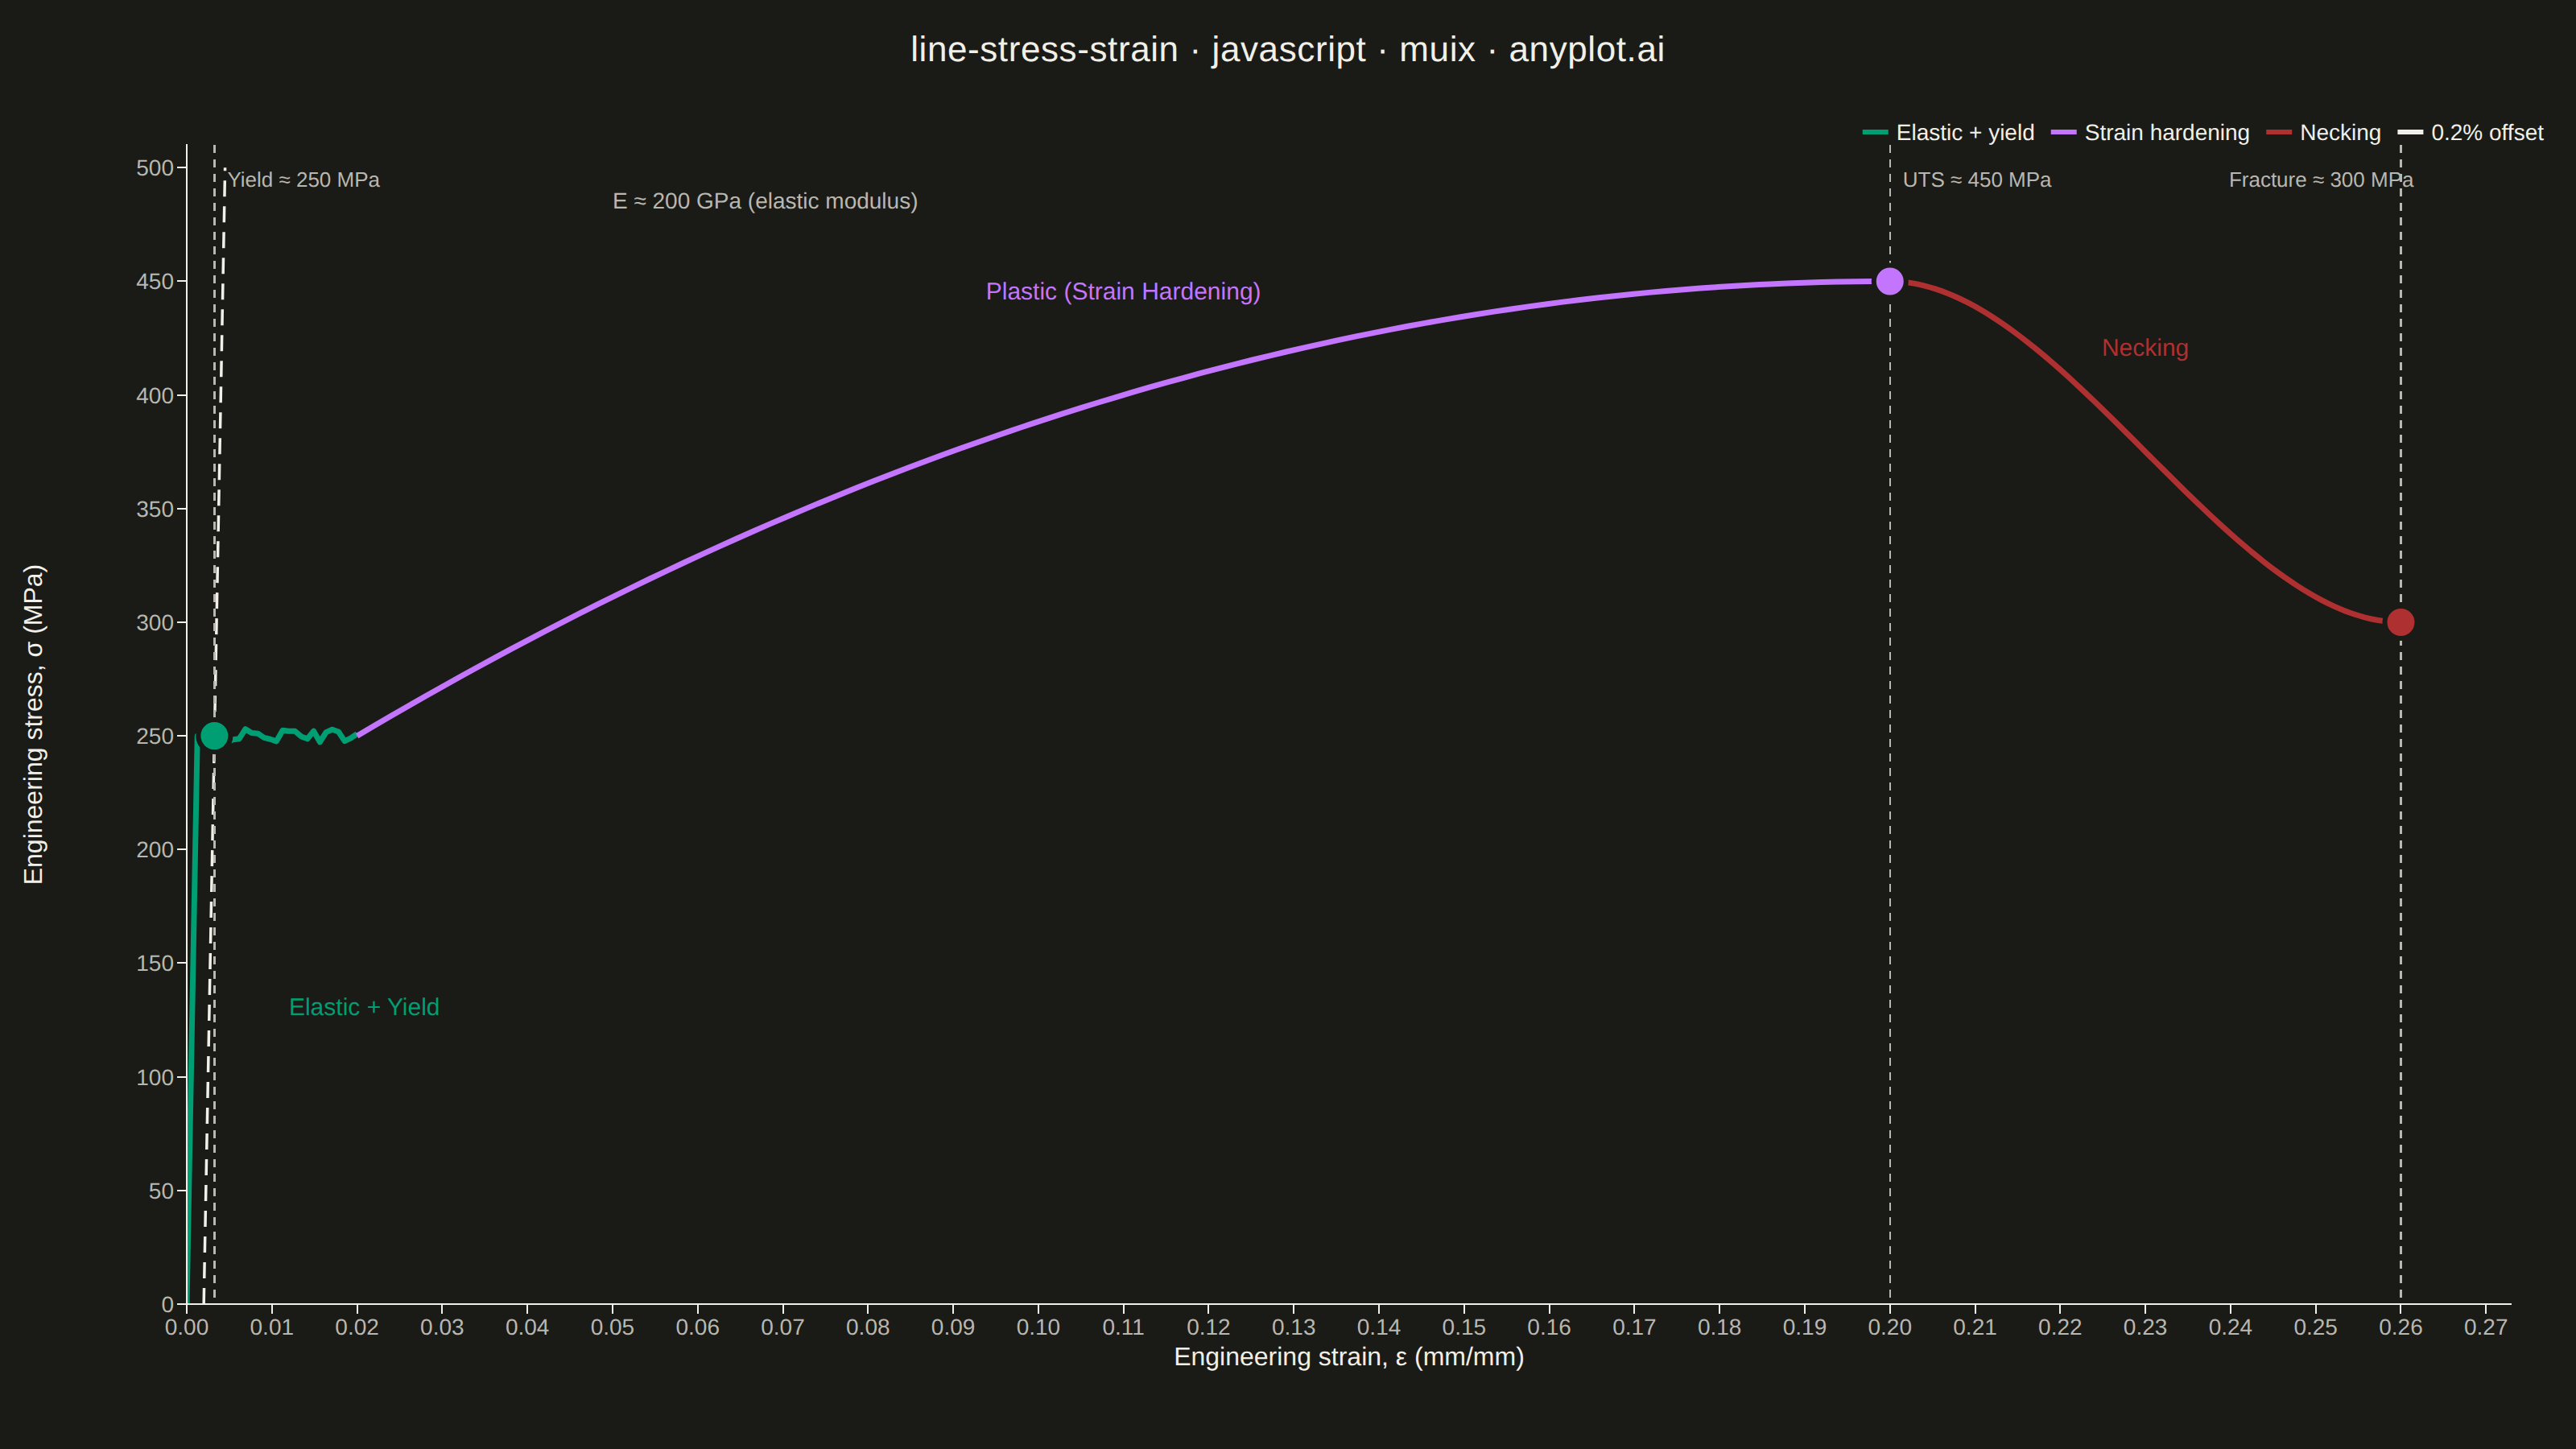
An engineering stress-strain curve visualizes the relationship between applied stress (MPa) and resulting strain (dimensionless) in a material under uniaxial tensile loading. The curve reveals distinct mechanical behavior regions — elastic deformation, yielding, strain hardening, and necking — culminating in fracture. It is the foundational plot for characterizing material mechanical properties and comparing material performance.
// anyplot.ai
// line-stress-strain: Engineering Stress-Strain Curve
// Library: muix 7.29.1 | JavaScript 22.23.2
// Quality: 88/100 | Created: 2026-08-24
import { LineChart } from "@mui/x-charts/LineChart";
import { ChartsReferenceLine } from "@mui/x-charts/ChartsReferenceLine";
import { ChartsText } from "@mui/x-charts/ChartsText";
import { useXScale, useYScale, useDrawingArea } from "@mui/x-charts/hooks";
import Box from "@mui/material/Box";
import Typography from "@mui/material/Typography";

const t = window.ANYPLOT_TOKENS;

// --- Material model: mild-steel tensile test (deterministic) ---------------
const E = 200000; // Young's modulus, MPa
const OFFSET = 0.002; // 0.2% strain offset for yield determination
const YIELD_STRESS = 250; // MPa, yield-plateau stress
const ELASTIC_END = YIELD_STRESS / E; // proportional limit, ≈ 0.00125
const YIELD_STRAIN = OFFSET + YIELD_STRESS / E; // where the offset line meets the plateau, ≈ 0.00325
const PLATEAU_END = 0.02; // Lüders strain — plateau gives way to strain hardening
const UTS_STRAIN = 0.2;
const UTS_STRESS = 450;
const FRACTURE_STRAIN = 0.26;
const FRACTURE_STRESS = 300;
const OFFSET_EXIT_STRAIN = OFFSET + (UTS_STRESS + 50) / E; // where the offset line exits the plot area
const Y_MAX = UTS_STRESS + 60;

// Small fixed-seed LCG — Lüders-band serration on the yield plateau
let seed = 42;
function rand() {
  seed = (seed * 1103515245 + 12345) & 0x7fffffff;
  return seed / 0x7fffffff;
}

function linspace(a, b, n) {
  const out = [];
  for (let i = 0; i < n; i += 1) out.push(a + ((b - a) * i) / (n - 1));
  return out;
}

// --- Strain samples (170 pts): dense near the elastic/yield transition,
// plus the two 0.2%-offset construction points ------------------------------
const strains = [
  ...linspace(0, ELASTIC_END, 6),
  ...linspace(ELASTIC_END, YIELD_STRAIN, 6).slice(1),
  ...linspace(YIELD_STRAIN, PLATEAU_END, 24).slice(1),
  ...linspace(PLATEAU_END, UTS_STRAIN, 90).slice(1),
  ...linspace(UTS_STRAIN, FRACTURE_STRAIN, 46).slice(1),
  OFFSET,
  OFFSET_EXIT_STRAIN,
].sort((a, b) => a - b);

function stressElasticYield(strain) {
  if (strain <= ELASTIC_END) return (strain / ELASTIC_END) * YIELD_STRESS;
  if (strain <= PLATEAU_END) return YIELD_STRESS + (rand() - 0.5) * 6;
  return null;
}

function stressHardening(strain) {
  if (strain < PLATEAU_END || strain > UTS_STRAIN) return null;
  const frac = (strain - PLATEAU_END) / (UTS_STRAIN - PLATEAU_END);
  return YIELD_STRESS + (UTS_STRESS - YIELD_STRESS) * (2 * frac - frac * frac);
}

function stressNecking(strain) {
  if (strain < UTS_STRAIN || strain > FRACTURE_STRAIN) return null;
  const frac = (strain - UTS_STRAIN) / (FRACTURE_STRAIN - UTS_STRAIN);
  return UTS_STRESS - (UTS_STRESS - FRACTURE_STRESS) * (3 * frac * frac - 2 * frac * frac * frac);
}

function stressOffsetLine(strain) {
  if (strain < OFFSET || strain > OFFSET_EXIT_STRAIN) return null;
  return E * (strain - OFFSET);
}

const dataset = strains.map((strain) => ({
  strain,
  stressElasticYield: stressElasticYield(strain),
  stressHardening: stressHardening(strain),
  stressNecking: stressNecking(strain),
  stressOffset: stressOffsetLine(strain),
}));

// Region-label anchor points, in data coordinates
const HARDENING_LABEL_X = 0.11;
const HARDENING_LABEL_Y = stressHardening(HARDENING_LABEL_X) + 45;
const NECKING_LABEL_X = 0.23;
const NECKING_LABEL_Y = stressNecking(NECKING_LABEL_X) + 45;

// --- Floating annotation text, placed in data coordinates -------------------
function DataLabel({ x, y, text, fill, fontSize = 15, anchor = "middle" }) {
  const xScale = useXScale("strain-axis");
  const yScale = useYScale("stress-axis");
  return (
    <ChartsText
      x={xScale(x)}
      y={yScale(y)}
      text={text}
      fill={fill}
      style={{ fontSize, textAnchor: anchor, dominantBaseline: "middle" }}
    />
  );
}

// Critical-point marker: solid dot with a page-bg edge, drawn above the
// reference lines so it stays visible where a line crosses the curve.
function PointMarker({ x, y, color }) {
  const xScale = useXScale("strain-axis");
  const yScale = useYScale("stress-axis");
  return <circle cx={xScale(x)} cy={yScale(y)} r={10} fill={color} stroke={t.pageBg} strokeWidth={3} />;
}

// Hand-rolled y-axis title, anchored to a fixed distance from the canvas edge
// rather than MUI X's built-in `yAxis.label` (whose offset is derived from
// `tickFontSize`, not the actual rendered width of 3-digit tick values, so it
// collides with the tick-label column for this data range).
function YAxisTitle({ text }) {
  const { top, height } = useDrawingArea();
  return (
    <ChartsText
      x={26}
      y={top + height / 2}
      text={text}
      fill={t.ink}
      style={{ fontSize: 16, angle: -90, textAnchor: "middle", dominantBaseline: "auto" }}
    />
  );
}

// --- Chart -------------------------------------------------------------
export default function Chart() {
  const { width, height } = window.ANYPLOT_SIZE;
  const TITLE_HEIGHT = 60;

  return (
    <Box sx={{ width, height, display: "flex", flexDirection: "column" }}>
      <Box sx={{ height: TITLE_HEIGHT, display: "flex", alignItems: "center", justifyContent: "center" }}>
        <Typography sx={{ color: t.ink, fontSize: 22, fontWeight: 500, letterSpacing: 0.3 }}>
          line-stress-strain · javascript · muix · anyplot.ai
        </Typography>
      </Box>

      <LineChart
        width={width}
        height={height - TITLE_HEIGHT}
        dataset={dataset}
        skipAnimation
        xAxis={[
          {
            id: "strain-axis",
            dataKey: "strain",
            scaleType: "linear",
            label: "Engineering strain, ε (mm/mm)",
            min: 0,
            max: FRACTURE_STRAIN * 1.05,
            valueFormatter: (v) => v.toFixed(2),
            tickLabelStyle: { fontSize: 14, fill: t.inkSoft },
            labelStyle: { fontSize: 16, fill: t.ink },
          },
        ]}
        yAxis={[
          {
            id: "stress-axis",
            min: 0,
            max: Y_MAX,
            tickLabelStyle: { fontSize: 14, fill: t.inkSoft },
          },
        ]}
        series={[
          {
            id: "elasticYield",
            dataKey: "stressElasticYield",
            label: "Elastic + yield",
            color: t.palette[0],
            curve: "linear",
            connectNulls: true,
            showMark: false,
          },
          {
            id: "hardening",
            dataKey: "stressHardening",
            label: "Strain hardening",
            color: t.palette[1],
            curve: "monotoneX",
            connectNulls: true,
            showMark: false,
          },
          {
            id: "necking",
            dataKey: "stressNecking",
            label: "Necking",
            color: t.palette[4],
            curve: "monotoneX",
            connectNulls: true,
            showMark: false,
          },
          {
            id: "offsetLine",
            dataKey: "stressOffset",
            label: "0.2% offset",
            color: t.ink,
            curve: "linear",
            connectNulls: true,
            showMark: false,
          },
        ]}
        margin={{ top: 30, bottom: 90, left: 116, right: 40 }}
        sx={{
          "& .MuiLineElement-root": { strokeWidth: 3.5 },
          "& .MuiLineElement-series-offsetLine": { strokeWidth: 1.75, strokeDasharray: "10 6" },
          "& .MuiChartsAxis-line": { stroke: t.inkSoft },
          "& .MuiChartsAxis-tick": { stroke: t.inkSoft },
        }}
        slotProps={{
          legend: {
            position: { vertical: "top", horizontal: "right" },
            itemMarkWidth: 16,
            itemMarkHeight: 3,
            labelStyle: { fontSize: 14, fill: t.ink },
          },
        }}
      >
        <YAxisTitle text="Engineering stress, σ (MPa)" />

        <ChartsReferenceLine
          x={YIELD_STRAIN}
          label="Yield ≈ 250 MPa"
          labelAlign="start"
          spacing={{ x: 8, y: 16 }}
          lineStyle={{ stroke: t.inkSoft, strokeDasharray: "5 4", strokeWidth: 1.25 }}
          labelStyle={{ fill: t.inkSoft, fontSize: 13 }}
        />
        <ChartsReferenceLine
          x={UTS_STRAIN}
          label="UTS ≈ 450 MPa"
          labelAlign="start"
          spacing={{ x: 8, y: 16 }}
          lineStyle={{ stroke: t.inkSoft, strokeDasharray: "5 4", strokeWidth: 1.25 }}
          labelStyle={{ fill: t.inkSoft, fontSize: 13 }}
        />
        <ChartsReferenceLine
          x={FRACTURE_STRAIN}
          label="Fracture ≈ 300 MPa"
          labelAlign="start"
          spacing={{ x: 8, y: 16 }}
          lineStyle={{ stroke: t.inkSoft, strokeDasharray: "5 4", strokeWidth: 1.25 }}
          labelStyle={{ fill: t.inkSoft, fontSize: 13, textAnchor: "end" }}
        />

        <DataLabel x={0.012} y={130} text="Elastic + Yield" fill={t.palette[0]} anchor="start" />
        <DataLabel x={HARDENING_LABEL_X} y={HARDENING_LABEL_Y} text="Plastic (Strain Hardening)" fill={t.palette[1]} />
        <DataLabel x={NECKING_LABEL_X} y={NECKING_LABEL_Y} text="Necking" fill={t.palette[4]} />
        <DataLabel x={0.05} y={Y_MAX - 25} text="E ≈ 200 GPa (elastic modulus)" fill={t.inkSoft} anchor="start" fontSize={14} />

        <PointMarker x={YIELD_STRAIN} y={YIELD_STRESS} color={t.palette[0]} />
        <PointMarker x={UTS_STRAIN} y={UTS_STRESS} color={t.palette[1]} />
        <PointMarker x={FRACTURE_STRAIN} y={FRACTURE_STRESS} color={t.palette[4]} />
      </LineChart>
    </Box>
  );
}
Runnable source as JSON, for any HTTP client: https://api.anyplot.ai/specs/line-stress-strain/muix/code. Any spec id and library id listed in llms-full.txt fit the same URL shape; every URL below is complete and callable.
{
  "spec_id": "line-stress-strain",
  "language": "javascript",
  "library": "muix",
  "page": "https://anyplot.ai/line-stress-strain/javascript/muix",
  "hub": "https://anyplot.ai/line-stress-strain",
  "code_json": "https://api.anyplot.ai/specs/line-stress-strain/muix/code",
  "spec_json": "https://api.anyplot.ai/specs/line-stress-strain",
  "render_light_png": "https://storage.googleapis.com/anyplot-images/plots/line-stress-strain/javascript/muix/plot-light.png",
  "render_dark_png": "https://storage.googleapis.com/anyplot-images/plots/line-stress-strain/javascript/muix/plot-dark.png",
  "interactive_light_html": "https://storage.googleapis.com/anyplot-images/plots/line-stress-strain/javascript/muix/plot-light.html",
  "interactive_dark_html": "https://storage.googleapis.com/anyplot-images/plots/line-stress-strain/javascript/muix/plot-dark.html",
  "quality_score": 88.0,
  "license": "MIT",
  "guide": "https://anyplot.ai/llms.txt"
}
Part of Engineering Stress-Strain Curve on anyplot.ai.