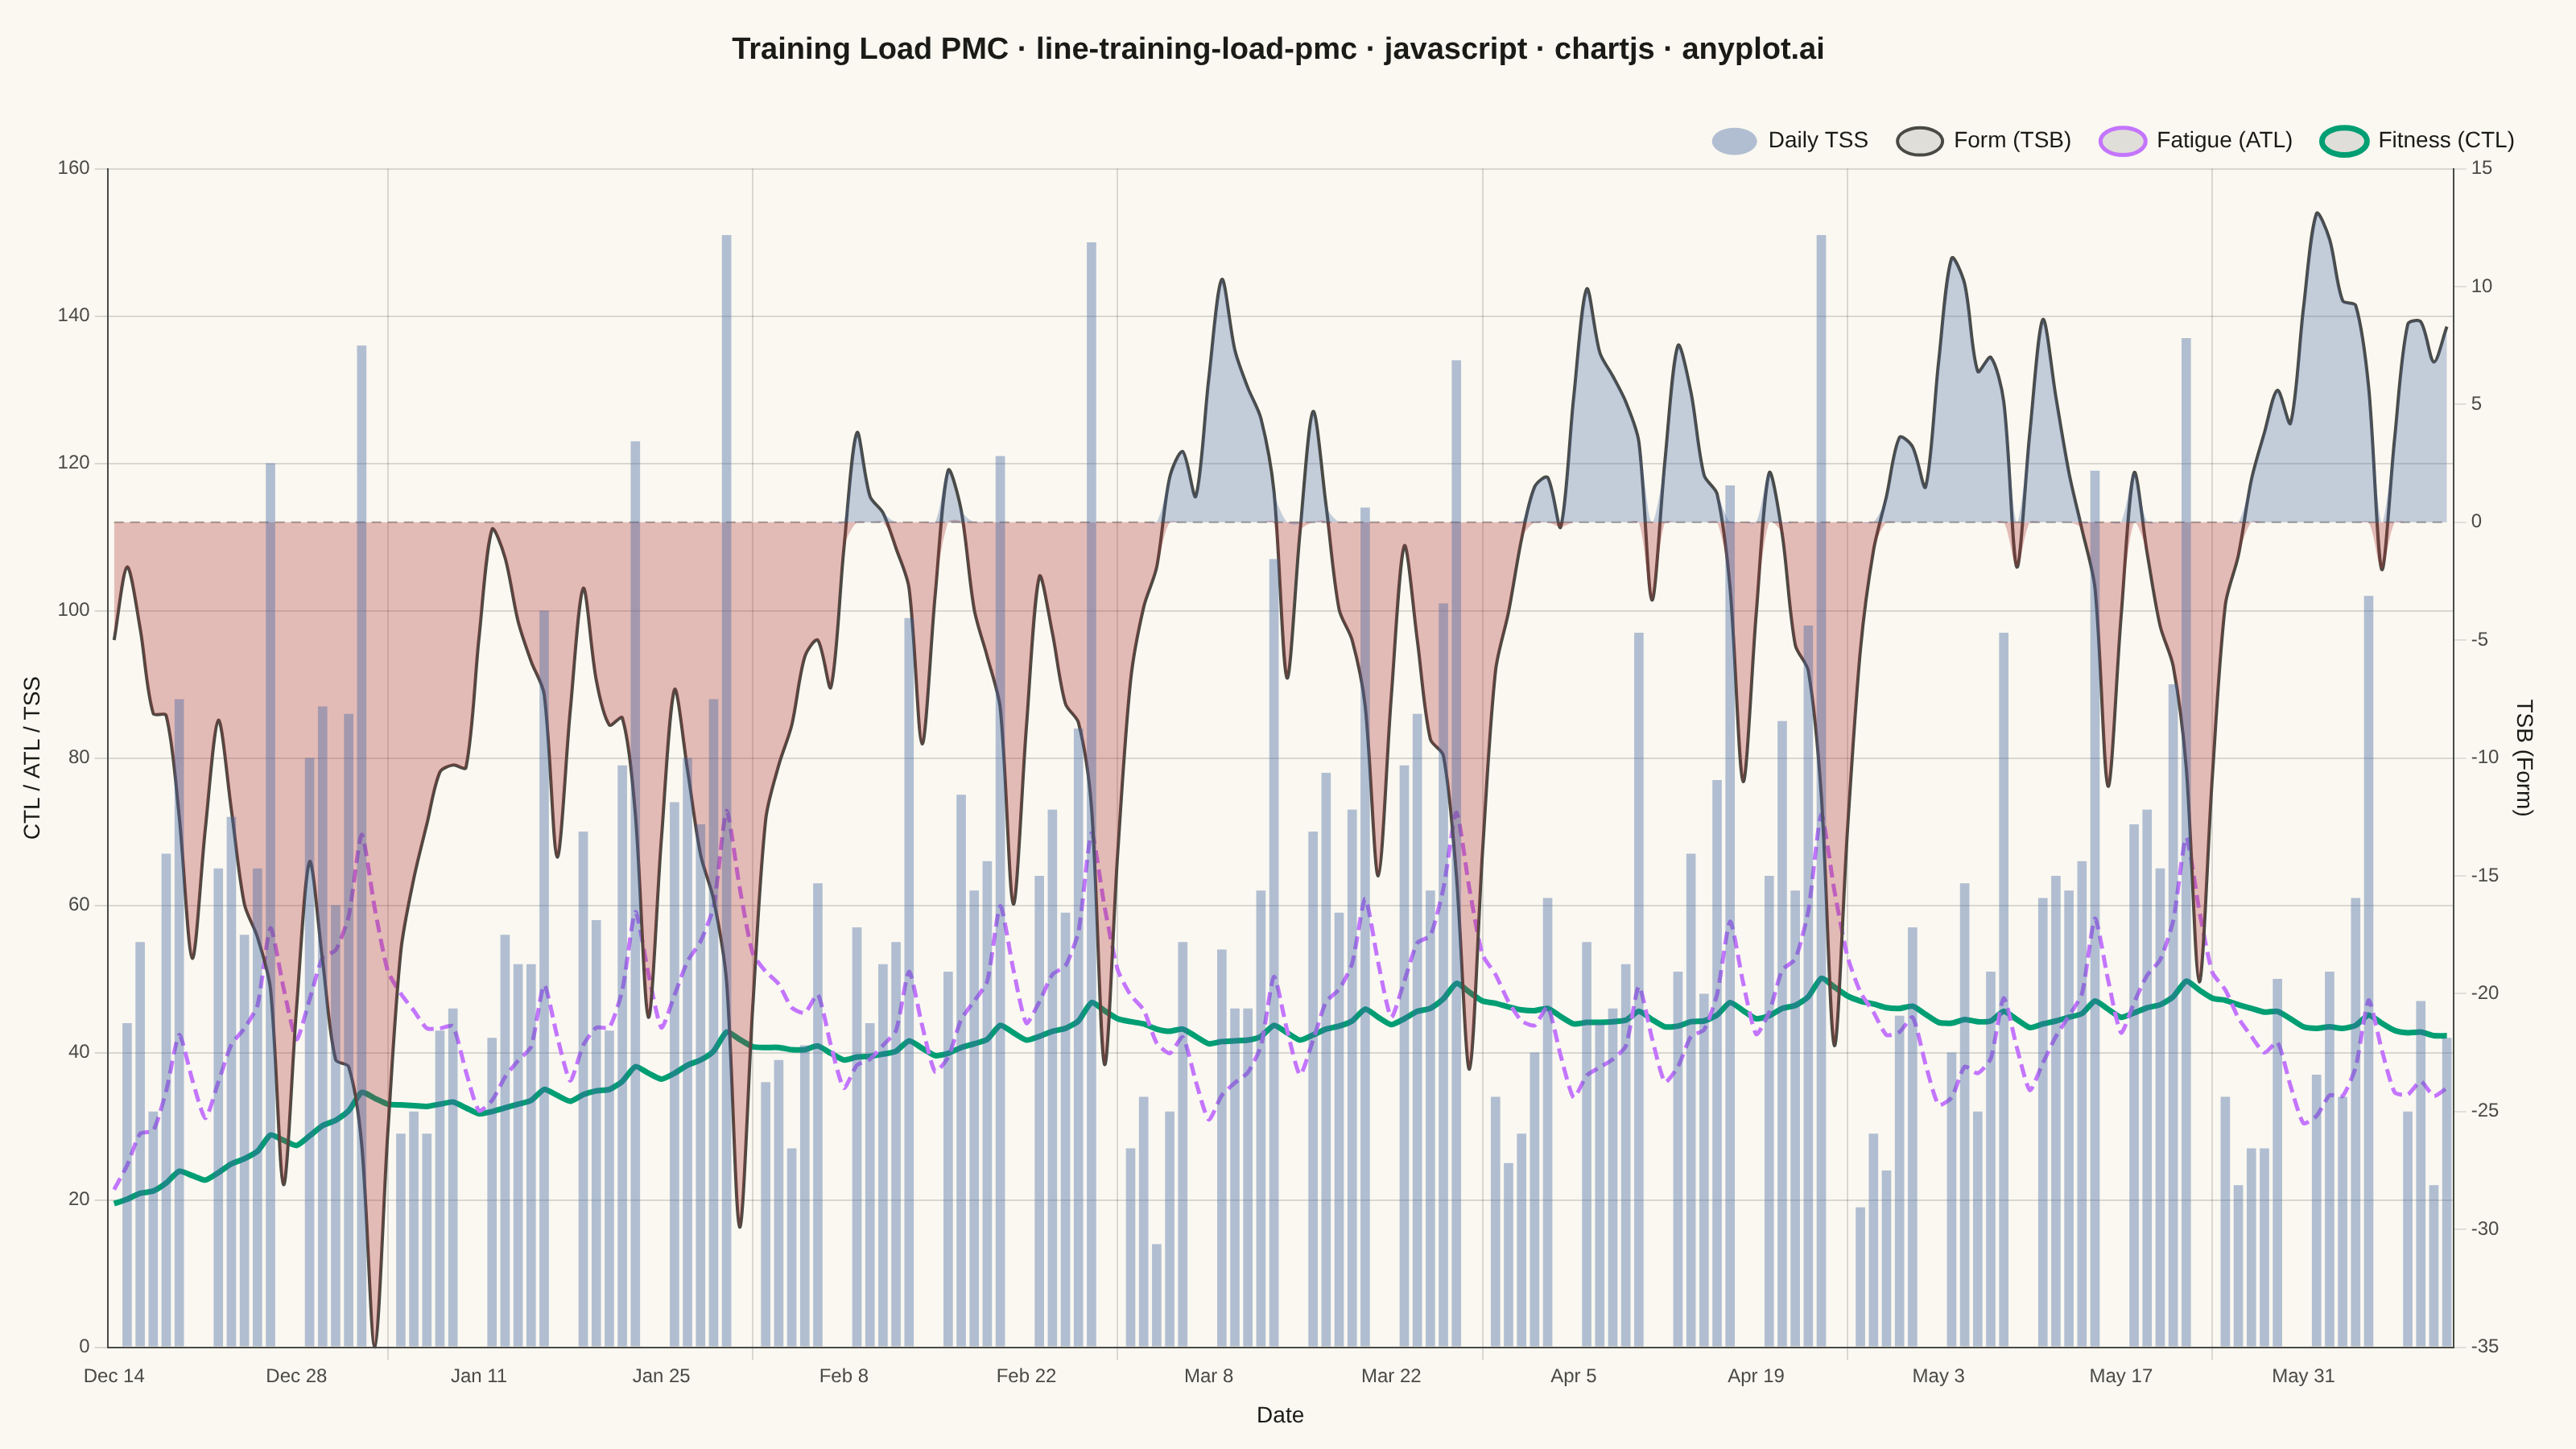
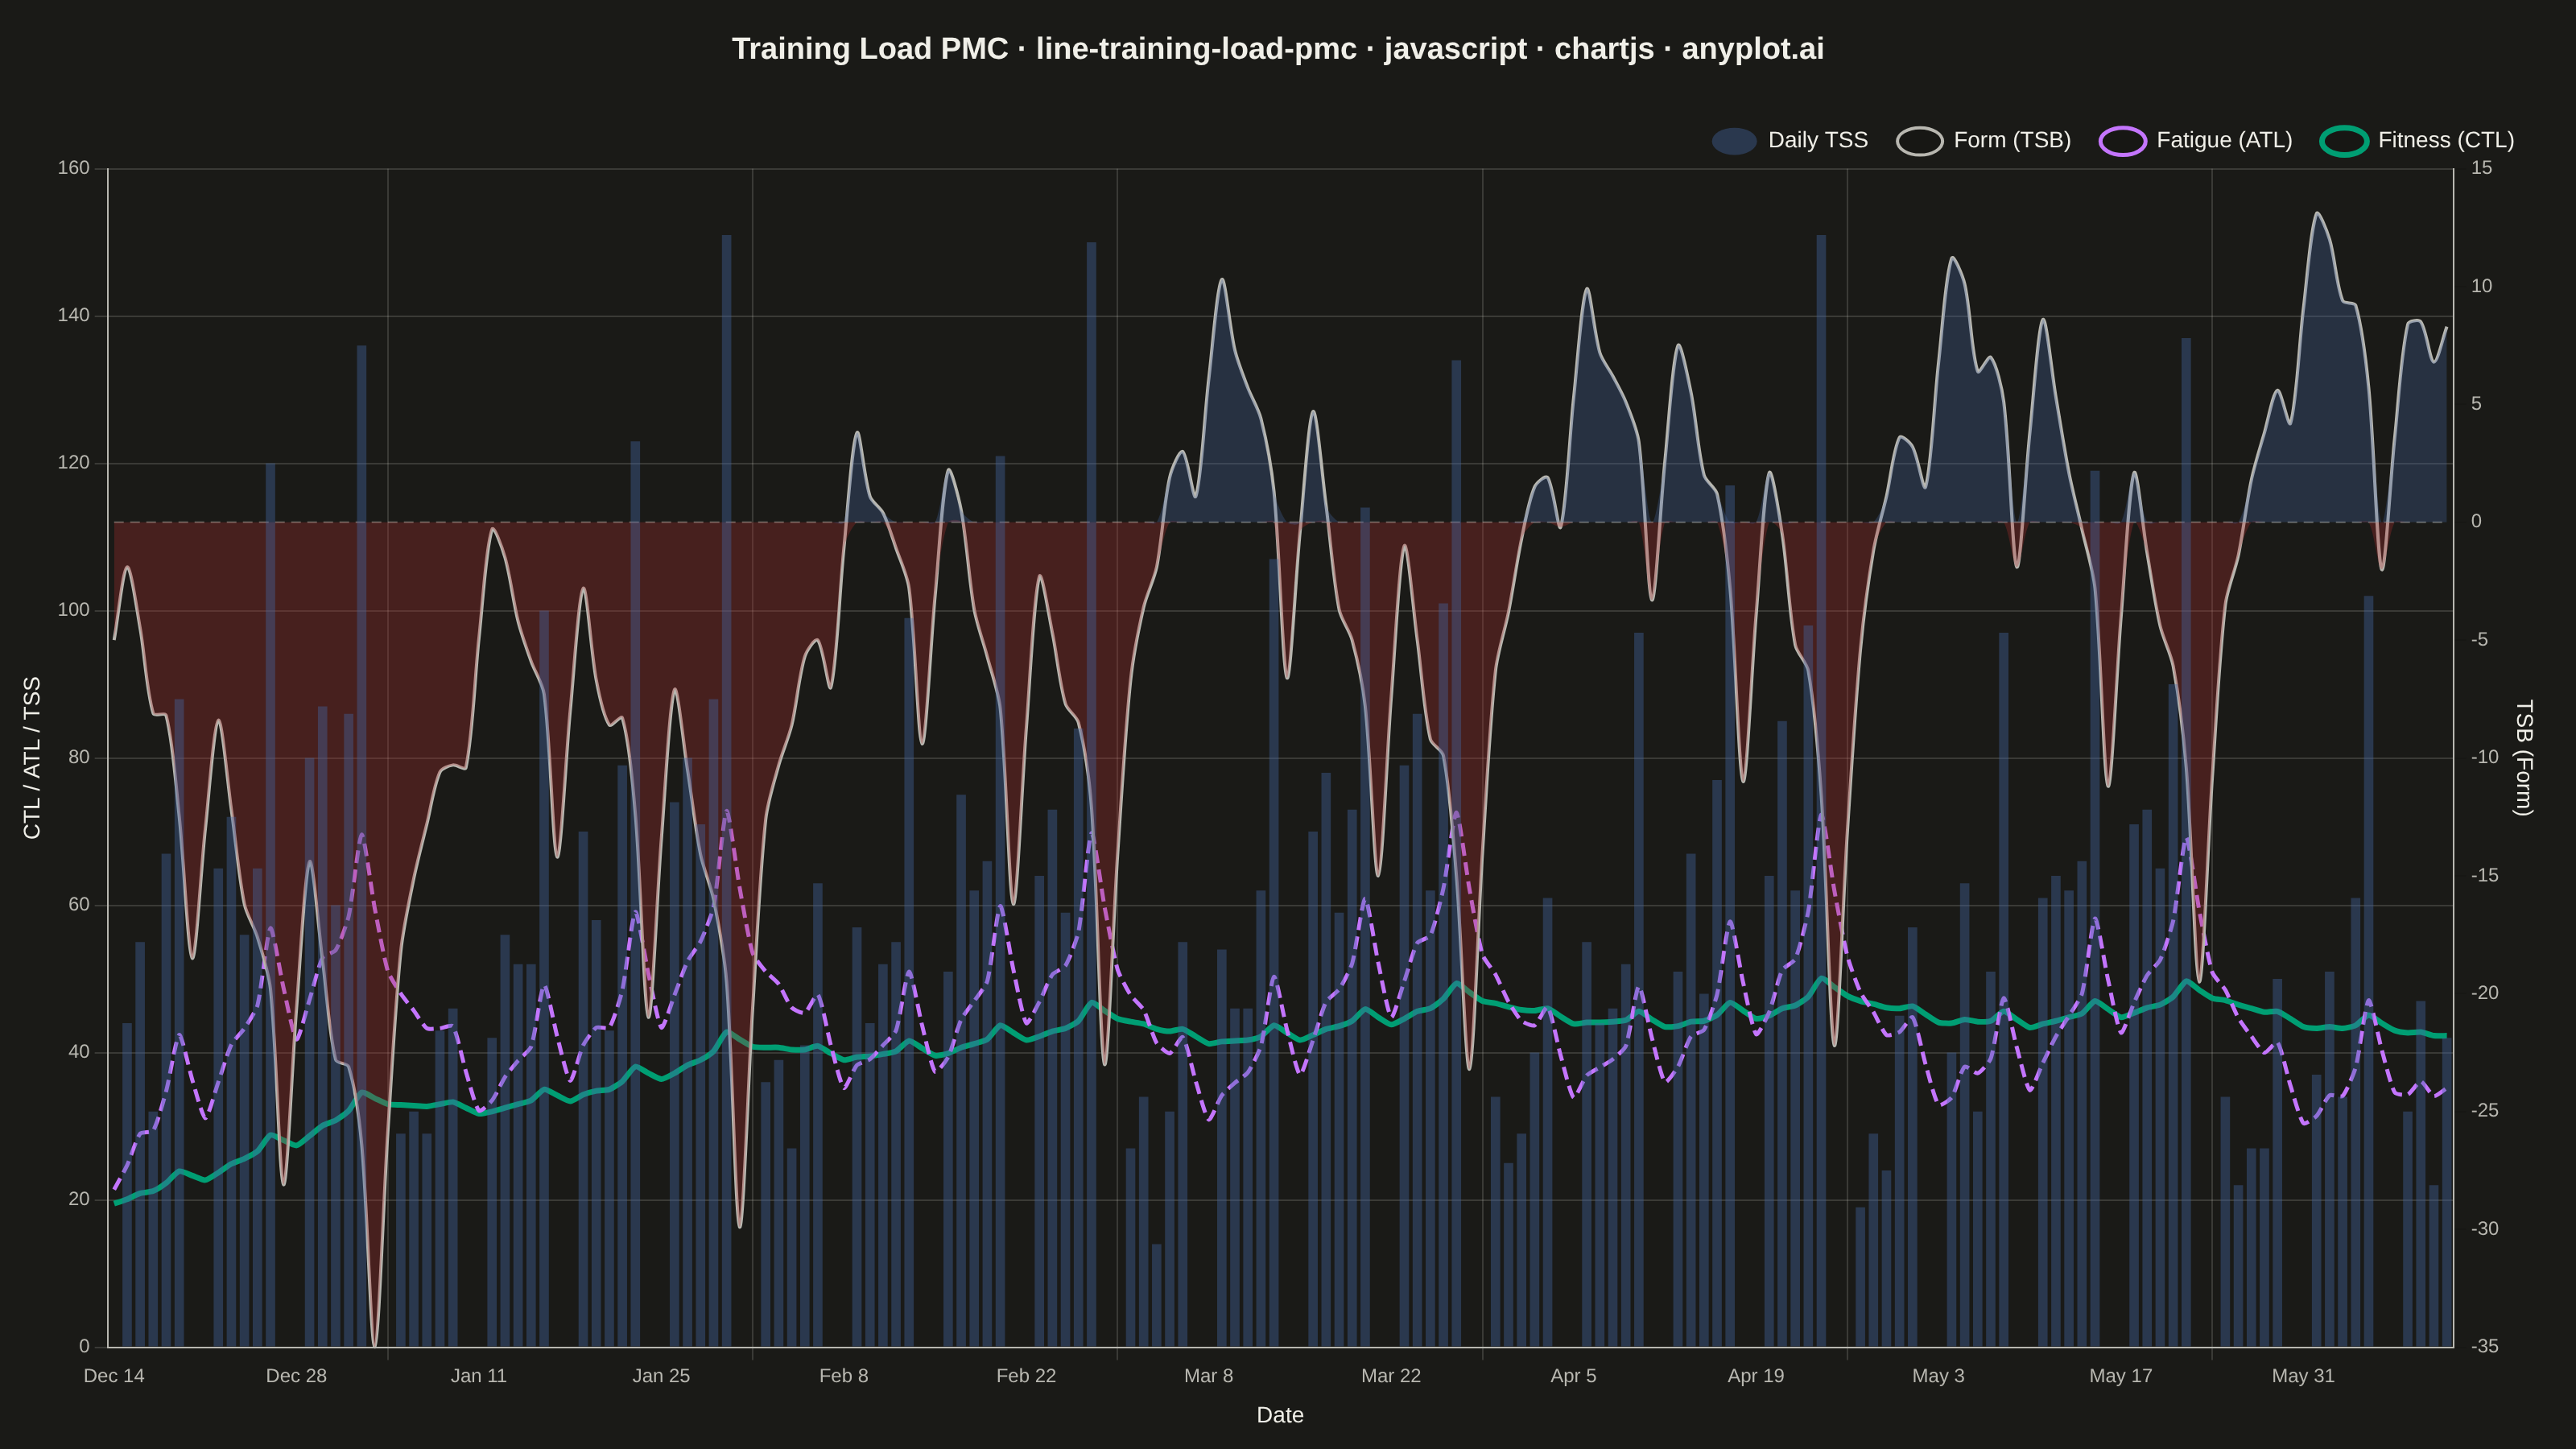
A Performance Management Chart (PMC), popularized by TrainingPeaks, summarizes an endurance athlete's training history on a single shared time axis. Two exponentially-smoothed lines track Chronic Training Load (CTL, "fitness", ~42-day time constant) and Acute Training Load (ATL, "fatigue", ~7-day time constant), while a filled area or band shows Training Stress Balance (TSB, "form" = CTL − ATL) above and below a zero baseline. Daily Training Stress Score (TSS) values appear as points or thin vertical bars, giving the raw workout intensity behind the smoothed trends. The chart reveals whether an athlete is building fitness, accumulating fatigue, or freshening up (positive form) for a target event.
// anyplot.ai
// line-training-load-pmc: Training Load Performance Management Chart
// Library: chartjs 4.4.7 | JavaScript 22.22.3
// Quality: 86/100 | Created: 2026-06-13

const t = window.ANYPLOT_TOKENS;

// --- Data ---------------------------------------------------------------
const N = 180;

// Deterministic LCG for reproducible day-to-day variation
let lcgState = 7919;
function lcg() {
    lcgState = (lcgState * 1664525 + 1013904223) >>> 0;
    return lcgState / 4294967295;
}

// Daily base TSS by day-of-week (Mon=0 … Sun=6): rest Mon, long Sat, rest Sun
const dayBase = [0, 80, 90, 70, 100, 160, 0];

const tssArr = [];
for (let i = 0; i < N; i++) {
    const week = Math.floor(i / 7);
    const dow = i % 7;
    const cyclePhase = week % 4; // 0-2: build weeks, 3: recovery week
    const loadFactor = cyclePhase === 3 ? 0.35 : 0.60 + cyclePhase * 0.15;
    const taperFactor = week >= 24 ? Math.max(0.15, 1 - (week - 24) * 0.45) : 1;
    const base = dayBase[dow];
    if (base === 0) {
        tssArr.push(0);
    } else {
        const jitter = (lcg() - 0.5) * 22;
        tssArr.push(Math.max(0, Math.round(base * loadFactor * taperFactor + jitter)));
    }
}

// CTL = 42-day EWMA (fitness), ATL = 7-day EWMA (fatigue), TSB = CTL − ATL
const ctlArr = [], atlArr = [], tsbArr = [];
let ctlPrev = 20, atlPrev = 25;
for (let i = 0; i < N; i++) {
    tsbArr.push(Math.round((ctlPrev - atlPrev) * 10) / 10);
    ctlPrev = ctlPrev + (tssArr[i] - ctlPrev) / 42;
    atlPrev = atlPrev + (tssArr[i] - atlPrev) / 7;
    ctlArr.push(Math.round(ctlPrev * 10) / 10);
    atlArr.push(Math.round(atlPrev * 10) / 10);
}

// Date labels for x-axis
const startDate = new Date("2025-12-14");
const labels = Array.from({ length: N }, (_, i) => {
    const d = new Date(startDate);
    d.setDate(d.getDate() + i);
    return d.toLocaleDateString("en-US", { month: "short", day: "numeric" });
});

// TSB split: separate positive (fresh) and negative (fatigued) for two-tone fill
const tsbPos = tsbArr.map(v => v >= 0 ? v : 0);
const tsbNeg = tsbArr.map(v => v <= 0 ? v : 0);

// --- Mount ---------------------------------------------------------------
const canvas = document.createElement("canvas");
document.getElementById("container").appendChild(canvas);

// --- Title ---------------------------------------------------------------
const TITLE = "Training Load PMC · line-training-load-pmc · javascript · chartjs · anyplot.ai";
const titleSize = Math.max(15, Math.round(22 * 67 / TITLE.length));

// --- Chart ---------------------------------------------------------------
new Chart(canvas, {
    type: "line",
    data: {
        labels,
        datasets: [
            // Daily TSS bars — raw workout load, drawn as background layer
            {
                type: "bar",
                label: "Daily TSS",
                data: tssArr,
                yAxisID: "y",
                backgroundColor: t.palette[2] + "66",
                borderWidth: 0,
            },
            // TSB positive fill — fresh / good form (blue, per spec and CVD safety)
            {
                type: "line",
                label: "_tsbPos",
                data: tsbPos,
                yAxisID: "y1",
                backgroundColor: t.palette[2] + "4D",
                borderWidth: 0,
                pointRadius: 0,
                fill: "origin",
                tension: 0.3,
            },
            // TSB negative fill — fatigued / overloaded (red)
            {
                type: "line",
                label: "_tsbNeg",
                data: tsbNeg,
                yAxisID: "y1",
                backgroundColor: t.palette[4] + "4D",
                borderWidth: 0,
                pointRadius: 0,
                fill: "origin",
                tension: 0.3,
            },
            // TSB = 0 reference line — separates fresh from fatigued zones
            {
                type: "line",
                label: "_zero",
                data: Array(N).fill(0),
                yAxisID: "y1",
                borderColor: t.inkSoft + "80",
                borderWidth: 1,
                borderDash: [6, 4],
                pointRadius: 0,
                fill: false,
            },
            // Form (TSB) outline
            {
                type: "line",
                label: "Form (TSB)",
                data: tsbArr,
                yAxisID: "y1",
                borderColor: t.inkSoft,
                borderWidth: 2,
                pointRadius: 0,
                fill: false,
                tension: 0.3,
            },
            // Fatigue (ATL) — 7-day EWMA, dashed to distinguish from CTL
            {
                type: "line",
                label: "Fatigue (ATL)",
                data: atlArr,
                yAxisID: "y",
                borderColor: t.palette[1],
                borderWidth: 2.5,
                borderDash: [8, 4],
                pointRadius: 0,
                fill: false,
                tension: 0.2,
            },
            // Fitness (CTL) — 42-day EWMA, smoothest and thickest line
            {
                type: "line",
                label: "Fitness (CTL)",
                data: ctlArr,
                yAxisID: "y",
                borderColor: t.palette[0],
                borderWidth: 3.5,
                pointRadius: 0,
                fill: false,
                tension: 0.2,
            },
        ],
    },
    options: {
        responsive: true,
        maintainAspectRatio: false,
        animation: false,
        layout: {
            padding: { top: 8, right: 20, bottom: 8, left: 8 },
        },
        plugins: {
            title: {
                display: true,
                text: TITLE,
                color: t.ink,
                font: { size: titleSize, weight: "bold" },
                padding: { top: 12, bottom: 20 },
            },
            legend: {
                position: "top",
                align: "end",
                labels: {
                    color: t.ink,
                    font: { size: 14 },
                    filter: (item) => !item.text.startsWith("_"),
                    usePointStyle: true,
                    pointStyleWidth: 28,
                    boxHeight: 12,
                    padding: 18,
                },
            },
        },
        scales: {
            x: {
                ticks: {
                    color: t.inkSoft,
                    font: { size: 12 },
                    maxTicksLimit: 13,
                    maxRotation: 0,
                },
                grid: { color: t.grid },
                border: { color: t.inkSoft },
                title: {
                    display: true,
                    text: "Date",
                    color: t.ink,
                    font: { size: 14 },
                    padding: { top: 6 },
                },
            },
            y: {
                position: "left",
                min: 0,
                ticks: {
                    color: t.inkSoft,
                    font: { size: 12 },
                },
                grid: { color: t.grid },
                border: { color: t.inkSoft },
                title: {
                    display: true,
                    text: "CTL / ATL / TSS",
                    color: t.ink,
                    font: { size: 14 },
                },
            },
            y1: {
                position: "right",
                ticks: {
                    color: t.inkSoft,
                    font: { size: 12 },
                },
                grid: { drawOnChartArea: false },
                border: { color: t.inkSoft },
                title: {
                    display: true,
                    text: "TSB (Form)",
                    color: t.ink,
                    font: { size: 14 },
                },
            },
        },
    },
    plugins: [
        {
            id: "canvasBg",
            beforeDraw(chart) {
                const ctx = chart.canvas.getContext("2d");
                ctx.save();
                ctx.fillStyle = t.pageBg;
                ctx.fillRect(0, 0, chart.width, chart.height);
                ctx.restore();
            },
        },
    ],
});
Runnable source as JSON, for any HTTP client: https://api.anyplot.ai/specs/line-training-load-pmc/chartjs/code. Any spec id and library id listed in llms-full.txt fit the same URL shape; every URL below is complete and callable.
{
  "spec_id": "line-training-load-pmc",
  "language": "javascript",
  "library": "chartjs",
  "page": "https://anyplot.ai/line-training-load-pmc/javascript/chartjs",
  "hub": "https://anyplot.ai/line-training-load-pmc",
  "code_json": "https://api.anyplot.ai/specs/line-training-load-pmc/chartjs/code",
  "spec_json": "https://api.anyplot.ai/specs/line-training-load-pmc",
  "render_light_png": "https://storage.googleapis.com/anyplot-images/plots/line-training-load-pmc/javascript/chartjs/plot-light.png",
  "render_dark_png": "https://storage.googleapis.com/anyplot-images/plots/line-training-load-pmc/javascript/chartjs/plot-dark.png",
  "interactive_light_html": "https://storage.googleapis.com/anyplot-images/plots/line-training-load-pmc/javascript/chartjs/plot-light.html",
  "interactive_dark_html": "https://storage.googleapis.com/anyplot-images/plots/line-training-load-pmc/javascript/chartjs/plot-dark.html",
  "quality_score": 86.0,
  "license": "MIT",
  "guide": "https://anyplot.ai/llms.txt"
}
Part of Training Load Performance Management Chart on anyplot.ai.