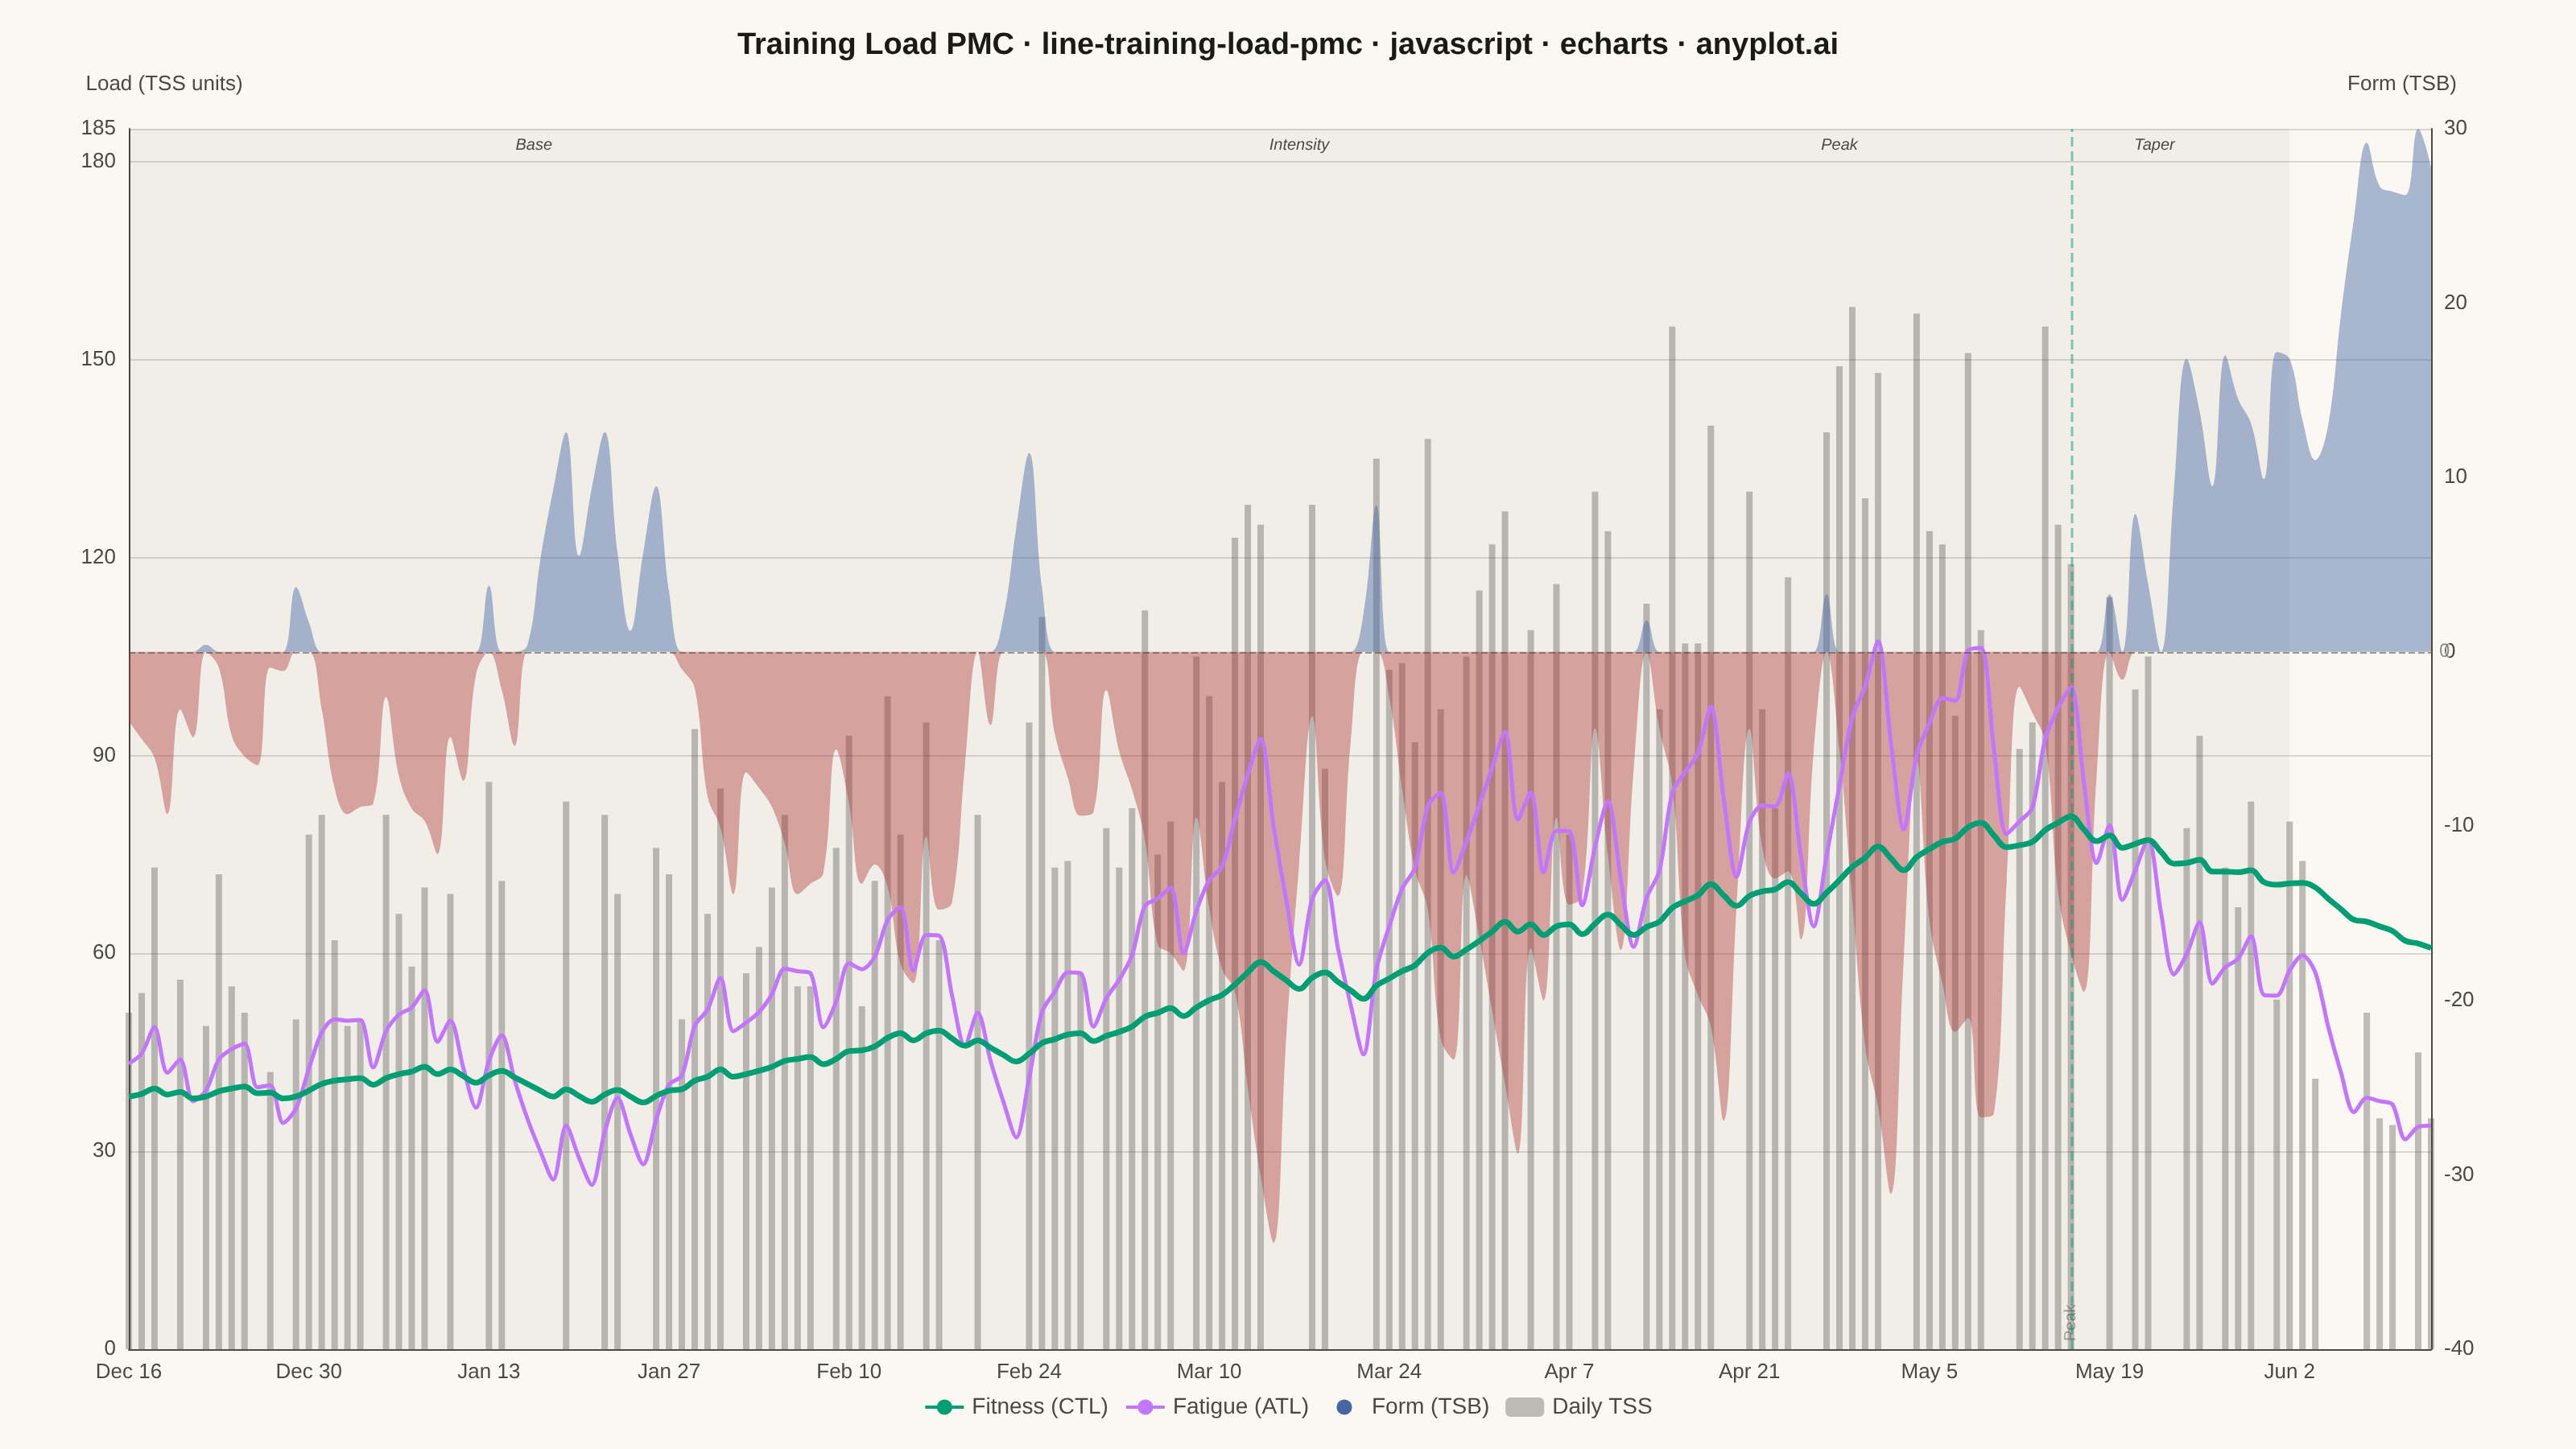
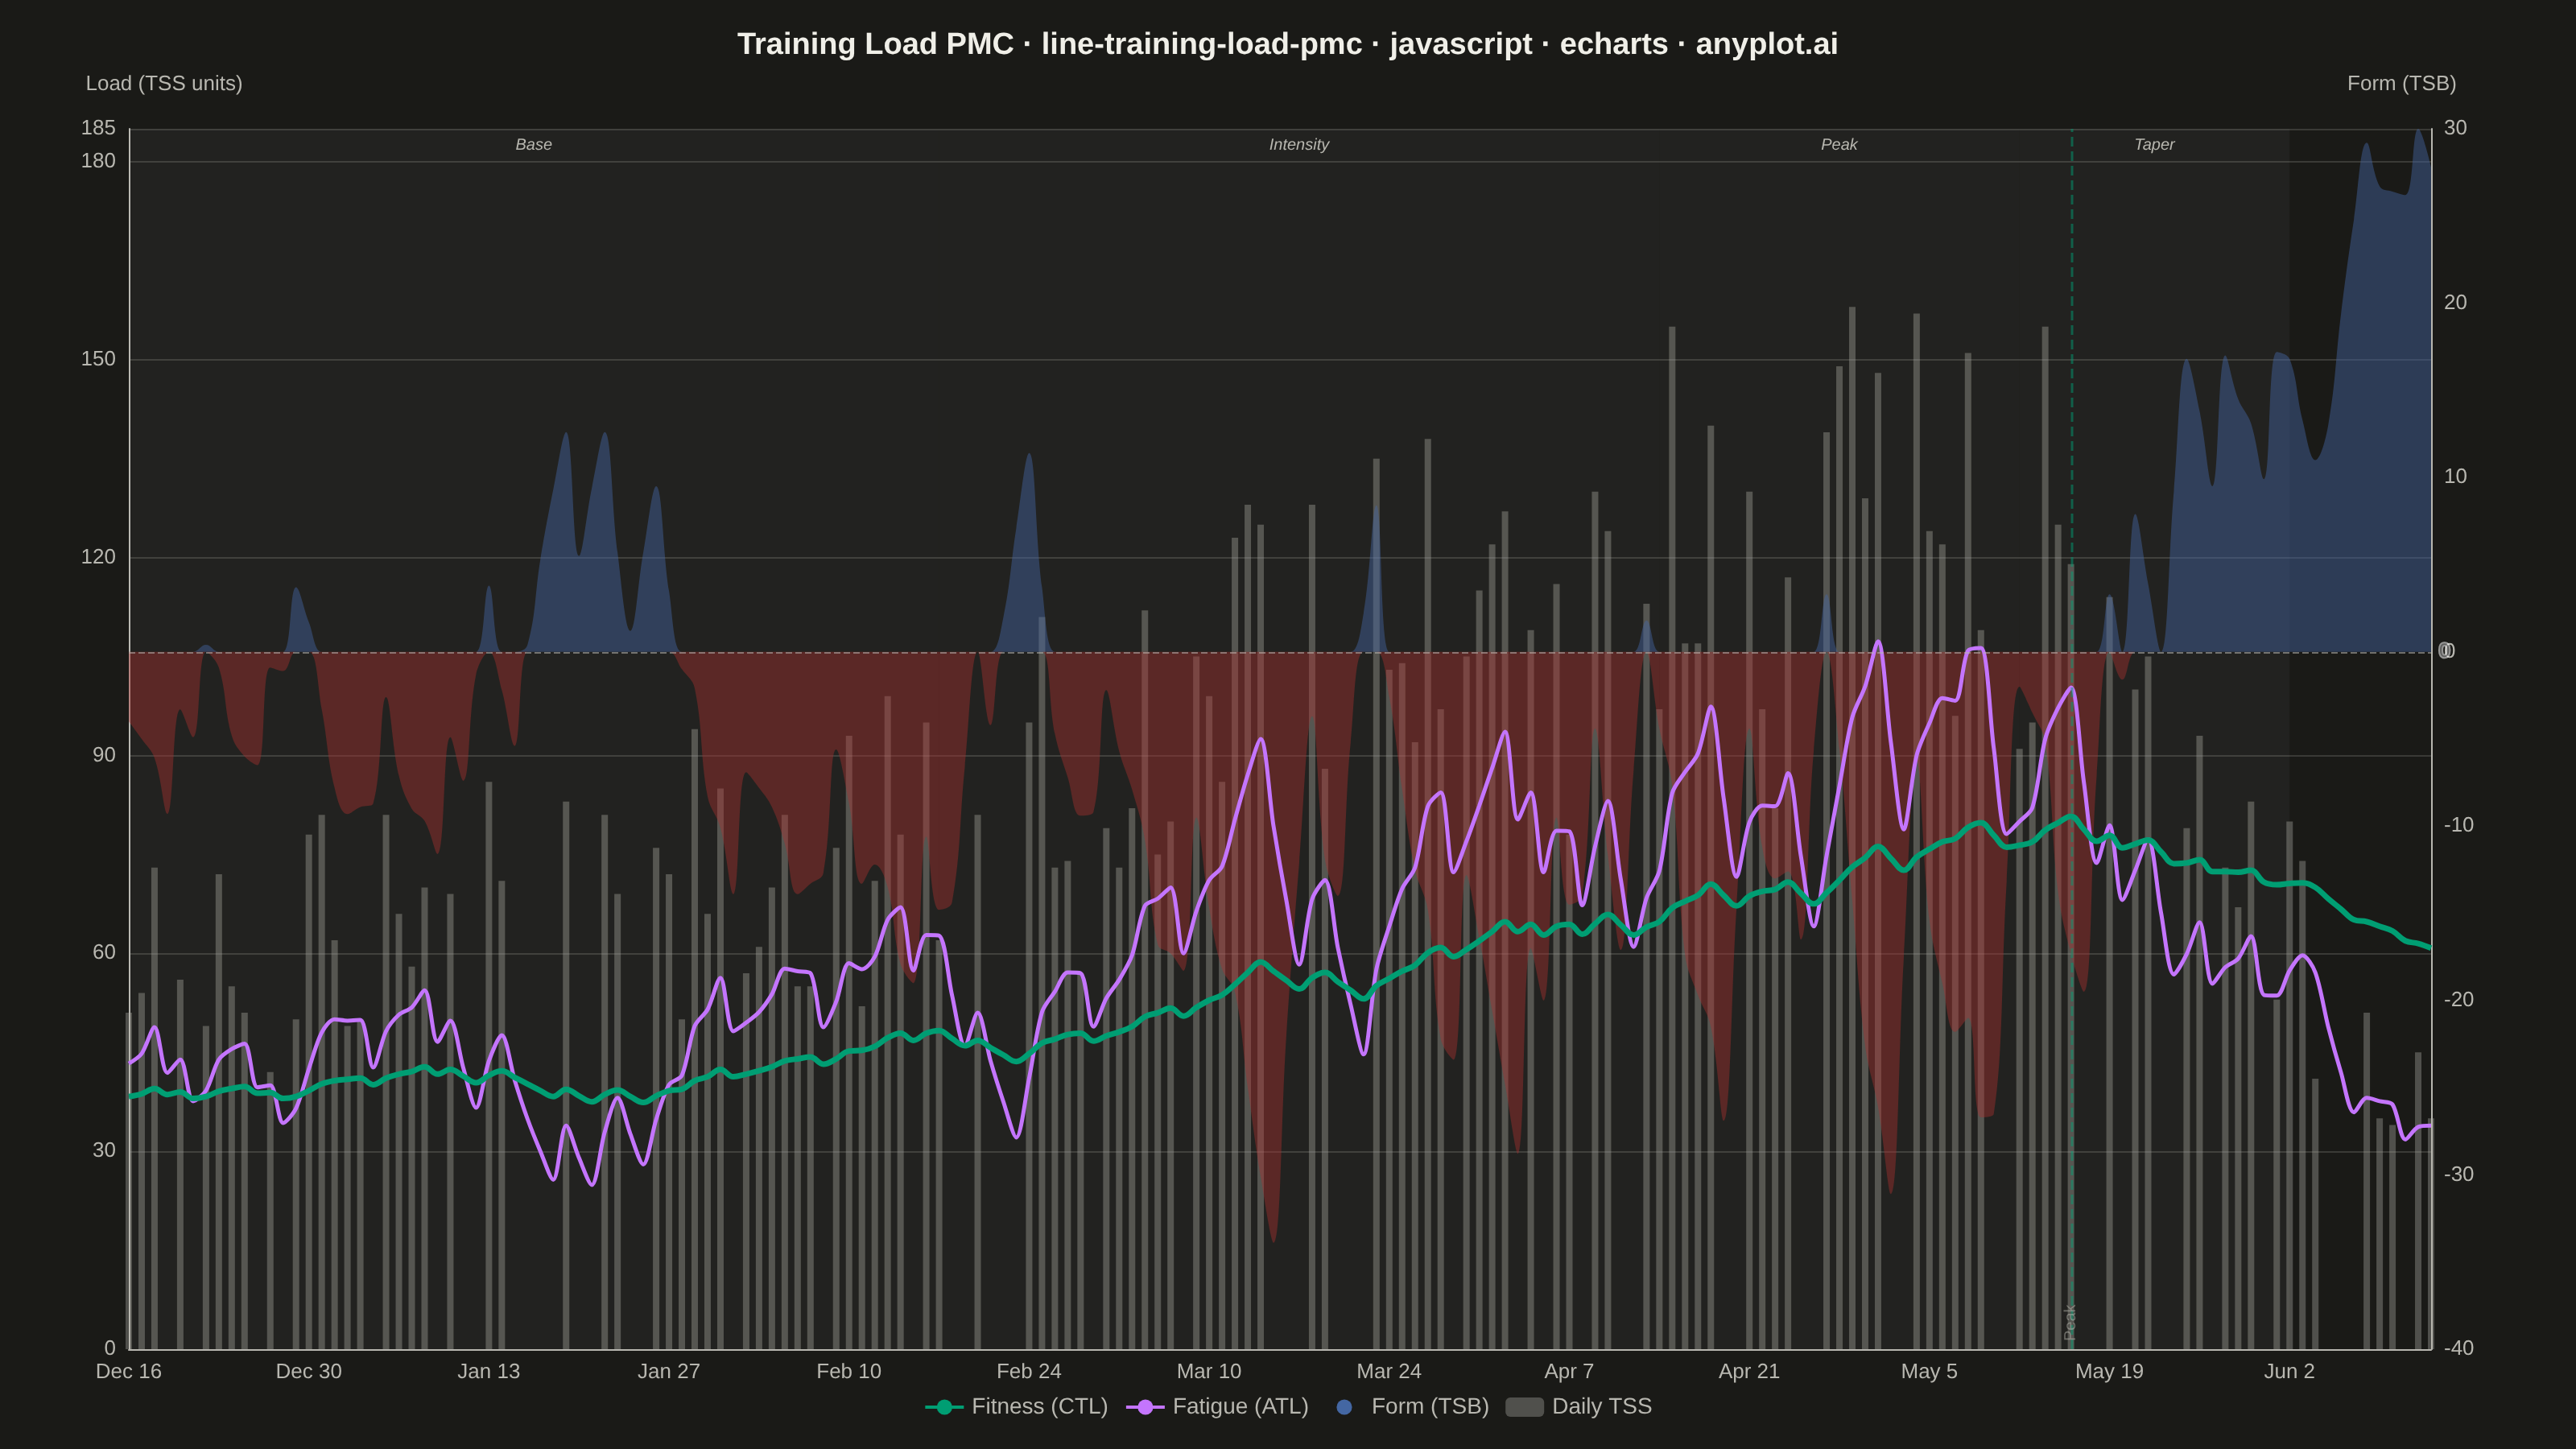
A Performance Management Chart (PMC), popularized by TrainingPeaks, summarizes an endurance athlete's training history on a single shared time axis. Two exponentially-smoothed lines track Chronic Training Load (CTL, "fitness", ~42-day time constant) and Acute Training Load (ATL, "fatigue", ~7-day time constant), while a filled area or band shows Training Stress Balance (TSB, "form" = CTL − ATL) above and below a zero baseline. Daily Training Stress Score (TSS) values appear as points or thin vertical bars, giving the raw workout intensity behind the smoothed trends. The chart reveals whether an athlete is building fitness, accumulating fatigue, or freshening up (positive form) for a target event.
// anyplot.ai
// line-training-load-pmc: Training Load Performance Management Chart
// Library: echarts 5.5.1 | JavaScript 22.22.3
// Quality: 91/100 | Created: 2026-06-13

const t = window.ANYPLOT_TOKENS;
const isDark = window.ANYPLOT_THEME === "dark";

// Deterministic data (xorshift RNG — no Math.random())
let seed = 12345;
const rand = () => {
  seed ^= seed << 13;
  seed ^= seed >> 17;
  seed ^= seed << 5;
  return (seed >>> 0) / 0x100000000;
};

// Generate 180 days starting Dec 16 2025, ending ~Jun 13 2026
const N = 180;
const dates = [];
const tssArr = [];
const ctlArr = [];
const atlArr = [];
const tsbArr = [];

let ctl = 38;
let atl = 42;

for (let i = 0; i < N; i++) {
  const d = new Date(2025, 11, 16 + i); // Dec 16 2025 + i days (JS handles overflow)
  dates.push(d.toLocaleDateString("en-US", { month: "short", day: "numeric" }));

  // TSB = yesterday's CTL - yesterday's ATL (form going into the day)
  tsbArr.push(+(ctl - atl).toFixed(1));

  // Training phase determines TSS distribution
  const phase = i / N;
  const dow = d.getDay(); // 0 = Sunday

  let tss = 0;
  if (dow !== 0) {
    const r = rand();
    const restChance = dow === 6 ? 0.3 : 0.15;
    if (r >= restChance) {
      let baseTSS;
      if (phase < 0.35) {
        baseTSS = 55 + phase * 70;           // base build: 55 → 79
      } else if (phase < 0.65) {
        baseTSS = 79 + (phase - 0.35) * 130; // intensity: 79 → 118
      } else if (phase < 0.82) {
        baseTSS = 118 + (phase - 0.65) * 30; // peak: 118 → 123
      } else {
        baseTSS = 123 * Math.max(0.22, 1 - (phase - 0.82) * 4.3); // taper
      }
      tss = Math.round(baseTSS * (0.65 + rand() * 0.70));
    } else {
      rand(); // consume RNG slot to keep sequence consistent
    }
  }

  tssArr.push(tss);

  // EWMA: CTL ≈ 42-day constant, ATL ≈ 7-day constant
  ctl = ctl + (tss - ctl) / 42;
  atl = atl + (tss - atl) / 7;
  ctlArr.push(+ctl.toFixed(1));
  atlArr.push(+atl.toFixed(1));
}

// Two-tone TSB: positive clipped to [0, ∞) and negative clipped to (-∞, 0]
const tsbPos = tsbArr.map(v => Math.max(v, 0));
const tsbNeg = tsbArr.map(v => Math.min(v, 0));

// Phase boundary indices (matching data generation thresholds)
const baseEnd = Math.floor(N * 0.35) - 1;      // day 62
const intensityEnd = Math.floor(N * 0.65) - 1; // day 116
const peakEnd = Math.floor(N * 0.82) - 1;      // day 147

// Peak CTL date for annotation
let peakCtlIdx = 0;
for (let i = 1; i < ctlArr.length; i++) {
  if (ctlArr[i] > ctlArr[peakCtlIdx]) peakCtlIdx = i;
}

// Very subtle phase background shading, theme-adaptive
const phaseShade = isDark ? "rgba(255,255,255,0.04)" : "rgba(0,0,0,0.04)";

const chart = echarts.init(document.getElementById("container"));

const titleText =
  "Training Load PMC · line-training-load-pmc · javascript · echarts · anyplot.ai";
const titleFontSize = Math.max(14, Math.round(22 * 67 / titleText.length));

chart.setOption({
  animation: false,
  backgroundColor: "transparent",

  title: {
    text: titleText,
    left: "center",
    top: 14,
    textStyle: { color: t.ink, fontSize: titleFontSize, fontWeight: "bold" },
  },

  legend: {
    data: ["Fitness (CTL)", "Fatigue (ATL)", "Form (TSB)", "Daily TSS"],
    bottom: 14,
    textStyle: { color: t.inkSoft, fontSize: 14 },
    itemWidth: 24,
    itemHeight: 12,
  },

  grid: { left: 80, right: 90, top: 80, bottom: 62 },

  xAxis: {
    type: "category",
    data: dates,
    boundaryGap: false,
    axisLabel: { color: t.inkSoft, fontSize: 13, interval: 13 },
    axisLine: { lineStyle: { color: t.inkSoft } },
    axisTick: { show: false },
    splitLine: { show: false },
  },

  yAxis: [
    {
      // Primary — CTL, ATL, raw TSS bars
      name: "Load (TSS units)",
      nameTextStyle: { color: t.inkSoft, fontSize: 13, padding: [0, 0, 6, 44] },
      type: "value",
      min: 0,
      max: 185,
      axisLabel: { color: t.inkSoft, fontSize: 13 },
      axisLine: { show: true, lineStyle: { color: t.inkSoft } },
      axisTick: { show: false },
      splitLine: { lineStyle: { color: t.grid } },
    },
    {
      // Secondary — TSB oscillates around zero
      name: "Form (TSB)",
      nameTextStyle: { color: t.inkSoft, fontSize: 13, padding: [0, 36, 6, 0] },
      type: "value",
      position: "right",
      axisLabel: { color: t.inkSoft, fontSize: 13 },
      axisLine: { show: true, lineStyle: { color: t.inkSoft } },
      axisTick: { show: false },
      splitLine: { show: false },
    },
  ],

  series: [
    // --- Primary axis series ---
    {
      name: "Fitness (CTL)",
      type: "line",
      data: ctlArr,
      smooth: 0.4,
      symbol: "none",
      // palette[0] = brand green: first categorical series (hard rule) + fitness/progress reads as green
      lineStyle: { width: 3.5, color: t.palette[0] },
      itemStyle: { color: t.palette[0] },
      yAxisIndex: 0,
      z: 5,
      // Annotate peak fitness moment for data storytelling
      markLine: {
        silent: true,
        symbol: ["none", "none"],
        lineStyle: { color: t.palette[0], opacity: 0.5, width: 1.5, type: "dashed" },
        label: {
          show: true,
          formatter: "Peak",
          position: "insideStart",
          fontSize: 10,
          color: t.inkSoft,
        },
        data: [{ xAxis: dates[peakCtlIdx] }],
      },
    },
    {
      name: "Fatigue (ATL)",
      type: "line",
      data: atlArr,
      smooth: 0.3,
      symbol: "none",
      lineStyle: { width: 2.5, color: t.palette[1] }, // lavender — acute fatigue
      itemStyle: { color: t.palette[1] },
      yAxisIndex: 0,
      z: 4,
    },
    {
      // Raw daily training load — muted vertical bars; carries training phase markArea (z:1, below data)
      name: "Daily TSS",
      type: "bar",
      data: tssArr,
      yAxisIndex: 0,
      barMaxWidth: 4,
      itemStyle: { color: t.inkSoft, opacity: 0.35 },
      z: 1,
      // Subtle phase shading with italic labels for data storytelling
      markArea: {
        silent: true,
        itemStyle: { color: phaseShade },
        label: {
          show: true,
          position: "insideTop",
          fontSize: 10,
          color: t.inkSoft,
          fontStyle: "italic",
        },
        data: [
          [{ name: "Base", xAxis: dates[0] }, { xAxis: dates[baseEnd] }],
          [{ name: "Intensity", xAxis: dates[baseEnd + 1] }, { xAxis: dates[intensityEnd] }],
          [{ name: "Peak", xAxis: dates[intensityEnd + 1] }, { xAxis: dates[peakEnd] }],
          [{ name: "Taper", xAxis: dates[peakEnd + 1] }, { xAxis: dates[N - 1] }],
        ],
      },
    },

    // --- Secondary axis: TSB two-tone area ---
    {
      // Positive TSB (fresh / peak form) — blue fill (spec: "positive form = fresh/blue")
      name: "Form (TSB)",
      type: "line",
      data: tsbPos,
      smooth: 0.4,
      symbol: "none",
      lineStyle: { width: 0 },
      areaStyle: { color: t.palette[2], opacity: 0.45 }, // blue — fresh/positive form
      itemStyle: { color: t.palette[2] },
      yAxisIndex: 1,
      z: 3,
      // Idiomatic ECharts zero reference via markLine (avoids phantom series)
      markLine: {
        silent: true,
        symbol: ["none", "none"],
        lineStyle: { color: t.inkSoft, opacity: 0.55, width: 1 },
        data: [{ yAxis: 0 }],
      },
    },
    {
      // Negative TSB (fatigued) — matte red fill
      name: "_tsb_neg",
      type: "line",
      data: tsbNeg,
      smooth: 0.4,
      symbol: "none",
      lineStyle: { width: 0 },
      areaStyle: { color: "#AE3030", opacity: 0.40 }, // matte red — fatigued
      itemStyle: { color: "#AE3030" },
      yAxisIndex: 1,
      z: 3,
      legendHoverLink: false,
      tooltip: { show: false },
    },
  ],
});
Runnable source as JSON, for any HTTP client: https://api.anyplot.ai/specs/line-training-load-pmc/echarts/code. Any spec id and library id listed in llms-full.txt fit the same URL shape; every URL below is complete and callable.
{
  "spec_id": "line-training-load-pmc",
  "language": "javascript",
  "library": "echarts",
  "page": "https://anyplot.ai/line-training-load-pmc/javascript/echarts",
  "hub": "https://anyplot.ai/line-training-load-pmc",
  "code_json": "https://api.anyplot.ai/specs/line-training-load-pmc/echarts/code",
  "spec_json": "https://api.anyplot.ai/specs/line-training-load-pmc",
  "render_light_png": "https://storage.googleapis.com/anyplot-images/plots/line-training-load-pmc/javascript/echarts/plot-light.png",
  "render_dark_png": "https://storage.googleapis.com/anyplot-images/plots/line-training-load-pmc/javascript/echarts/plot-dark.png",
  "interactive_light_html": "https://storage.googleapis.com/anyplot-images/plots/line-training-load-pmc/javascript/echarts/plot-light.html",
  "interactive_dark_html": "https://storage.googleapis.com/anyplot-images/plots/line-training-load-pmc/javascript/echarts/plot-dark.html",
  "quality_score": 91.0,
  "license": "MIT",
  "guide": "https://anyplot.ai/llms.txt"
}
Part of Training Load Performance Management Chart on anyplot.ai.