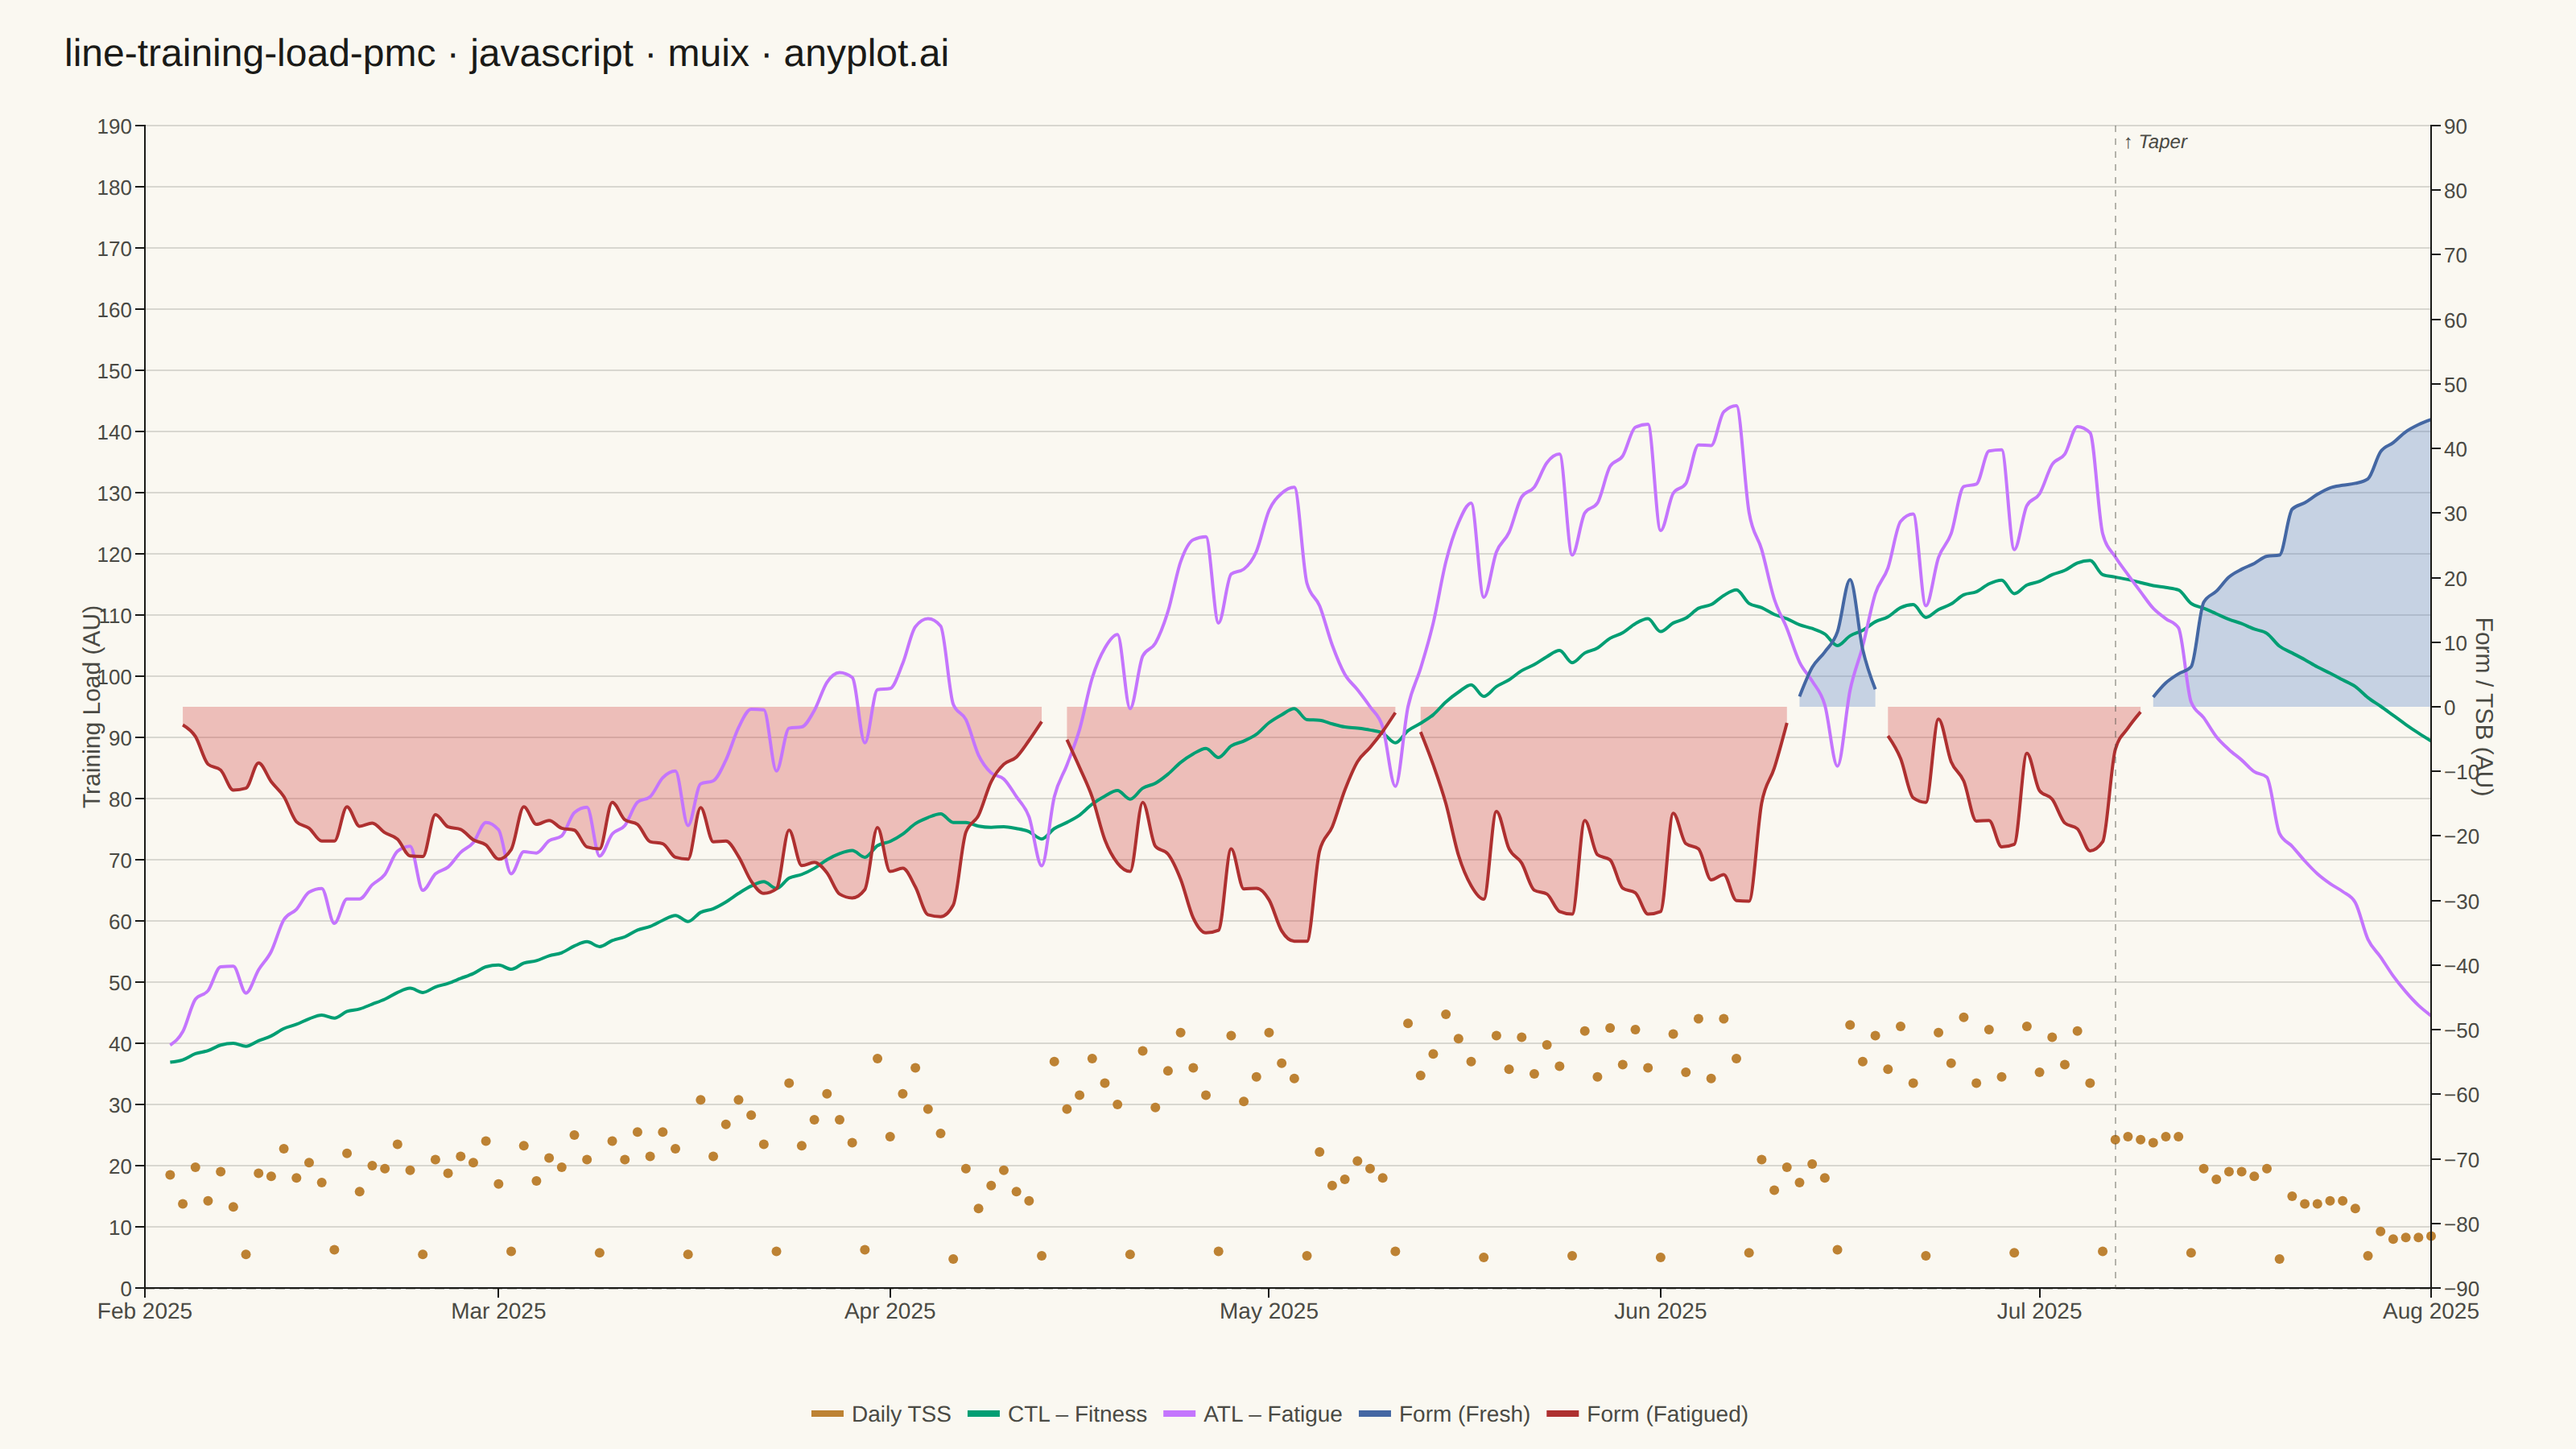
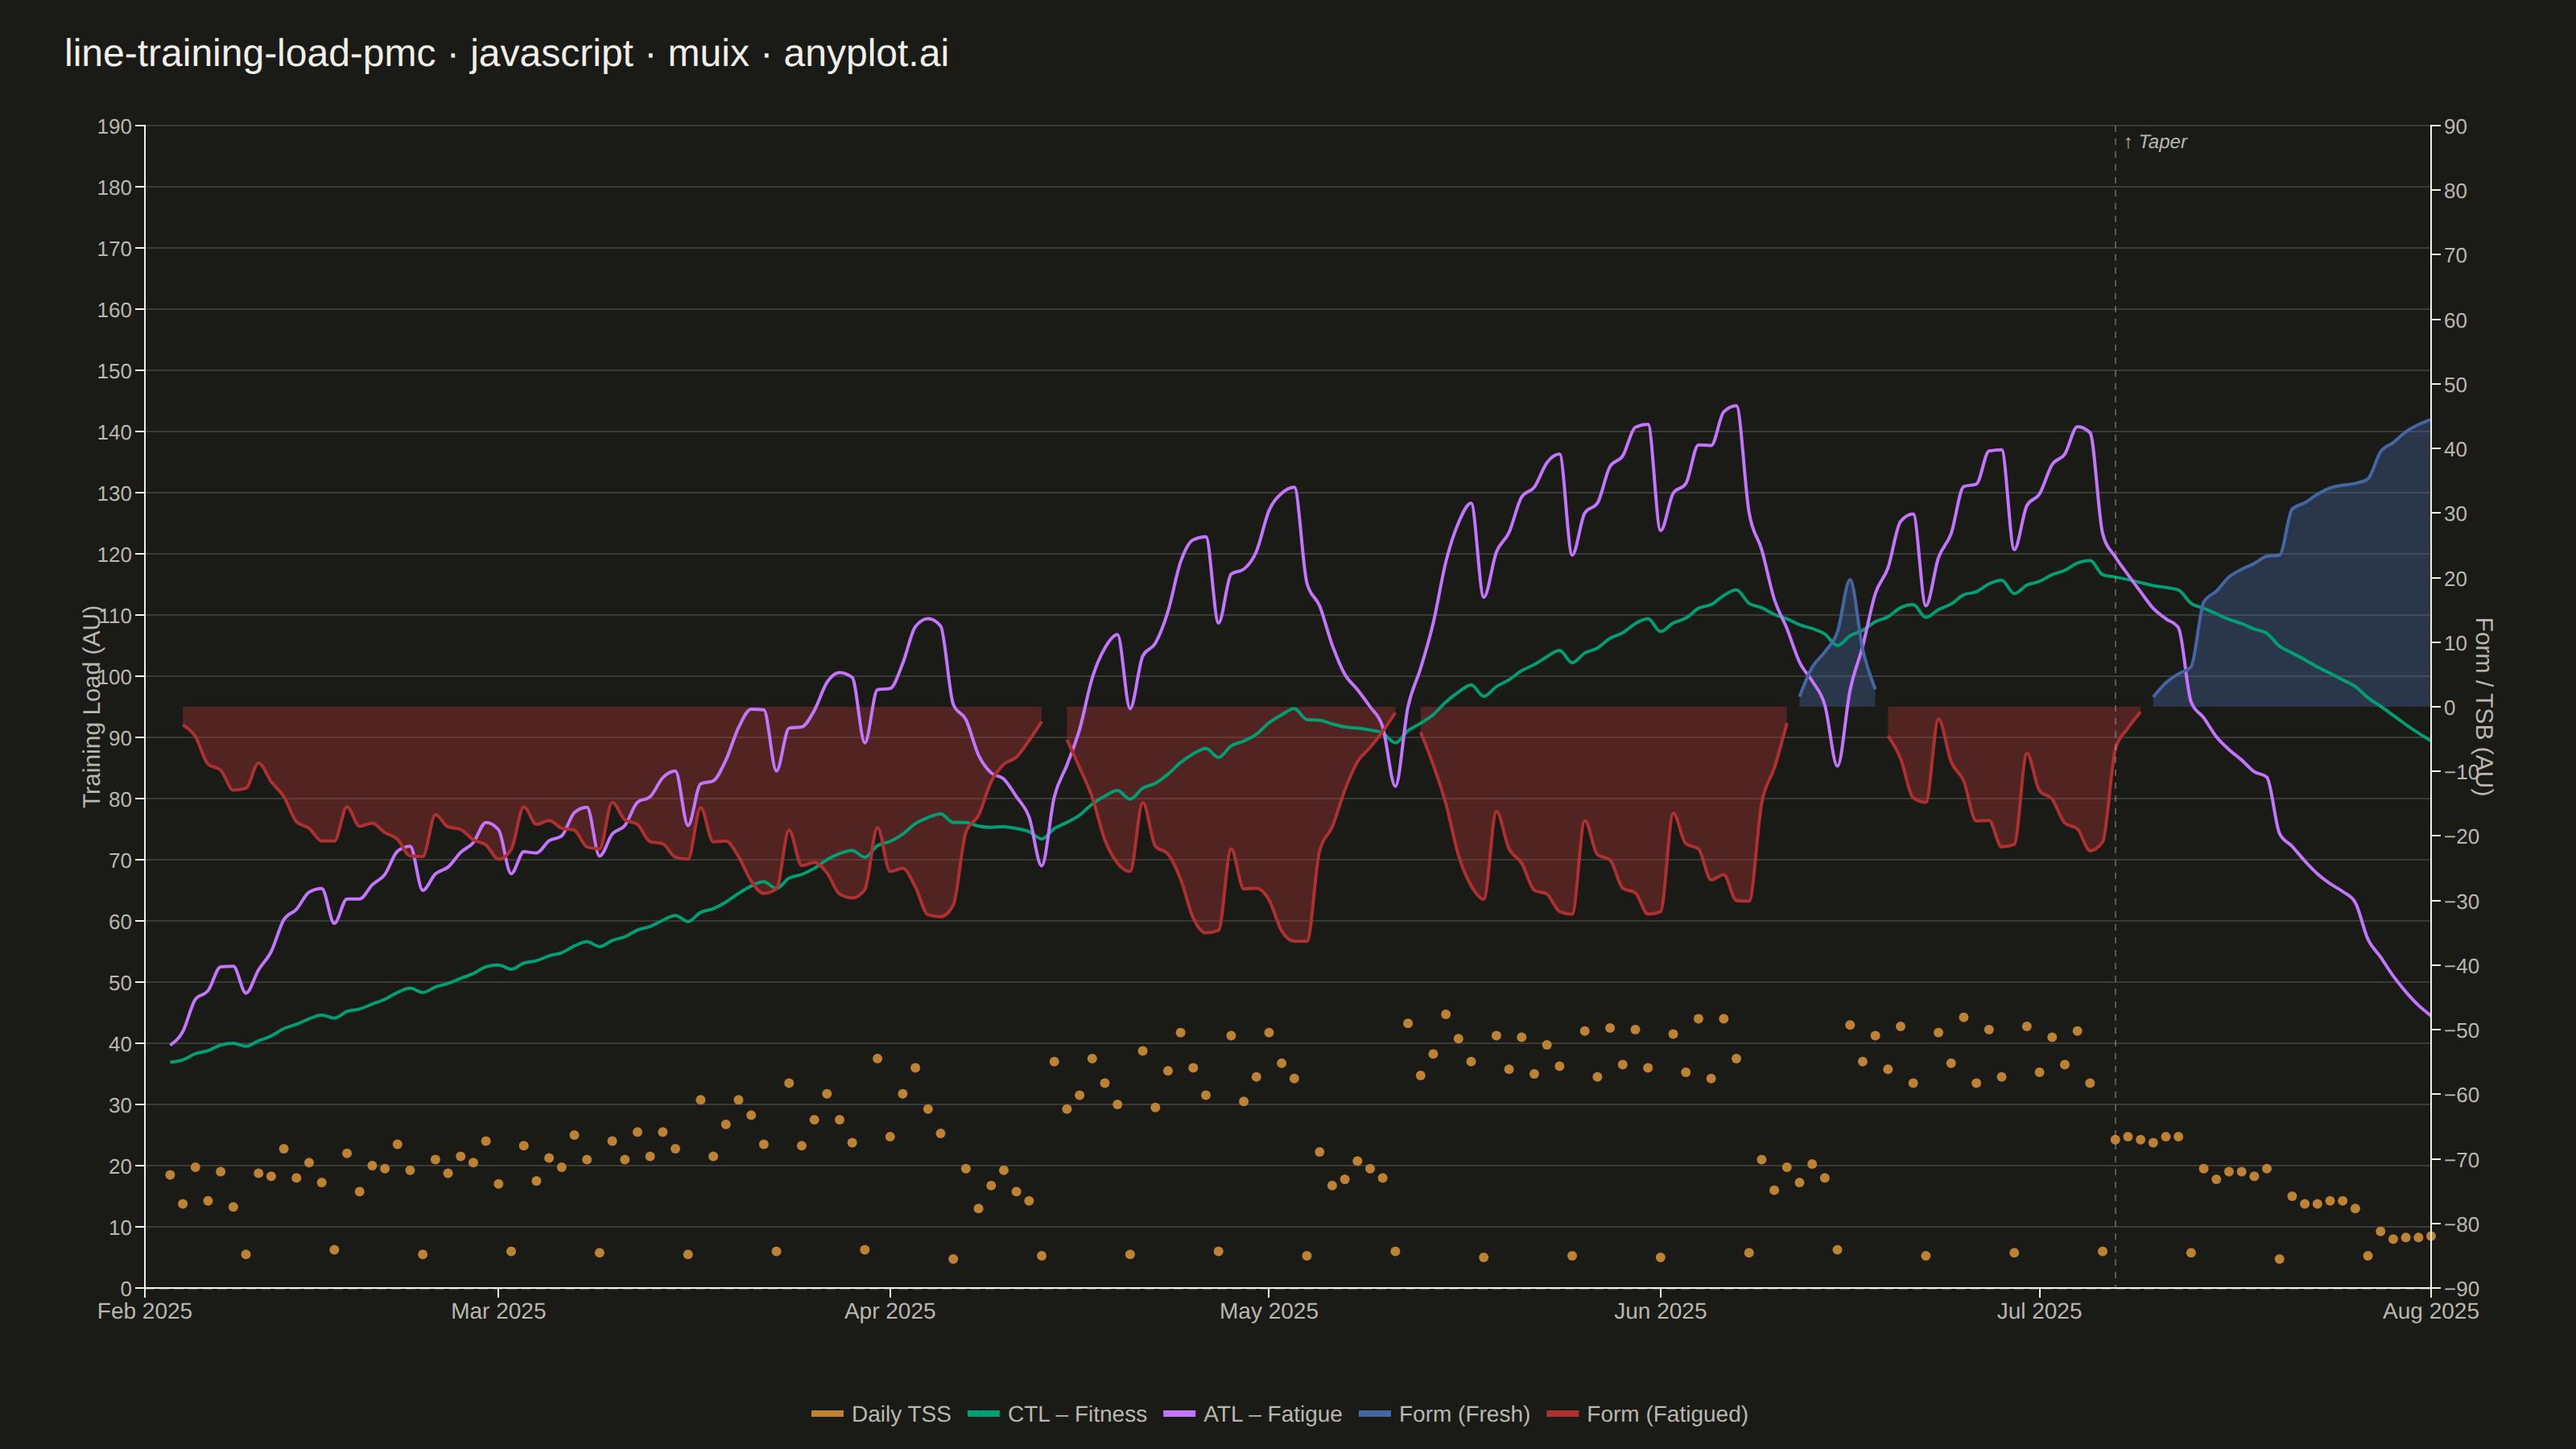
A Performance Management Chart (PMC), popularized by TrainingPeaks, summarizes an endurance athlete's training history on a single shared time axis. Two exponentially-smoothed lines track Chronic Training Load (CTL, "fitness", ~42-day time constant) and Acute Training Load (ATL, "fatigue", ~7-day time constant), while a filled area or band shows Training Stress Balance (TSB, "form" = CTL − ATL) above and below a zero baseline. Daily Training Stress Score (TSS) values appear as points or thin vertical bars, giving the raw workout intensity behind the smoothed trends. The chart reveals whether an athlete is building fitness, accumulating fatigue, or freshening up (positive form) for a target event.
// anyplot.ai
// line-training-load-pmc: Training Load Performance Management Chart
// Library: muix 7.29.1 | JavaScript 22.22.3
// Quality: 91/100 | Created: 2026-06-13

import { ChartContainer } from "@mui/x-charts/ChartContainer";
import { AreaPlot, LinePlot } from "@mui/x-charts/LineChart";
import { ScatterPlot } from "@mui/x-charts/ScatterChart";
import { ChartsXAxis } from "@mui/x-charts/ChartsXAxis";
import { ChartsYAxis } from "@mui/x-charts/ChartsYAxis";
import { ChartsLegend } from "@mui/x-charts/ChartsLegend";
import { ChartsGrid } from "@mui/x-charts/ChartsGrid";
import { ChartsReferenceLine } from "@mui/x-charts/ChartsReferenceLine";
import Box from "@mui/material/Box";
import Typography from "@mui/material/Typography";

const t = window.ANYPLOT_TOKENS;

// --- Deterministic LCG for reproducible synthetic data ---
function lcg(seed) {
  let s = seed >>> 0;
  return () => {
    s = (Math.imul(1664525, s) + 1013904223) >>> 0;
    return s / 4294967295;
  };
}
const rand = lcg(42);

// --- Generate 180-day PMC training data (6-month endurance build to race) ---
const DAYS = 180;
const start = new Date(2025, 1, 3); // 3 Feb 2025
// Taper begins at week 22 (day 154) — where positive form zone opens
const taperDate = new Date(start.getTime() + 154 * 24 * 60 * 60 * 1000);

const dates = [];
const tssData = [];
const ctlData = [];
const atlData = [];
const tsbPos = []; // TSB when form is positive (fresh)
const tsbNeg = []; // TSB when form is negative (fatigued)

let ctl = 36; // starting chronic training load
let atl = 34; // starting acute training load

for (let i = 0; i < DAYS; i++) {
  const d = new Date(start);
  d.setDate(start.getDate() + i);
  dates.push(d);

  const week = Math.floor(i / 7);
  const dow = i % 7; // 0 = Mon … 6 = Sun

  // Phase-structured TSS with realistic training block
  let tss;
  const noise = (rand() - 0.5) * 18;

  if (dow === 6) {
    // Easy Sunday recovery
    tss = Math.round(Math.max(0, 22 + noise * 0.4));
  } else if (week < 6) {
    // Base phase: low-moderate volume, progressive
    tss = Math.round(Math.max(0, 50 + week * 4 + (dow % 2 === 0 ? 28 : 12) + noise));
  } else if (week < 15) {
    // Build phase: progressive overload with recovery every 4th week
    const buildProg = (week - 6) / 9;
    const isRec = (week - 6) % 4 === 3;
    const base = 80 + buildProg * 55;
    const variation = dow % 3 === 0 ? 50 : dow % 2 === 0 ? 28 : 12;
    tss = Math.round(Math.max(0, (base + variation + noise) * (isRec ? 0.5 : 1)));
  } else if (week < 22) {
    // Peak phase: high load with mini-recovery cycles
    const isRec = (week - 15) % 4 === 3;
    tss = Math.round(Math.max(0, (120 + (dow % 2 === 0 ? 48 : 22) + noise) * (isRec ? 0.48 : 1)));
  } else {
    // Taper: 4 weeks of declining load before race
    const tapProg = Math.min(1, (week - 22) / 3.5);
    tss = Math.round(Math.max(10, 95 * (1 - tapProg * 0.72) + noise * 0.5));
  }

  // TSB = previous-day CTL minus previous-day ATL (form available today)
  const tsb = Math.round((ctl - atl) * 10) / 10;

  // Update EWMA with today's TSS (42-day fitness constant, 7-day fatigue constant)
  ctl += (tss - ctl) / 42;
  atl += (tss - atl) / 7;

  tssData.push(tss);
  ctlData.push(Math.round(ctl * 10) / 10);
  atlData.push(Math.round(atl * 10) / 10);
  // Split TSB into positive (fresh) and negative (fatigued) for two-toned area
  tsbPos.push(tsb >= 0 ? tsb : null);
  tsbNeg.push(tsb < 0 ? tsb : null);
}

// TSS as scatter points: {x: Date, y: tss, id} format for ScatterPlot
const tssScatter = dates.map((d, i) => ({ x: d, y: tssData[i], id: i }));

const TITLE = "line-training-load-pmc · javascript · muix · anyplot.ai";
const TITLE_H = 58;
const MONTHS = ["Jan","Feb","Mar","Apr","May","Jun","Jul","Aug","Sep","Oct","Nov","Dec"];

export default function Chart() {
  const W = window.ANYPLOT_SIZE.width;
  const H = window.ANYPLOT_SIZE.height;

  return (
    <Box
      sx={{
        width: W,
        height: H,
        bgcolor: t.pageBg,
        display: "flex",
        flexDirection: "column",
      }}
    >
      {/* Title */}
      <Box
        sx={{
          height: TITLE_H,
          display: "flex",
          alignItems: "center",
          px: "40px",
          pt: "10px",
        }}
      >
        <Typography
          sx={{ color: t.ink, fontSize: "24px", fontWeight: 500, lineHeight: 1 }}
        >
          {TITLE}
        </Typography>
      </Box>

      {/* PMC chart */}
      <ChartContainer
        skipAnimation
        width={W}
        height={H - TITLE_H}
        sx={{
          "& .MuiAreaElement-series-tsbPos": { fillOpacity: 0.3 },
          "& .MuiAreaElement-series-tsbNeg": { fillOpacity: 0.3 },
        }}
        xAxis={[{
          id: "date",
          data: dates,
          scaleType: "time",
          valueFormatter: (v) => {
            const d = new Date(v);
            return `${MONTHS[d.getMonth()]} ${d.getFullYear()}`;
          },
          tickNumber: 6,
        }]}
        yAxis={[
          // Primary left axis: CTL and ATL training load values
          { id: "load", min: 0, max: 190 },
          // Secondary right axis: TSB form (oscillates around 0)
          { id: "tsb",  min: -90, max: 90 },
          // Hidden axis for TSS scatter (scaled so points cluster at bottom quarter)
          { id: "tss",  min: 0, max: 760 },
        ]}
        series={[
          // CTL is first series → receives brand green (Imprint palette position 1)
          {
            id: "ctl",
            type: "line",
            data: ctlData,
            yAxisId: "load",
            label: "CTL – Fitness",
            color: t.palette[0], // #009E73 brand green
            showMark: false,
            curve: "monotoneX",
          },
          {
            id: "atl",
            type: "line",
            data: atlData,
            yAxisId: "load",
            label: "ATL – Fatigue",
            color: t.palette[1], // #C475FD lavender
            showMark: false,
            curve: "monotoneX",
          },
          // TSB split into two-toned areas: blue for fresh, red for fatigued
          {
            id: "tsbPos",
            type: "line",
            data: tsbPos,
            yAxisId: "tsb",
            label: "Form (Fresh)",
            color: t.palette[2], // #4467A3 blue
            area: true,
            showMark: false,
            curve: "monotoneX",
          },
          {
            id: "tsbNeg",
            type: "line",
            data: tsbNeg,
            yAxisId: "tsb",
            label: "Form (Fatigued)",
            color: t.palette[4], // #AE3030 matte red (semantic: bad/fatigue)
            area: true,
            showMark: false,
            curve: "monotoneX",
          },
          // TSS as scatter points — daily raw load shown as light dots near the bottom
          {
            id: "tss",
            type: "scatter",
            data: tssScatter,
            xAxisId: "date",
            yAxisId: "tss",
            label: "Daily TSS",
            color: t.palette[3], // #BD8233 ochre
            markerSize: 3,
          },
        ]}
        margin={{ top: 20, bottom: 100, left: 90, right: 90 }}
      >
        <ChartsGrid horizontal />
        <AreaPlot />
        <LinePlot />
        <ScatterPlot />
        <ChartsXAxis
          axisId="date"
          tickLabelStyle={{ fill: t.inkSoft, fontSize: 14 }}
        />
        <ChartsYAxis
          axisId="load"
          label="Training Load (AU)"
          tickLabelStyle={{ fill: t.inkSoft, fontSize: 13 }}
          labelStyle={{ fill: t.inkSoft, fontSize: 15 }}
        />
        <ChartsYAxis
          axisId="tsb"
          position="right"
          label="Form / TSB (AU)"
          tickLabelStyle={{ fill: t.inkSoft, fontSize: 13 }}
          labelStyle={{ fill: t.inkSoft, fontSize: 15 }}
        />
        {/* TSB = 0 horizontal reference — separates fresh from fatigued zones */}
        <ChartsReferenceLine
          y={0}
          yAxisId="tsb"
          lineStyle={{
            stroke: t.ink,
            strokeOpacity: 0.28,
            strokeDasharray: "6 3",
            strokeWidth: 1.5,
          }}
        />
        {/* Taper start — marks the positive-form window before race day */}
        <ChartsReferenceLine
          x={taperDate}
          xAxisId="date"
          label="↑ Taper"
          labelAlign="start"
          labelStyle={{ fill: t.inkSoft, fontSize: 12, fontStyle: "italic" }}
          lineStyle={{
            stroke: t.inkSoft,
            strokeOpacity: 0.4,
            strokeDasharray: "4 4",
            strokeWidth: 1,
          }}
        />
        <ChartsLegend
          position={{ vertical: "bottom", horizontal: "middle" }}
          slotProps={{
            legend: {
              labelStyle: { fill: t.inkSoft, fontSize: 14 },
              itemMarkWidth: 20,
              itemMarkHeight: 4,
            },
          }}
        />
      </ChartContainer>
    </Box>
  );
}
Runnable source as JSON, for any HTTP client: https://api.anyplot.ai/specs/line-training-load-pmc/muix/code. Any spec id and library id listed in llms-full.txt fit the same URL shape; every URL below is complete and callable.
{
  "spec_id": "line-training-load-pmc",
  "language": "javascript",
  "library": "muix",
  "page": "https://anyplot.ai/line-training-load-pmc/javascript/muix",
  "hub": "https://anyplot.ai/line-training-load-pmc",
  "code_json": "https://api.anyplot.ai/specs/line-training-load-pmc/muix/code",
  "spec_json": "https://api.anyplot.ai/specs/line-training-load-pmc",
  "render_light_png": "https://storage.googleapis.com/anyplot-images/plots/line-training-load-pmc/javascript/muix/plot-light.png",
  "render_dark_png": "https://storage.googleapis.com/anyplot-images/plots/line-training-load-pmc/javascript/muix/plot-dark.png",
  "interactive_light_html": "https://storage.googleapis.com/anyplot-images/plots/line-training-load-pmc/javascript/muix/plot-light.html",
  "interactive_dark_html": "https://storage.googleapis.com/anyplot-images/plots/line-training-load-pmc/javascript/muix/plot-dark.html",
  "quality_score": 91.0,
  "license": "MIT",
  "guide": "https://anyplot.ai/llms.txt"
}
Part of Training Load Performance Management Chart on anyplot.ai.