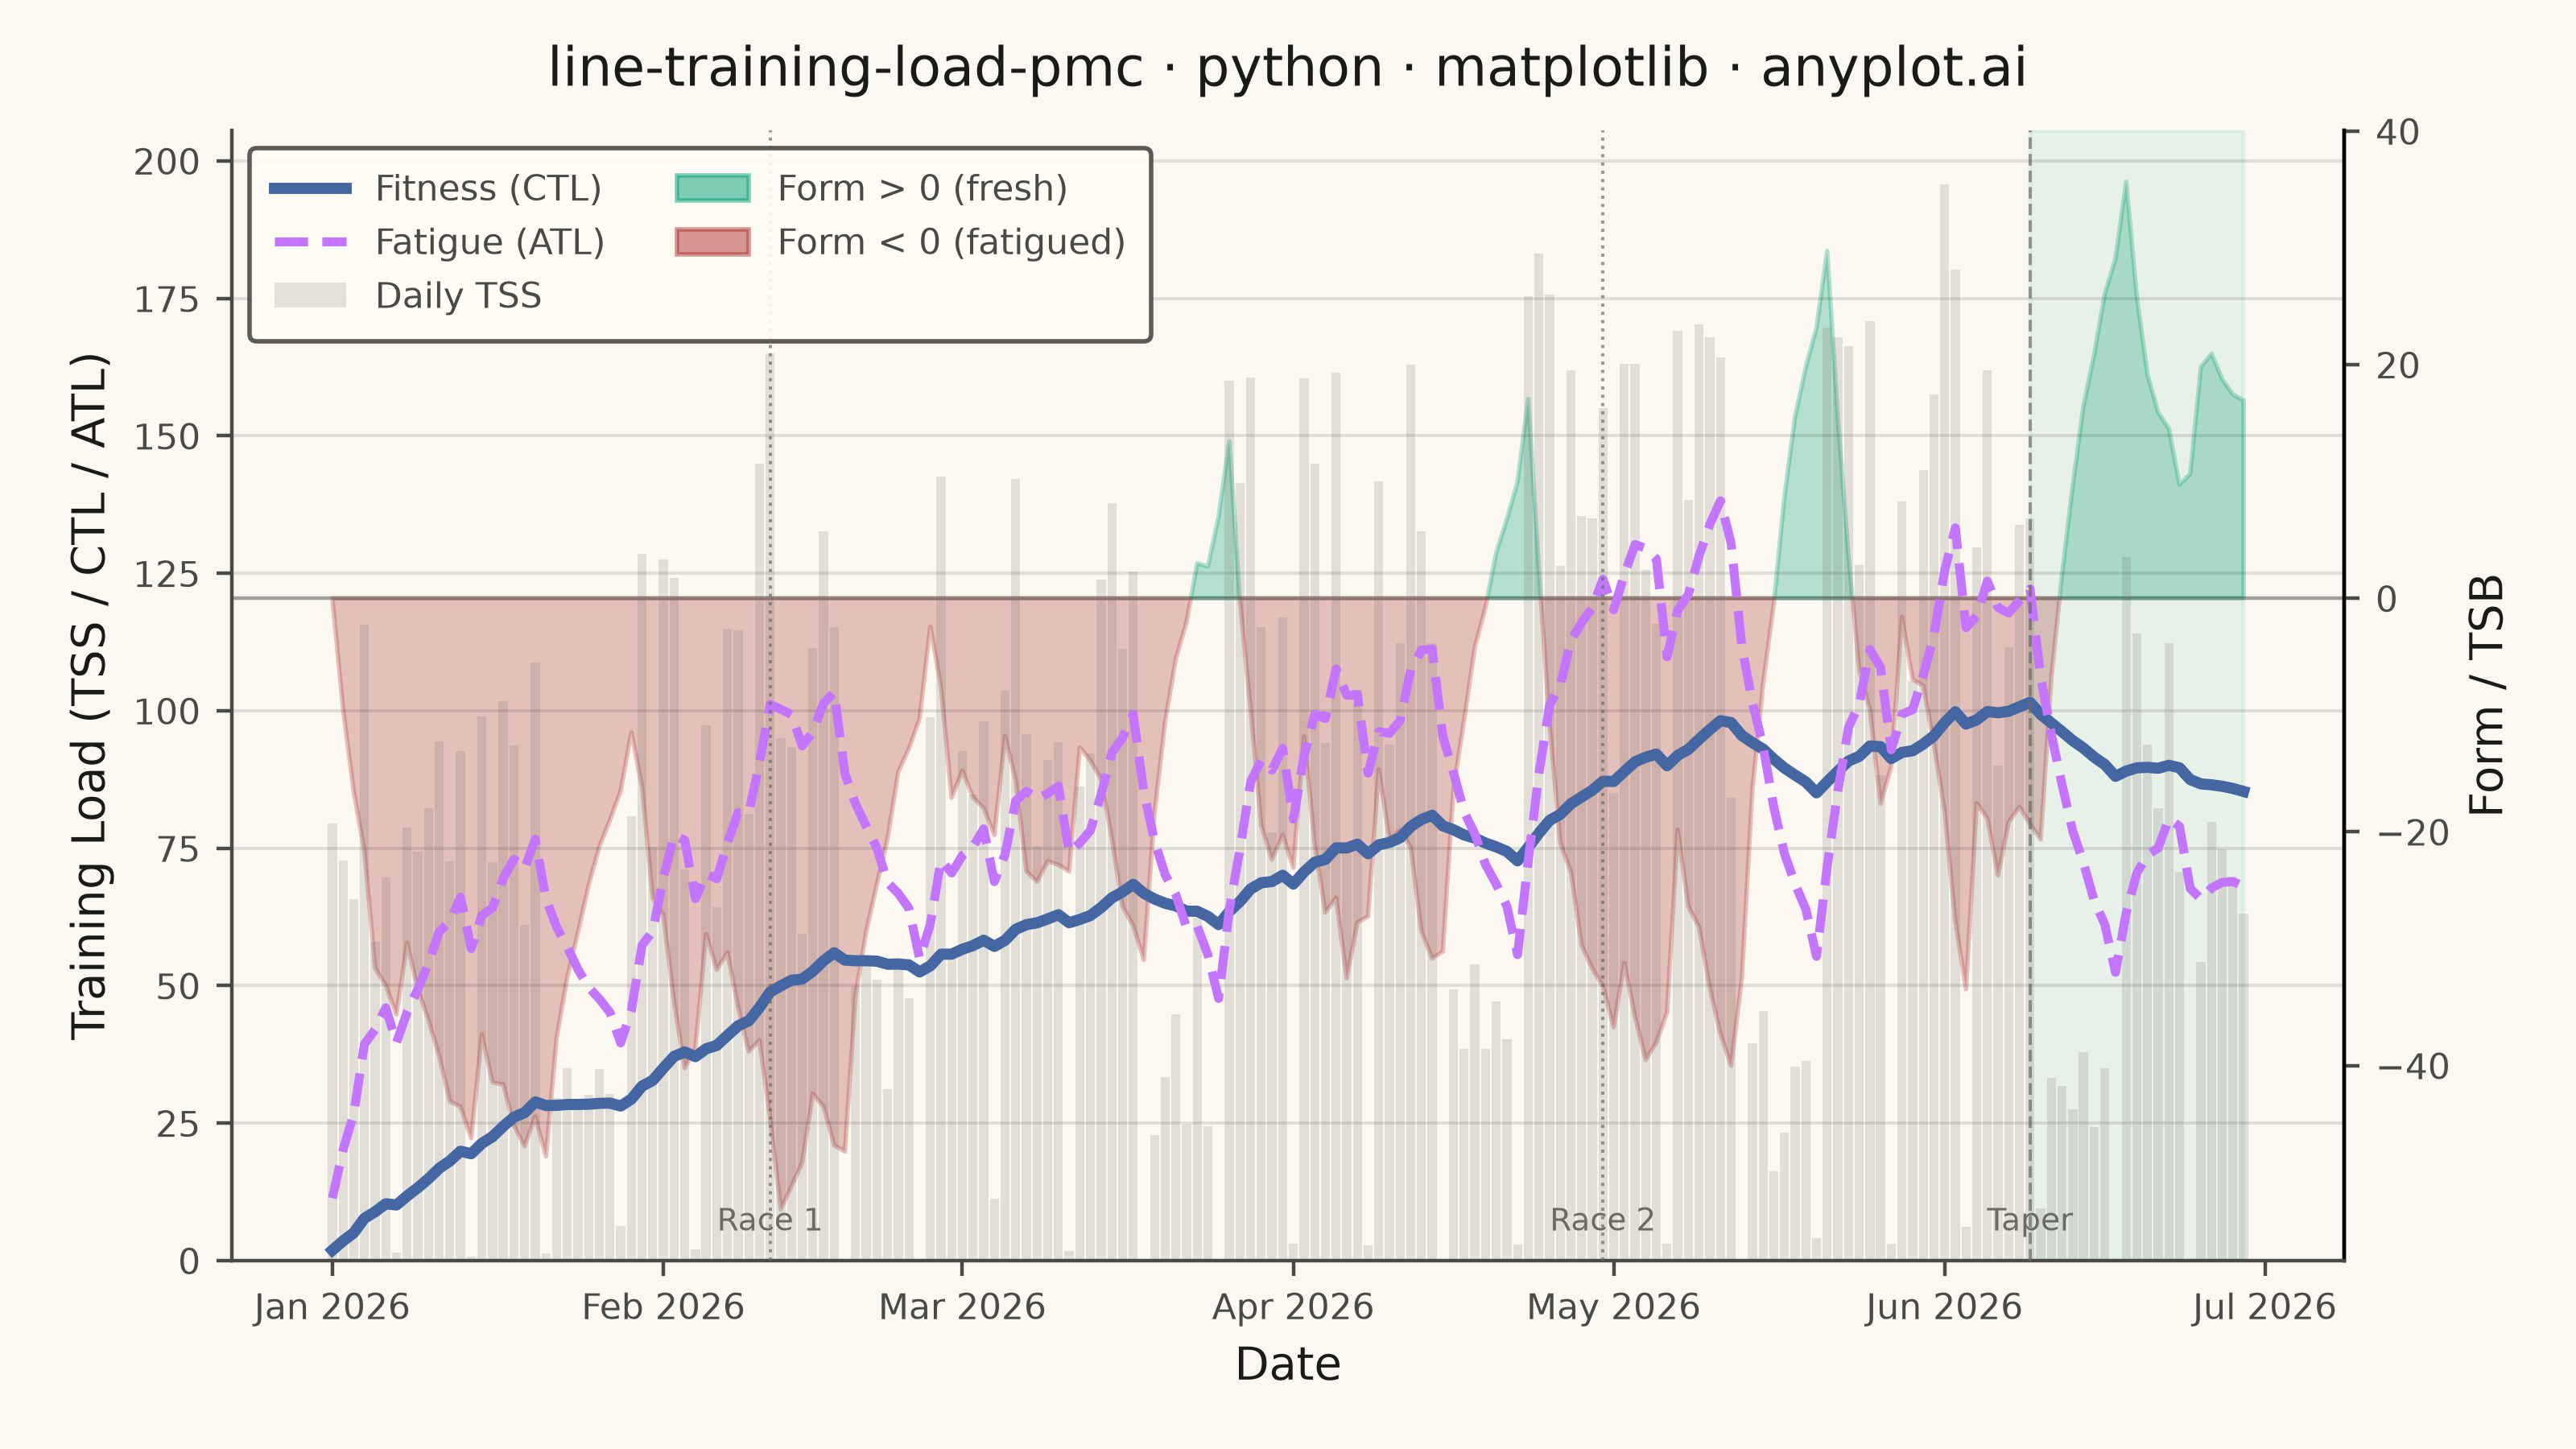
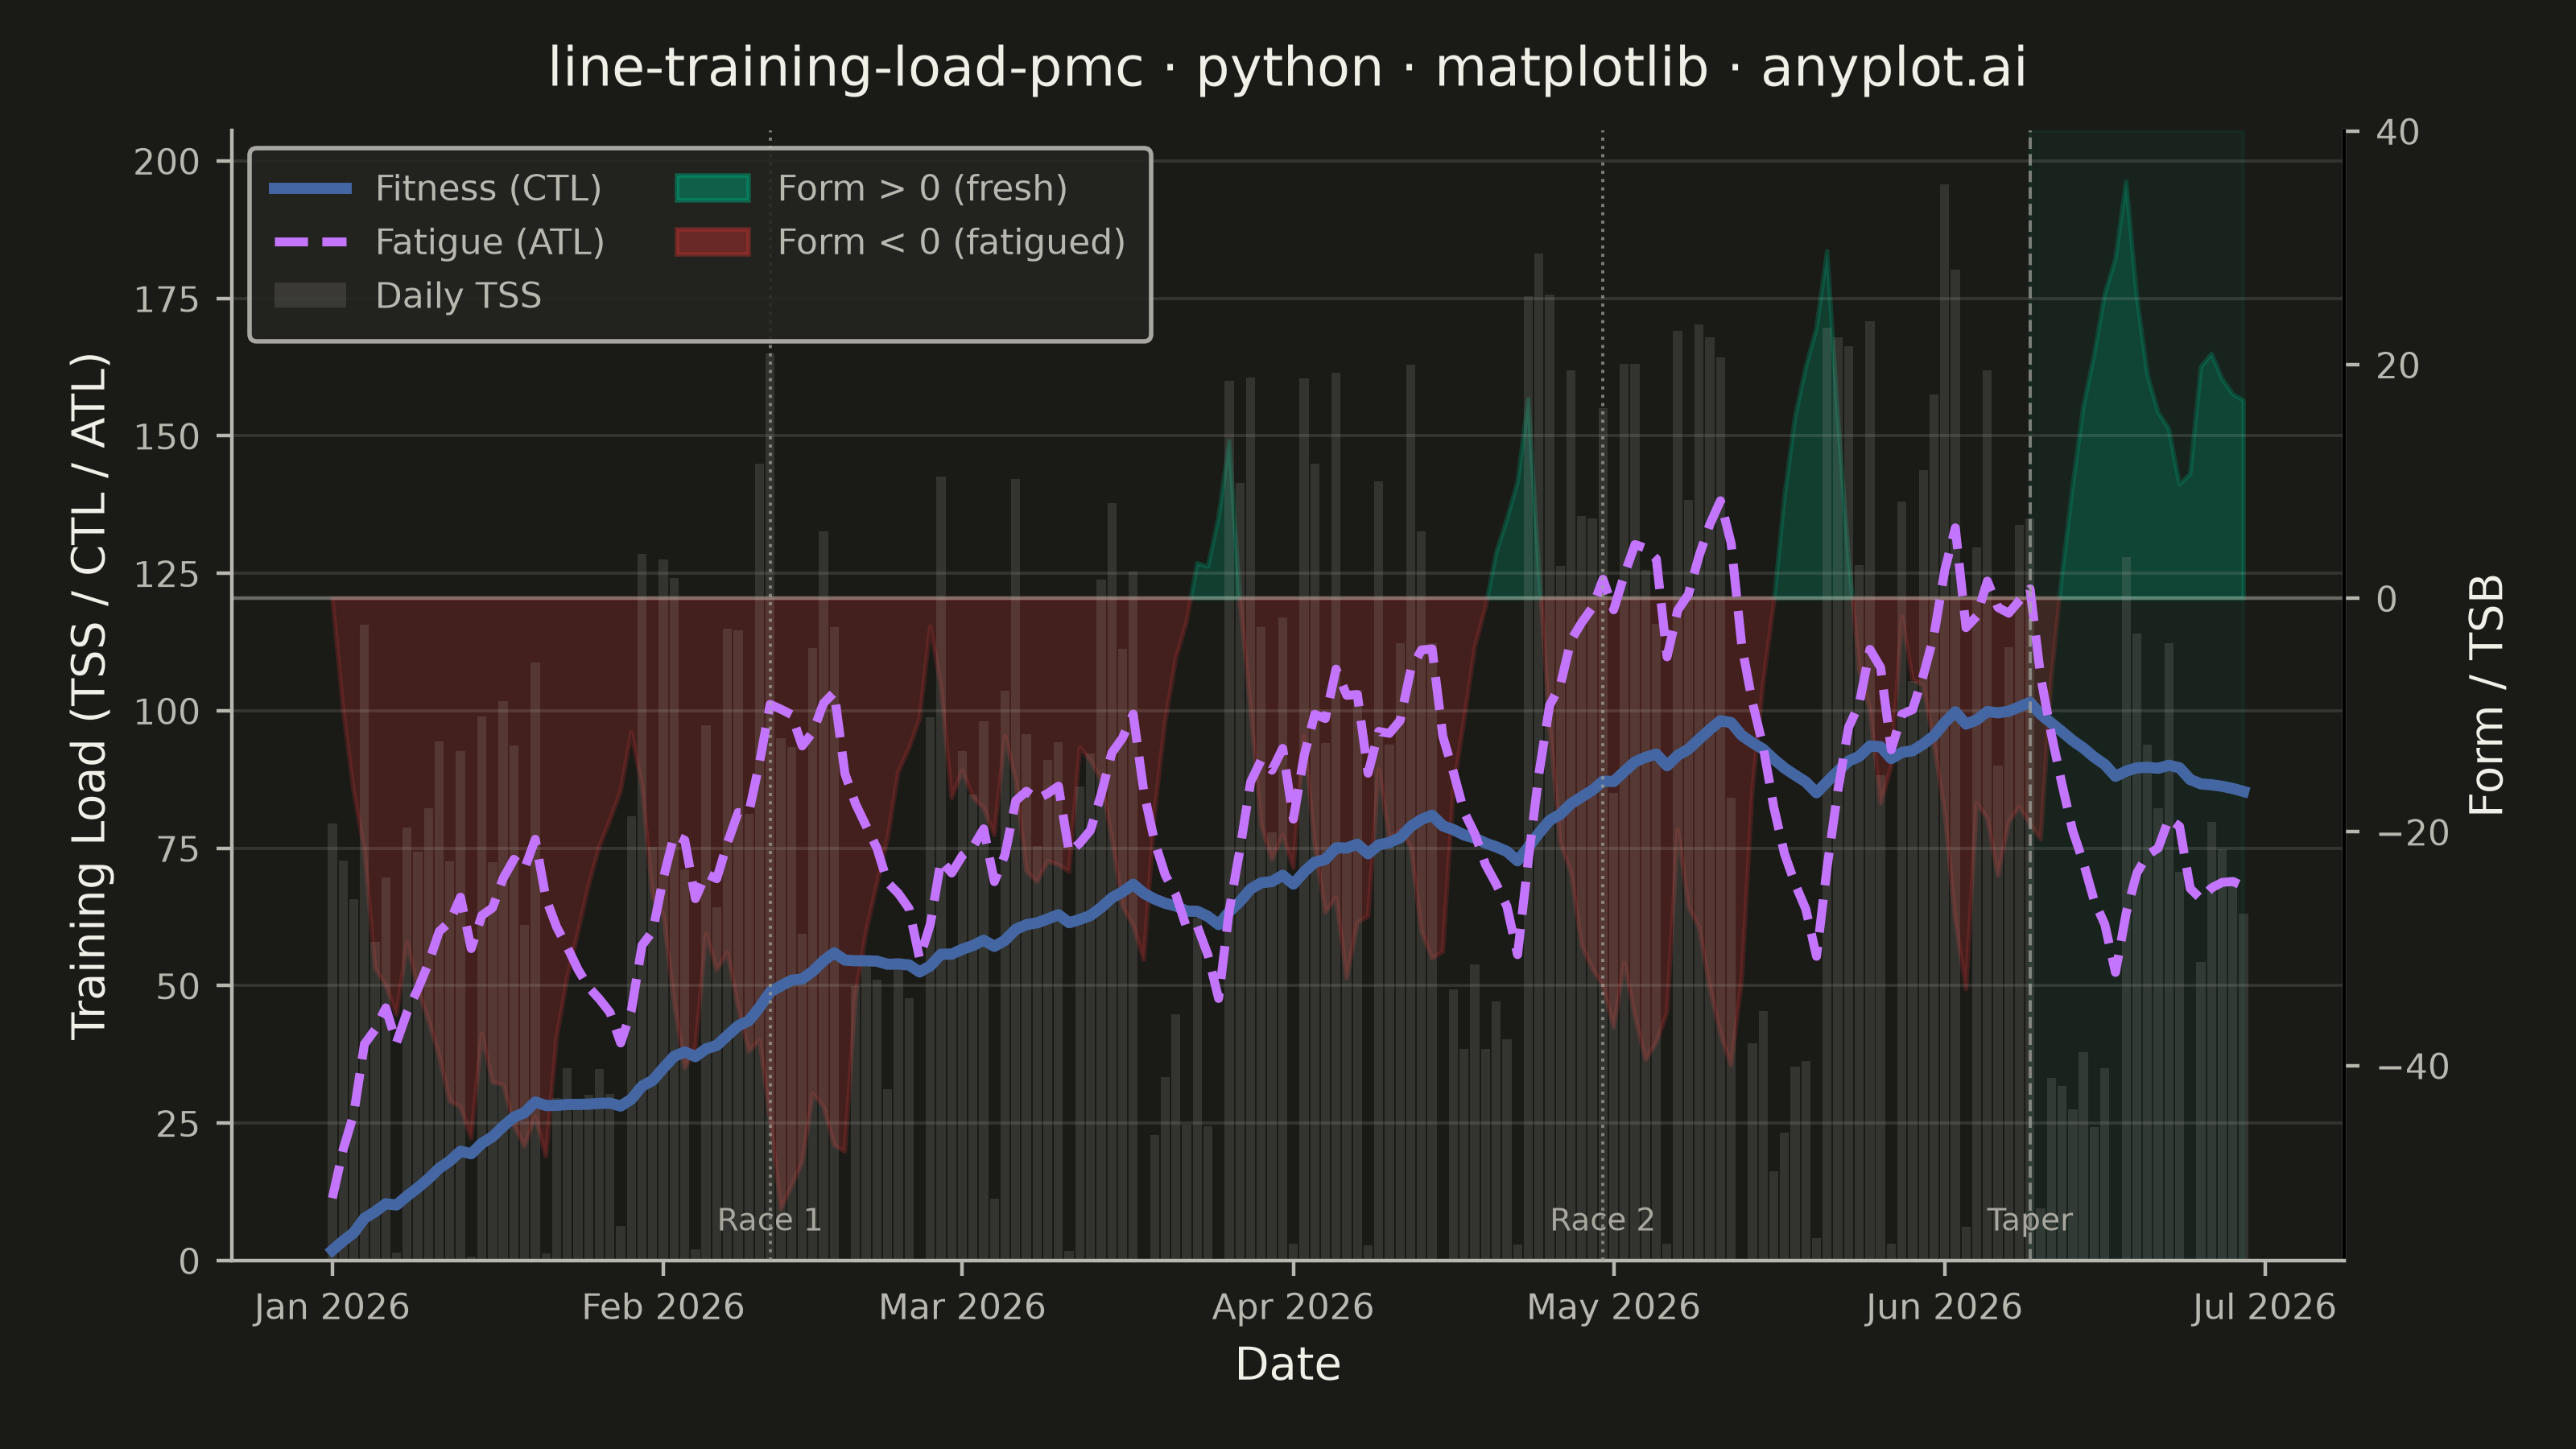
A Performance Management Chart (PMC), popularized by TrainingPeaks, summarizes an endurance athlete's training history on a single shared time axis. Two exponentially-smoothed lines track Chronic Training Load (CTL, "fitness", ~42-day time constant) and Acute Training Load (ATL, "fatigue", ~7-day time constant), while a filled area or band shows Training Stress Balance (TSB, "form" = CTL − ATL) above and below a zero baseline. Daily Training Stress Score (TSS) values appear as points or thin vertical bars, giving the raw workout intensity behind the smoothed trends. The chart reveals whether an athlete is building fitness, accumulating fatigue, or freshening up (positive form) for a target event.
""" anyplot.ai
line-training-load-pmc: Training Load Performance Management Chart
Library: matplotlib 3.11.0 | Python 3.13.13
Quality: 90/100 | Created: 2026-06-13
"""

import os
import sys


# Prevent this file from shadowing the installed matplotlib package
_here = os.path.dirname(os.path.abspath(__file__))
if sys.path and sys.path[0] == _here:
    sys.path.pop(0)

import matplotlib.dates as mdates
import matplotlib.pyplot as plt
import numpy as np
import pandas as pd
from matplotlib.patches import Patch


# Theme tokens
THEME = os.getenv("ANYPLOT_THEME", "light")
PAGE_BG = "#FAF8F1" if THEME == "light" else "#1A1A17"
ELEVATED_BG = "#FFFDF6" if THEME == "light" else "#242420"
INK = "#1A1A17" if THEME == "light" else "#F0EFE8"
INK_SOFT = "#4A4A44" if THEME == "light" else "#B8B7B0"
INK_MUTED = "#6B6A63" if THEME == "light" else "#A8A79F"

# Imprint palette — semantic assignments for endurance-training domain convention
COLOR_CTL = "#4467A3"  # blue     → Fitness / Chronic Training Load
COLOR_ATL = "#C475FD"  # lavender → Fatigue / Acute Training Load
COLOR_TSB_POS = "#009E73"  # green    → positive form (fresh, rested)
COLOR_TSB_NEG = "#AE3030"  # matte red → negative form (fatigued, overloaded)

# Data — 180-day cycling training block (1 Jan – 29 Jun 2026)
np.random.seed(42)
n_days = 180
dates = pd.date_range("2026-01-01", periods=n_days, freq="D")

# Periodized TSS: 3 build weeks + 1 recovery, progressive loading per mesocycle
tss = np.zeros(n_days)
for i in range(n_days):
    week = i // 7
    cycle_week = week % 4  # 0,1,2 = build; 3 = recovery
    dow = i % 7  # 6 = Sunday rest day
    mesocycle = week // 4  # progressive overload tier (0–5)

    if dow == 6:
        daily = 0.0
    elif cycle_week == 3:
        daily = np.random.uniform(25, 55)
    else:
        overload = min(1.0 + mesocycle * 0.10, 1.5)
        daily = np.random.uniform(60, 130) * overload
    tss[i] = max(0.0, daily + np.random.normal(0, 6))

# Two 3-day stage races with high-TSS peaks
tss[40:43] = [145.0, 165.0, 95.0]
tss[118:121] = [135.0, 155.0, 85.0]

# Taper: last 21 days — progressive TSS reduction for race-day freshness
for i in range(n_days - 21, n_days):
    factor = (i - (n_days - 21)) / 21.0
    tss[i] = max(0.0, tss[i] * (1.0 - 0.65 * factor))

# EWMA: CTL (42-day), ATL (7-day); TSB = previous-day CTL − ATL
ctl = np.zeros(n_days)
atl = np.zeros(n_days)
tsb = np.zeros(n_days)
ctl[0] = tss[0] / 42.0
atl[0] = tss[0] / 7.0

for i in range(1, n_days):
    tsb[i] = ctl[i - 1] - atl[i - 1]
    ctl[i] = tss[i] / 42.0 + ctl[i - 1] * (1.0 - 1.0 / 42.0)
    atl[i] = tss[i] / 7.0 + atl[i - 1] * (1.0 - 1.0 / 7.0)

# Plot — landscape 3200×1800 px
fig, ax1 = plt.subplots(figsize=(8, 4.5), dpi=400, facecolor=PAGE_BG)
ax1.set_facecolor(PAGE_BG)

# Secondary axis for TSB — rendered behind primary via z-order trick
ax2 = ax1.twinx()
ax2.set_facecolor(PAGE_BG)
ax2.set_zorder(ax1.get_zorder() - 1)
ax1.patch.set_visible(False)

# TSB filled areas on secondary axis
ax2.axhline(0, color=INK_SOFT, linewidth=0.8, alpha=0.5)
ax2.fill_between(dates, tsb, 0, where=(tsb >= 0), color=COLOR_TSB_POS, alpha=0.28, interpolate=True)
ax2.fill_between(dates, tsb, 0, where=(tsb < 0), color=COLOR_TSB_NEG, alpha=0.28, interpolate=True)

# Daily TSS bars on primary axis (subordinate layer — raw input)
ax1.bar(dates, tss, width=0.85, color=INK_MUTED, alpha=0.18, label="Daily TSS", zorder=2)

# CTL and ATL smooth lines on primary axis
ax1.plot(dates, ctl, color=COLOR_CTL, linewidth=2.5, label="Fitness (CTL)", zorder=4)
ax1.plot(dates, atl, color=COLOR_ATL, linewidth=2.0, linestyle="--", label="Fatigue (ATL)", zorder=4)

# Event annotations — race blocks and taper onset
taper_start_date = dates[n_days - 21]
ax1.axvspan(taper_start_date, dates[-1], alpha=0.07, color=COLOR_TSB_POS, zorder=1)

for event_date, label, ls in [
    (dates[41], "Race 1", ":"),
    (dates[119], "Race 2", ":"),
    (taper_start_date, "Taper", "--"),
]:
    ax1.axvline(event_date, color=INK_MUTED, linewidth=0.7, linestyle=ls, alpha=0.7, zorder=5)
    ax1.text(
        event_date,
        0.02,
        label,
        fontsize=7,
        color=INK_MUTED,
        ha="center",
        va="bottom",
        transform=ax1.get_xaxis_transform(),
    )

# Style — primary axis
title = "line-training-load-pmc · python · matplotlib · anyplot.ai"
n = len(title)
title_fs = max(8, round(12 * 67 / n)) if n > 67 else 12

ax1.set_title(title, fontsize=title_fs, fontweight="medium", color=INK, pad=10)
ax1.set_xlabel("Date", fontsize=10, color=INK)
ax1.set_ylabel("Training Load (TSS / CTL / ATL)", fontsize=10, color=INK)
ax1.tick_params(axis="both", labelsize=8, colors=INK_SOFT, labelcolor=INK_SOFT)
ax1.xaxis.set_major_formatter(mdates.DateFormatter("%b %Y"))
ax1.xaxis.set_major_locator(mdates.MonthLocator())
ax1.set_ylim(bottom=0)

ax1.spines["top"].set_visible(False)
for sp in ("left", "bottom"):
    ax1.spines[sp].set_color(INK_SOFT)
ax1.yaxis.grid(True, alpha=0.12, linewidth=0.7, color=INK, zorder=0)

# Style — secondary axis
ax2.set_ylabel("Form / TSB", fontsize=10, color=INK)
ax2.tick_params(axis="y", labelsize=8, colors=INK_SOFT, labelcolor=INK_SOFT)
for sp in ("top", "left", "bottom"):
    ax2.spines[sp].set_visible(False)
ax2.spines["right"].set_color(INK_SOFT)

# Combined legend with patches for TSB fills
tsb_pos_patch = Patch(color=COLOR_TSB_POS, alpha=0.5, label="Form > 0 (fresh)")
tsb_neg_patch = Patch(color=COLOR_TSB_NEG, alpha=0.5, label="Form < 0 (fatigued)")
h1, l1 = ax1.get_legend_handles_labels()
all_handles = h1 + [tsb_pos_patch, tsb_neg_patch]
all_labels = l1 + ["Form > 0 (fresh)", "Form < 0 (fatigued)"]

leg = ax1.legend(all_handles, all_labels, fontsize=8, loc="upper left", ncol=2, framealpha=0.9, borderpad=0.7)
leg.get_frame().set_facecolor(ELEVATED_BG)
leg.get_frame().set_edgecolor(INK_SOFT)
plt.setp(leg.get_texts(), color=INK_SOFT)

# Layout — space for twin y-axis labels on both sides
fig.subplots_adjust(left=0.09, right=0.91, top=0.91, bottom=0.13)

# Save
plt.savefig(f"plot-{THEME}.png", dpi=400, facecolor=PAGE_BG)
plt.close()
Runnable source as JSON, for any HTTP client: https://api.anyplot.ai/specs/line-training-load-pmc/matplotlib/code. Any spec id and library id listed in llms-full.txt fit the same URL shape; every URL below is complete and callable.
{
  "spec_id": "line-training-load-pmc",
  "language": "python",
  "library": "matplotlib",
  "page": "https://anyplot.ai/line-training-load-pmc/python/matplotlib",
  "hub": "https://anyplot.ai/line-training-load-pmc",
  "code_json": "https://api.anyplot.ai/specs/line-training-load-pmc/matplotlib/code",
  "spec_json": "https://api.anyplot.ai/specs/line-training-load-pmc",
  "render_light_png": "https://storage.googleapis.com/anyplot-images/plots/line-training-load-pmc/python/matplotlib/plot-light.png",
  "render_dark_png": "https://storage.googleapis.com/anyplot-images/plots/line-training-load-pmc/python/matplotlib/plot-dark.png",
  "quality_score": 90.0,
  "license": "MIT",
  "guide": "https://anyplot.ai/llms.txt"
}
Part of Training Load Performance Management Chart on anyplot.ai.