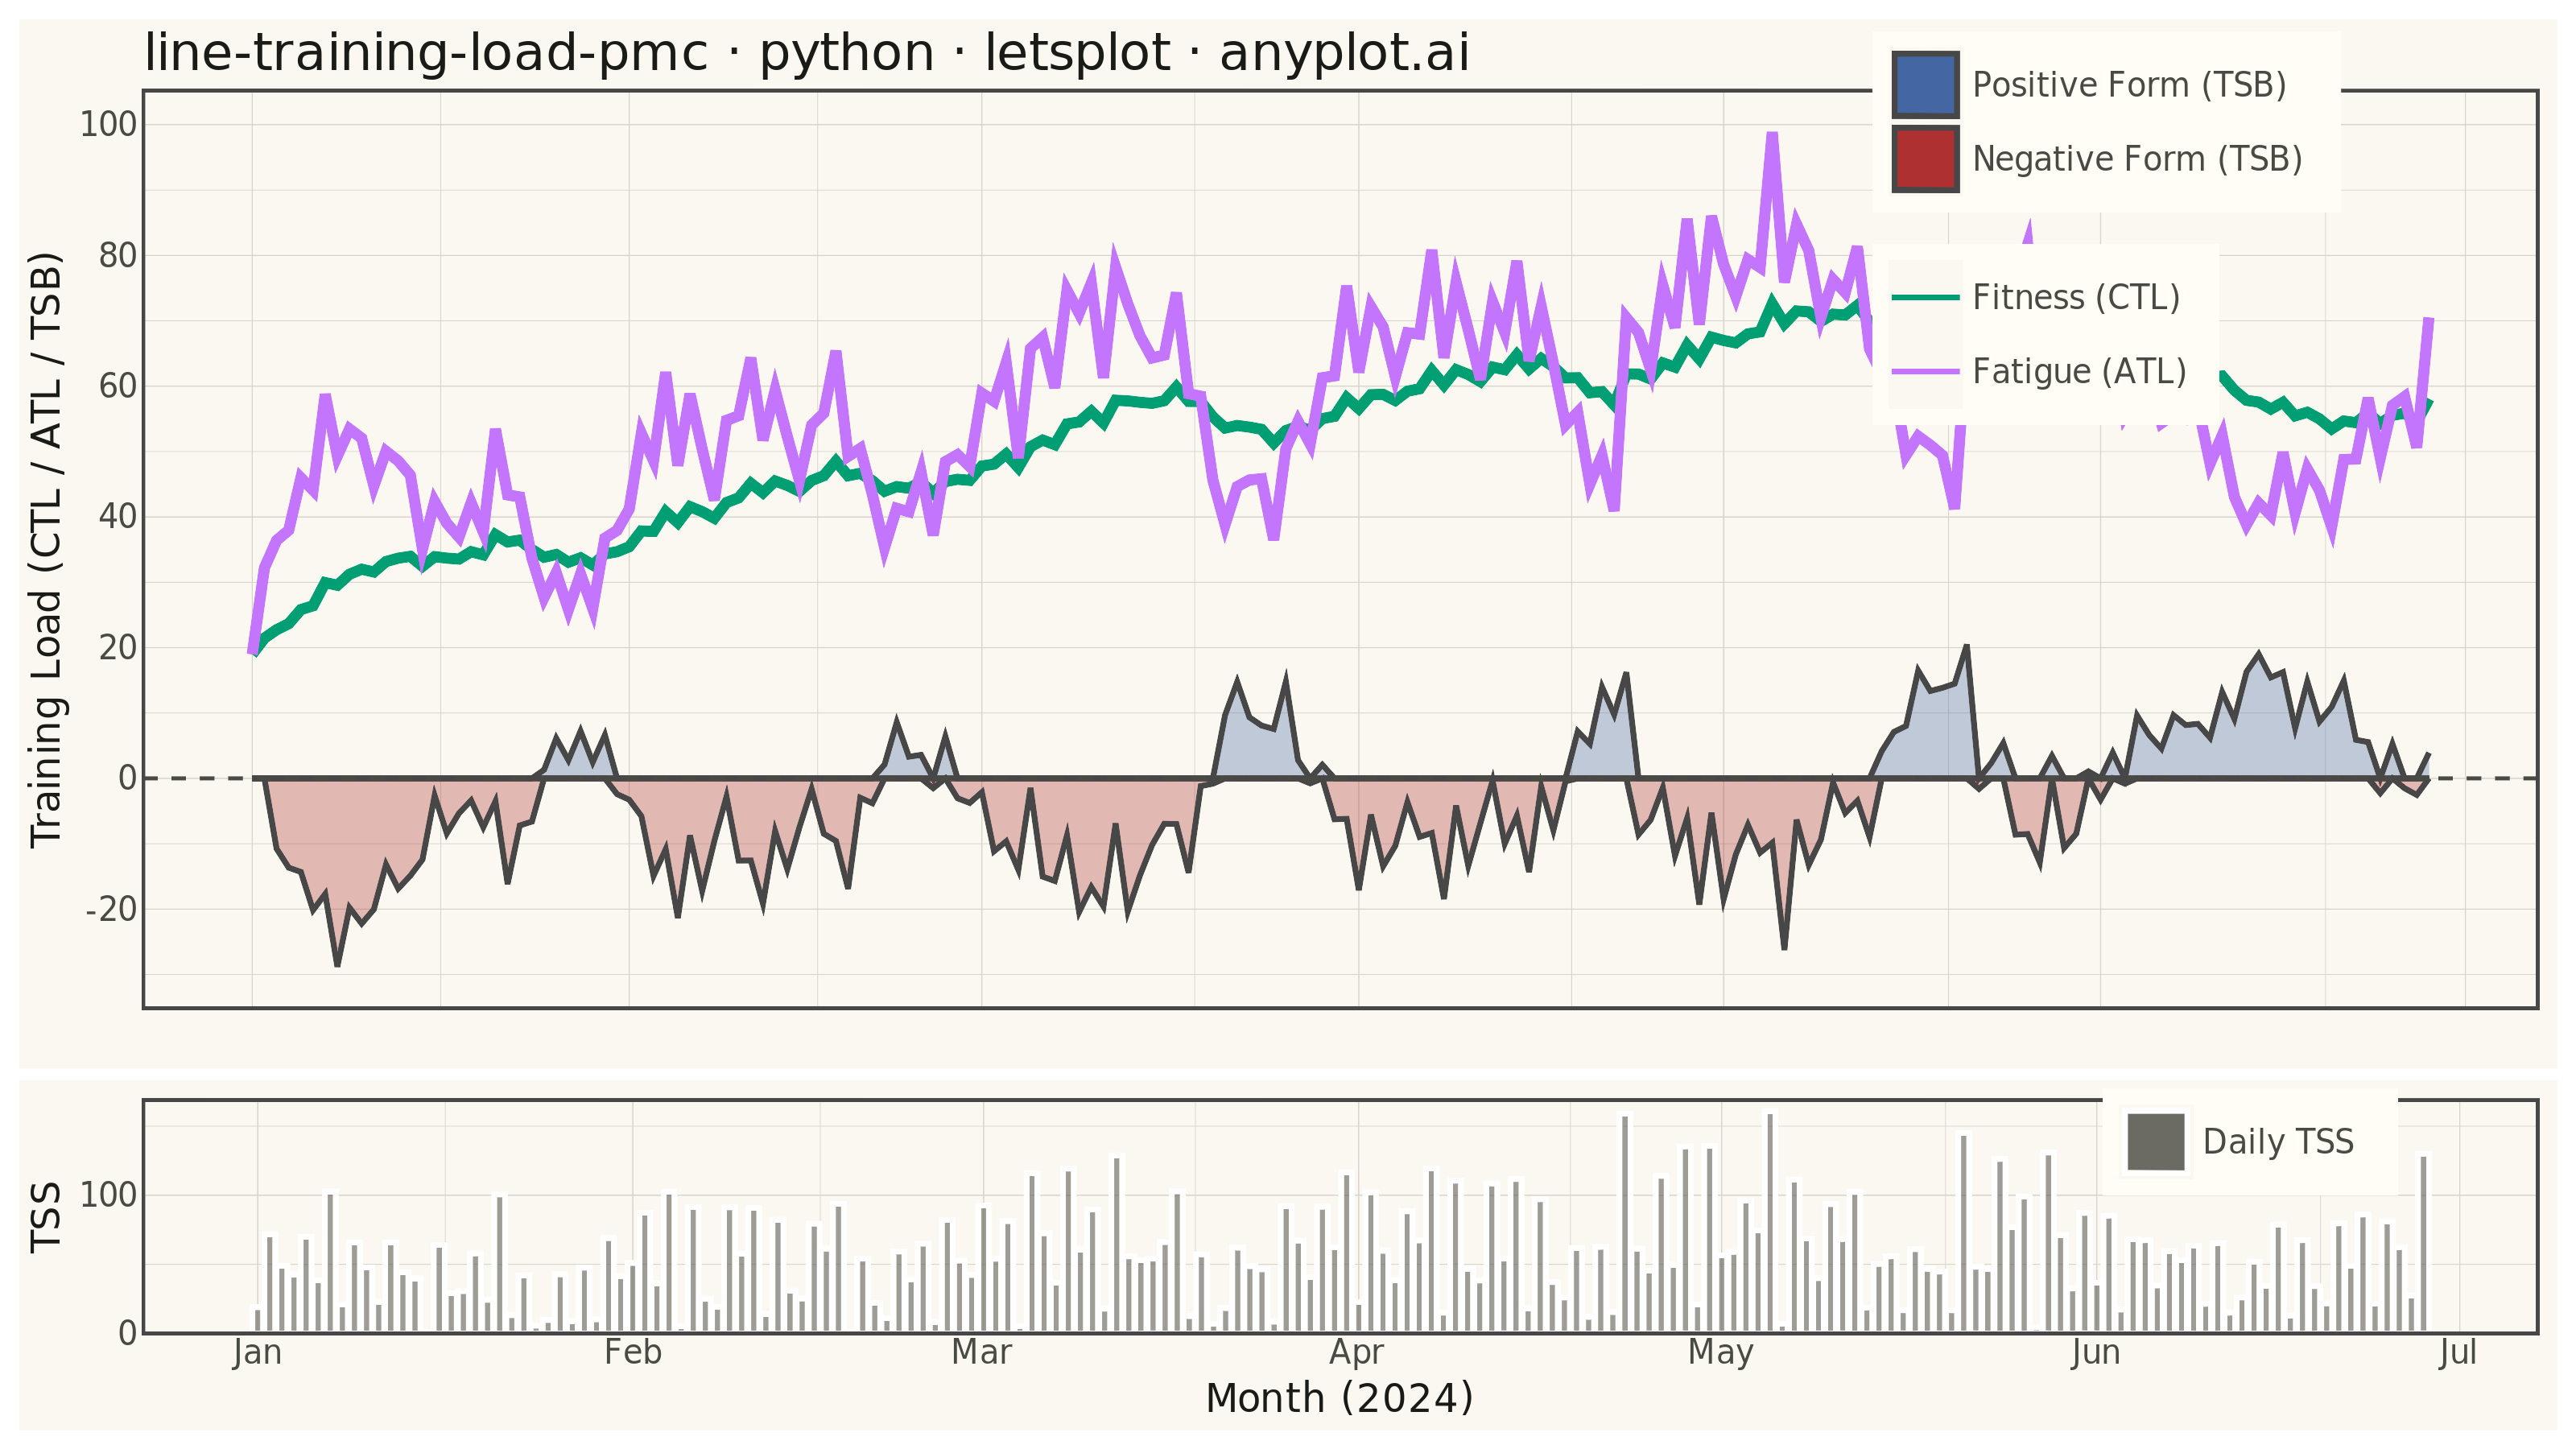
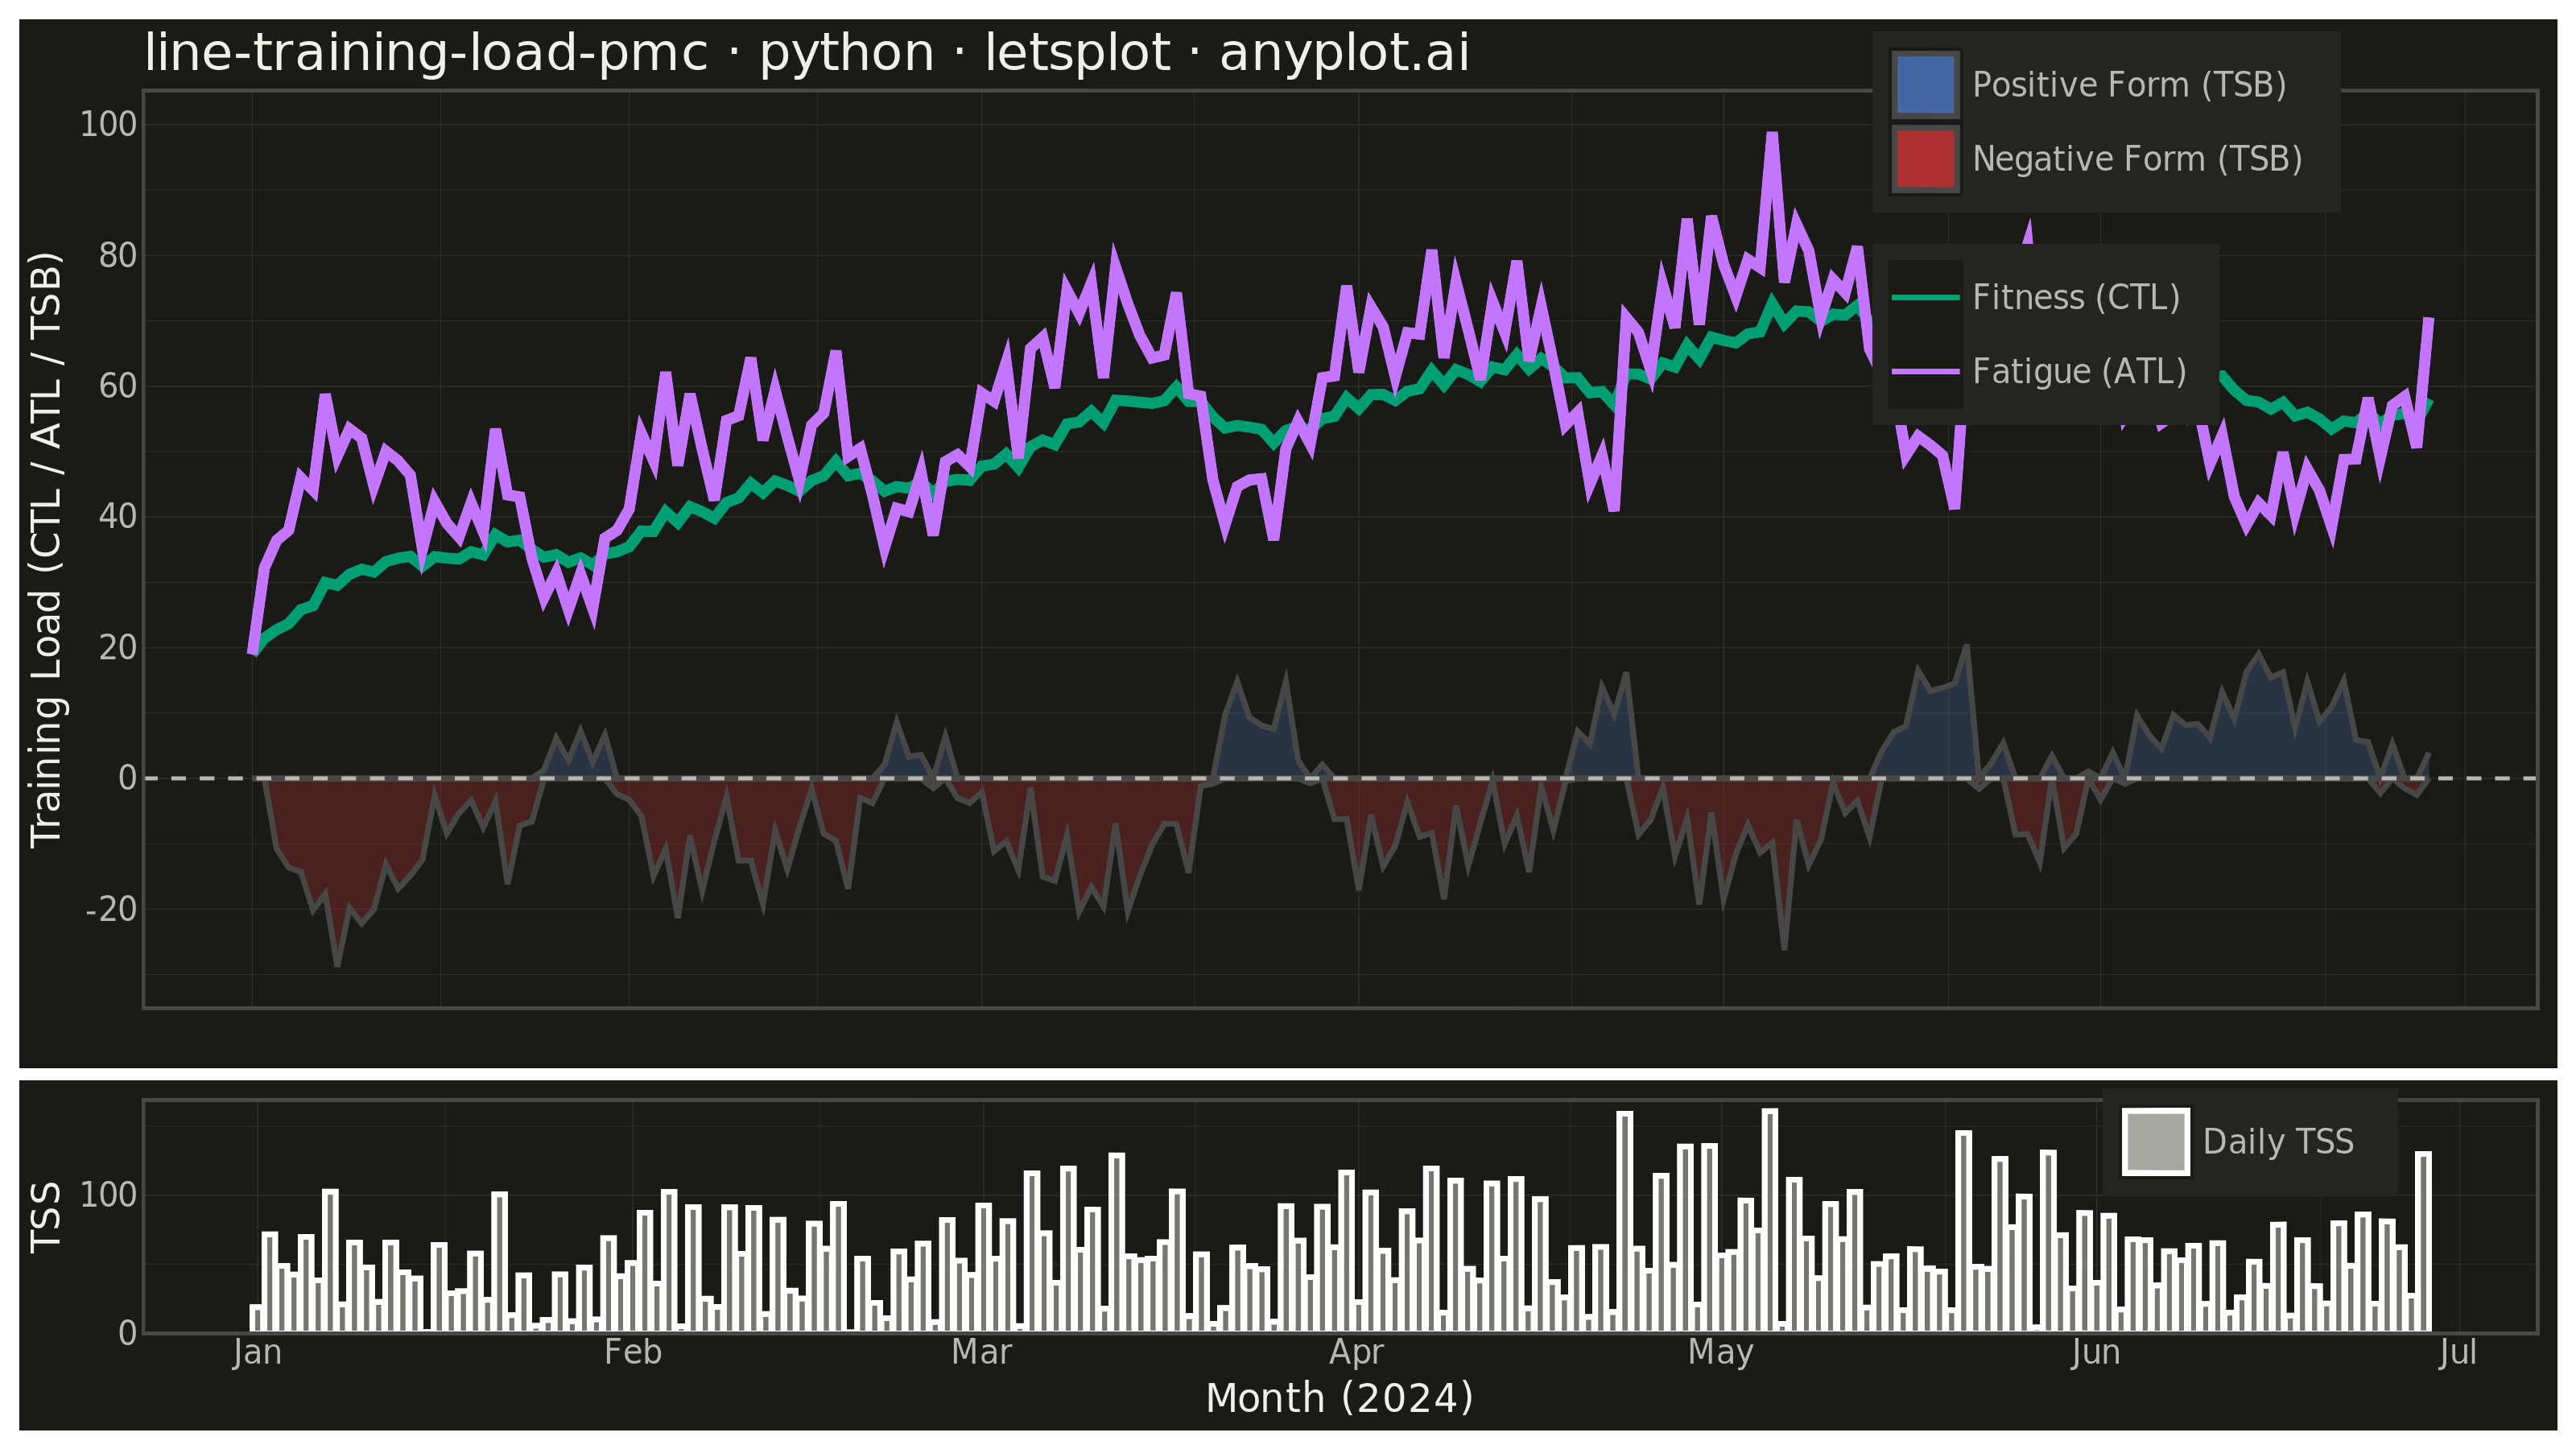
A Performance Management Chart (PMC), popularized by TrainingPeaks, summarizes an endurance athlete's training history on a single shared time axis. Two exponentially-smoothed lines track Chronic Training Load (CTL, "fitness", ~42-day time constant) and Acute Training Load (ATL, "fatigue", ~7-day time constant), while a filled area or band shows Training Stress Balance (TSB, "form" = CTL − ATL) above and below a zero baseline. Daily Training Stress Score (TSS) values appear as points or thin vertical bars, giving the raw workout intensity behind the smoothed trends. The chart reveals whether an athlete is building fitness, accumulating fatigue, or freshening up (positive form) for a target event.
""" anyplot.ai
line-training-load-pmc: Training Load Performance Management Chart
Library: letsplot 4.10.1 | Python 3.13.13
Quality: 86/100 | Created: 2026-06-13
"""

import os

import numpy as np
import pandas as pd
from lets_plot import *


LetsPlot.setup_html()

# Theme tokens — Imprint palette, theme-adaptive chrome
THEME = os.getenv("ANYPLOT_THEME", "light")
PAGE_BG = "#FAF8F1" if THEME == "light" else "#1A1A17"
ELEVATED_BG = "#FFFDF6" if THEME == "light" else "#242420"
INK = "#1A1A17" if THEME == "light" else "#F0EFE8"
INK_SOFT = "#4A4A44" if THEME == "light" else "#B8B7B0"
INK_MUTED = "#6B6A63" if THEME == "light" else "#A8A79F"
RULE = "#D5D4C8" if THEME == "light" else "#2E2E2A"

# Imprint categorical palette — first series always #009E73
IMPRINT_PALETTE = ["#009E73", "#C475FD", "#4467A3", "#BD8233", "#AE3030", "#2ABCCD", "#954477", "#99B314"]
COLOR_CTL = IMPRINT_PALETTE[0]  # green — Fitness (first series, always)
COLOR_ATL = IMPRINT_PALETTE[1]  # lavender — Fatigue
COLOR_TSB_POS = IMPRINT_PALETTE[2]  # blue — positive form / fresh
COLOR_TSB_NEG = IMPRINT_PALETTE[4]  # matte red — negative form / fatigued (semantic)

# Data — 180-day periodized training block (Jan–Jun 2024)
np.random.seed(42)
n_days = 180
dates = pd.date_range("2024-01-01", periods=n_days)

# Four-week blocks (3 build + 1 recovery), load ramps through month 4, tapers month 5
tss_list = []
for i in range(n_days):
    week_in_block = (i // 7) % 4
    day_of_week = i % 7
    month = min(i // 30, 5)
    base = [55, 65, 75, 85, 90, 60][month]
    if week_in_block == 3:
        base *= 0.55
    if day_of_week == 0:
        tss_i = max(0.0, np.random.normal(15, 8))
    elif day_of_week == 3:
        tss_i = max(0.0, np.random.normal(base * 0.50, 10))
    elif day_of_week in [1, 4, 6]:
        tss_i = max(0.0, np.random.normal(base * 1.35, 18))
    else:
        tss_i = max(0.0, np.random.normal(base * 0.75, 12))
    tss_list.append(round(tss_i, 1))

tss = np.array(tss_list)

# CTL: 42-day EWMA (chronic fitness), ATL: 7-day EWMA (acute fatigue)
k_ctl = 2 / (42 + 1)
k_atl = 2 / (7 + 1)
ctl = np.zeros(n_days)
atl = np.zeros(n_days)
ctl[0] = atl[0] = tss[0]
for i in range(1, n_days):
    ctl[i] = tss[i] * k_ctl + ctl[i - 1] * (1 - k_ctl)
    atl[i] = tss[i] * k_atl + atl[i - 1] * (1 - k_atl)

# TSB (form) = previous-day CTL minus previous-day ATL
tsb = np.zeros(n_days)
for i in range(1, n_days):
    tsb[i] = ctl[i - 1] - atl[i - 1]

df = pd.DataFrame(
    {
        "date": dates,
        "tss": tss,
        "ctl": ctl,
        "atl": atl,
        "tsb": tsb,
        "tsb_pos": np.maximum(tsb, 0.0),
        "tsb_neg": np.minimum(tsb, 0.0),
        "zero": np.zeros(n_days),
        "tsb_pos_label": "Positive Form (TSB)",
        "tsb_neg_label": "Negative Form (TSB)",
        "tss_label": "Daily TSS",
    }
)

# Long format for CTL/ATL — drives the color legend via aes(color='label')
df_lines = pd.melt(
    df[["date", "ctl", "atl"]], id_vars=["date"], value_vars=["ctl", "atl"], var_name="metric", value_name="value"
)
df_lines["label"] = df_lines["metric"].map({"ctl": "Fitness (CTL)", "atl": "Fatigue (ATL)"})

# Title — 55 chars < 67 baseline, no font scaling needed
title_str = "line-training-load-pmc · python · letsplot · anyplot.ai"

# Shared theme (applied to both panels)
base_theme = theme(
    plot_background=element_rect(fill=PAGE_BG, color=PAGE_BG),
    panel_background=element_rect(fill=PAGE_BG),
    panel_grid_major=element_line(color=RULE, size=0.3),
    panel_grid_minor=element_line(color=RULE, size=0.2),
    axis_title=element_text(color=INK, size=12),
    axis_text=element_text(color=INK_SOFT, size=10),
    axis_line=element_line(color=INK_SOFT),
    axis_ticks=element_blank(),
    panel_border=element_blank(),
    legend_background=element_rect(fill=ELEVATED_BG, color=INK_SOFT),
    legend_text=element_text(color=INK_SOFT, size=10),
    legend_title=element_blank(),
)

# Main panel: TSB ribbon (two-toned) + CTL/ATL lines + zero reference
plot_main = (
    ggplot()
    + geom_ribbon(data=df, mapping=aes(x="date", ymin="zero", ymax="tsb_pos", fill="tsb_pos_label"), alpha=0.32)
    + geom_ribbon(data=df, mapping=aes(x="date", ymin="tsb_neg", ymax="zero", fill="tsb_neg_label"), alpha=0.32)
    + geom_hline(yintercept=0, color=INK_SOFT, size=0.5, linetype="dashed")
    + geom_line(data=df_lines, mapping=aes(x="date", y="value", color="label"), size=1.5)
    + scale_color_manual(values={"Fitness (CTL)": COLOR_CTL, "Fatigue (ATL)": COLOR_ATL})
    + scale_fill_manual(values={"Positive Form (TSB)": COLOR_TSB_POS, "Negative Form (TSB)": COLOR_TSB_NEG})
    + scale_x_datetime(format="%b")
    + labs(title=title_str, x="", y="Training Load (CTL / ATL / TSB)")
    + base_theme
    + theme(
        plot_title=element_text(color=INK, size=16),
        axis_text_x=element_blank(),
        axis_ticks_x=element_blank(),
        legend_position=[0.82, 0.85],
    )
)

# TSS panel: daily training stress scores as bars
plot_tss = (
    ggplot(df, aes(x="date", y="tss"))
    + geom_bar(stat="identity", mapping=aes(fill="tss_label"), alpha=0.65)
    + scale_fill_manual(values={"Daily TSS": INK_MUTED})
    + scale_x_datetime(format="%b")
    + labs(x="Month (2024)", y="TSS")
    + base_theme
    + theme(plot_title=element_blank(), legend_position=[0.88, 0.82])
)

# Combine panels — main 75%, TSS 25%
combined = gggrid([plot_main, plot_tss], ncol=1, heights=[3, 1]) + ggsize(800, 450)

# Save PNG and HTML for both themes
ggsave(combined, f"plot-{THEME}.png", scale=4, path=".")
ggsave(combined, f"plot-{THEME}.html", path=".")
Runnable source as JSON, for any HTTP client: https://api.anyplot.ai/specs/line-training-load-pmc/letsplot/code. Any spec id and library id listed in llms-full.txt fit the same URL shape; every URL below is complete and callable.
{
  "spec_id": "line-training-load-pmc",
  "language": "python",
  "library": "letsplot",
  "page": "https://anyplot.ai/line-training-load-pmc/python/letsplot",
  "hub": "https://anyplot.ai/line-training-load-pmc",
  "code_json": "https://api.anyplot.ai/specs/line-training-load-pmc/letsplot/code",
  "spec_json": "https://api.anyplot.ai/specs/line-training-load-pmc",
  "render_light_png": "https://storage.googleapis.com/anyplot-images/plots/line-training-load-pmc/python/letsplot/plot-light.png",
  "render_dark_png": "https://storage.googleapis.com/anyplot-images/plots/line-training-load-pmc/python/letsplot/plot-dark.png",
  "interactive_light_html": "https://storage.googleapis.com/anyplot-images/plots/line-training-load-pmc/python/letsplot/plot-light.html",
  "interactive_dark_html": "https://storage.googleapis.com/anyplot-images/plots/line-training-load-pmc/python/letsplot/plot-dark.html",
  "quality_score": 86.0,
  "license": "MIT",
  "guide": "https://anyplot.ai/llms.txt"
}
Part of Training Load Performance Management Chart on anyplot.ai.