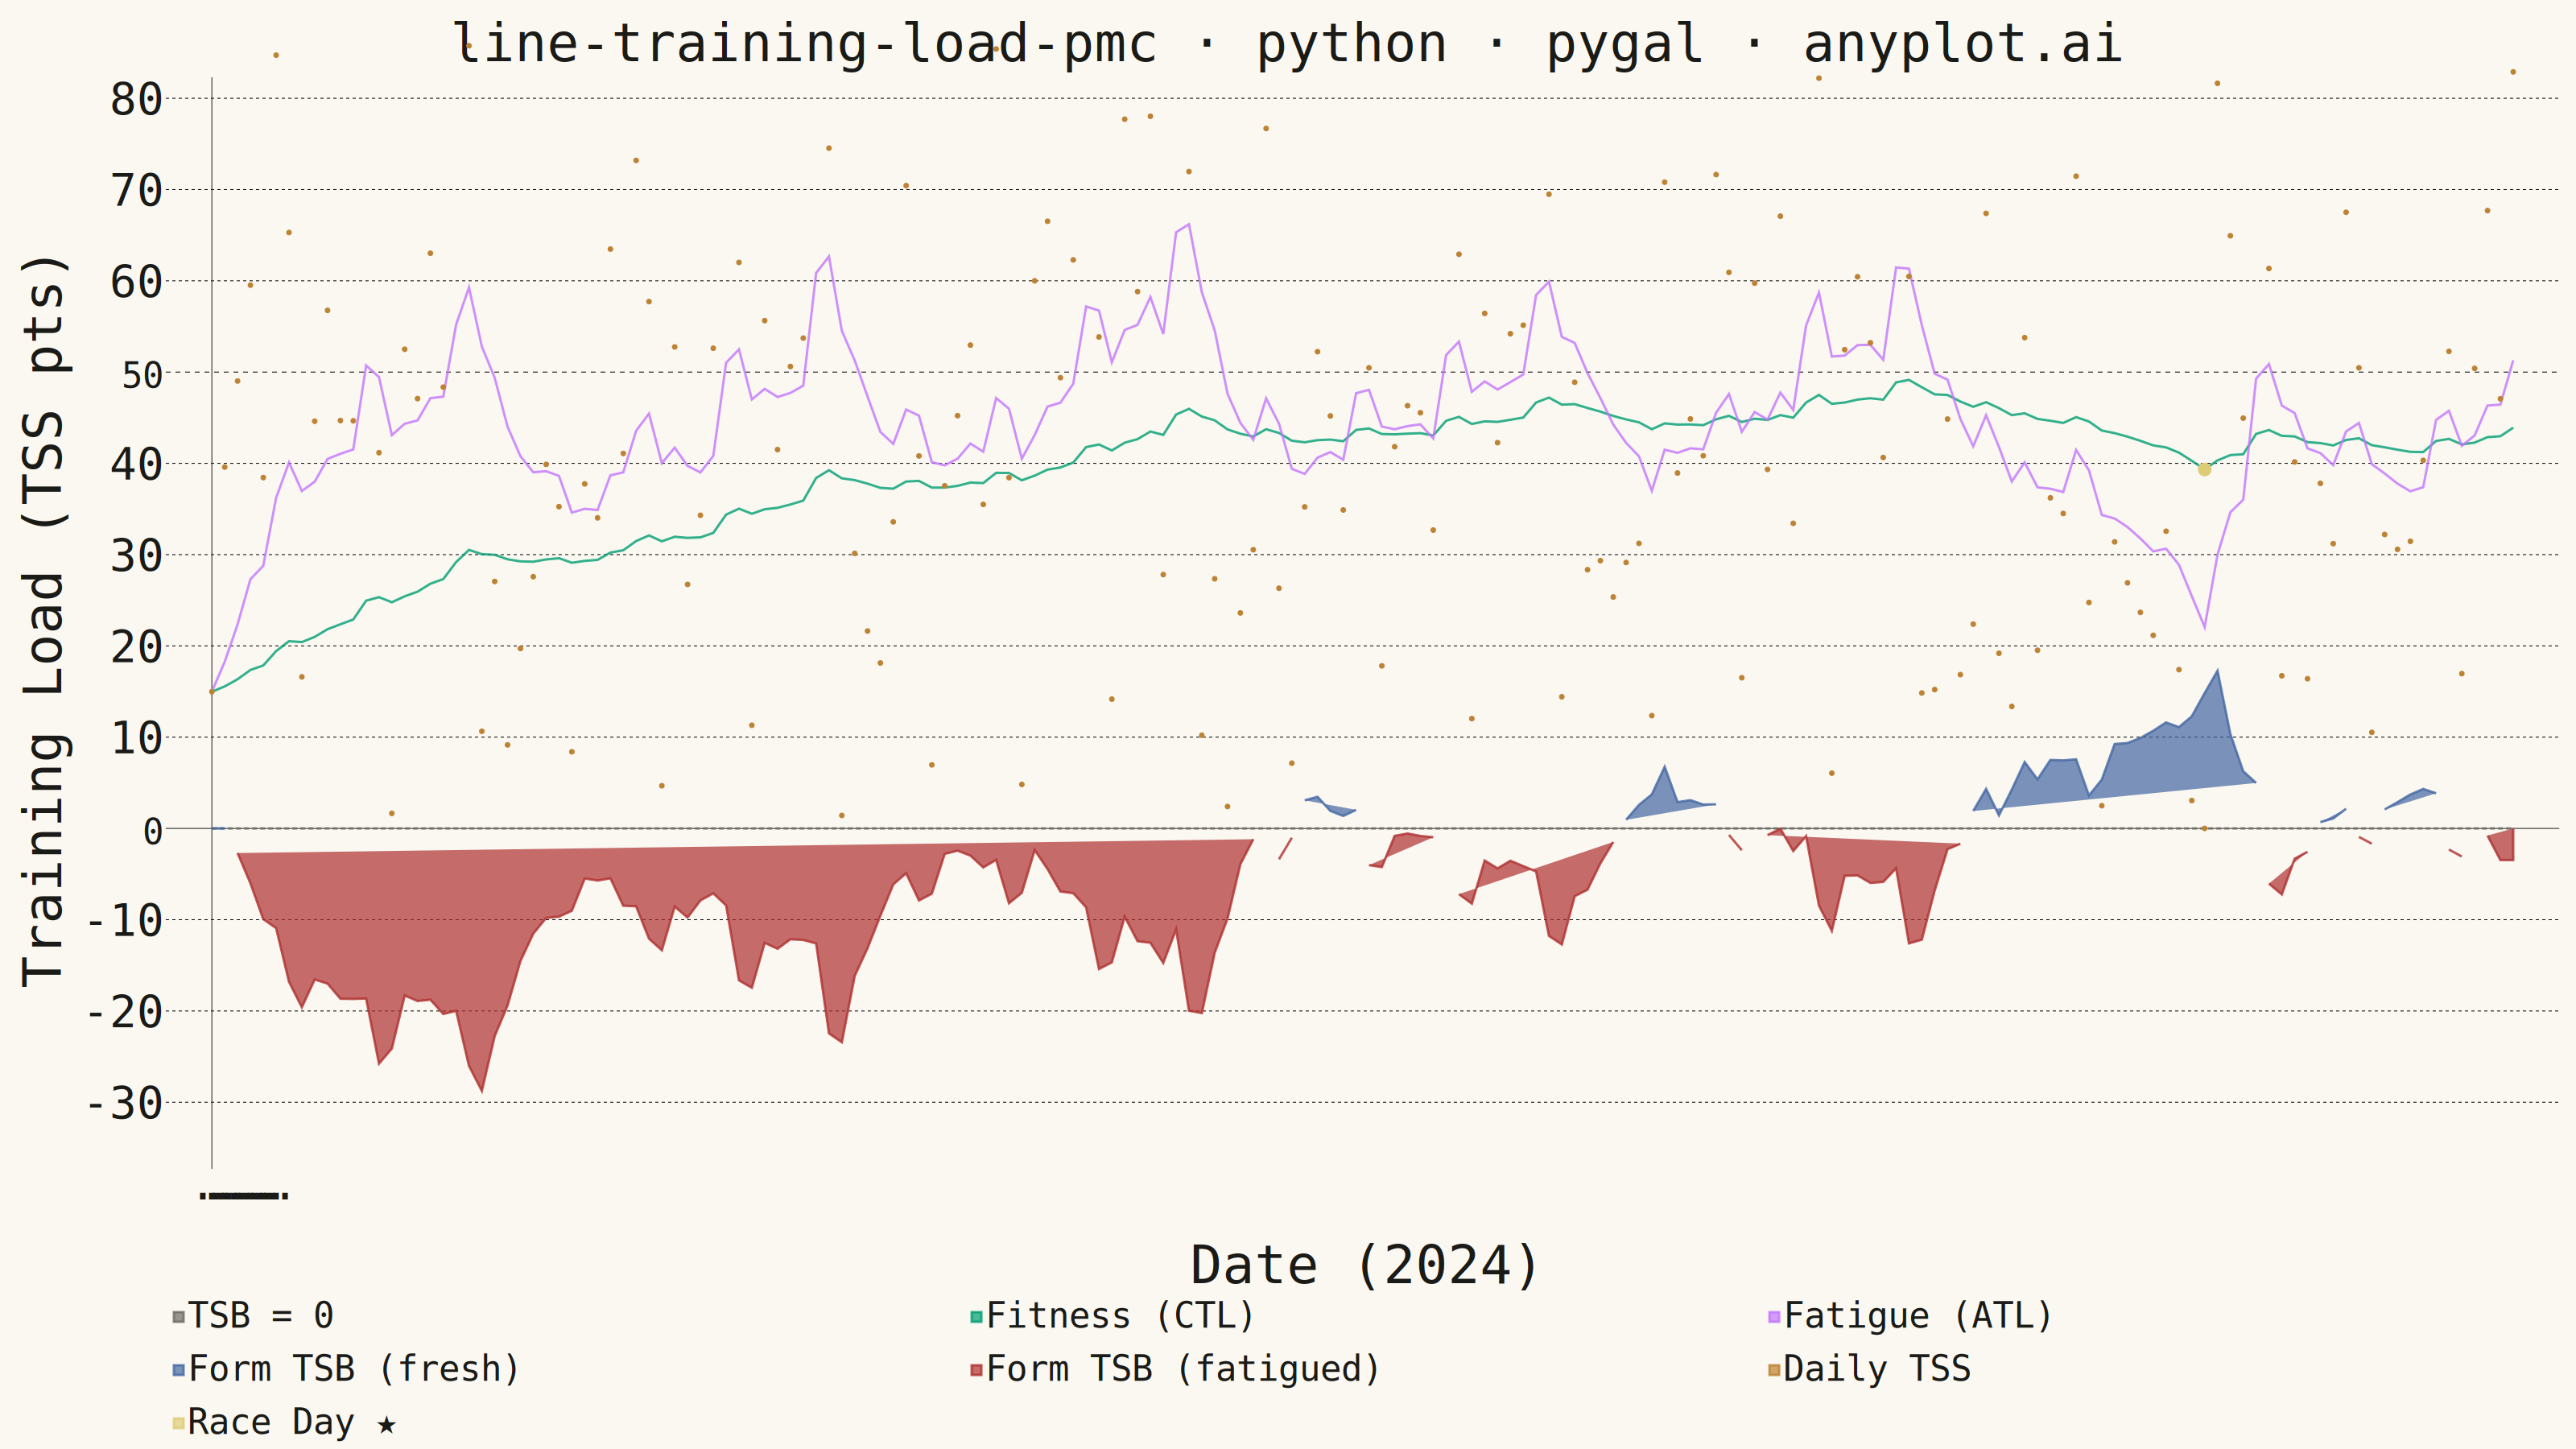
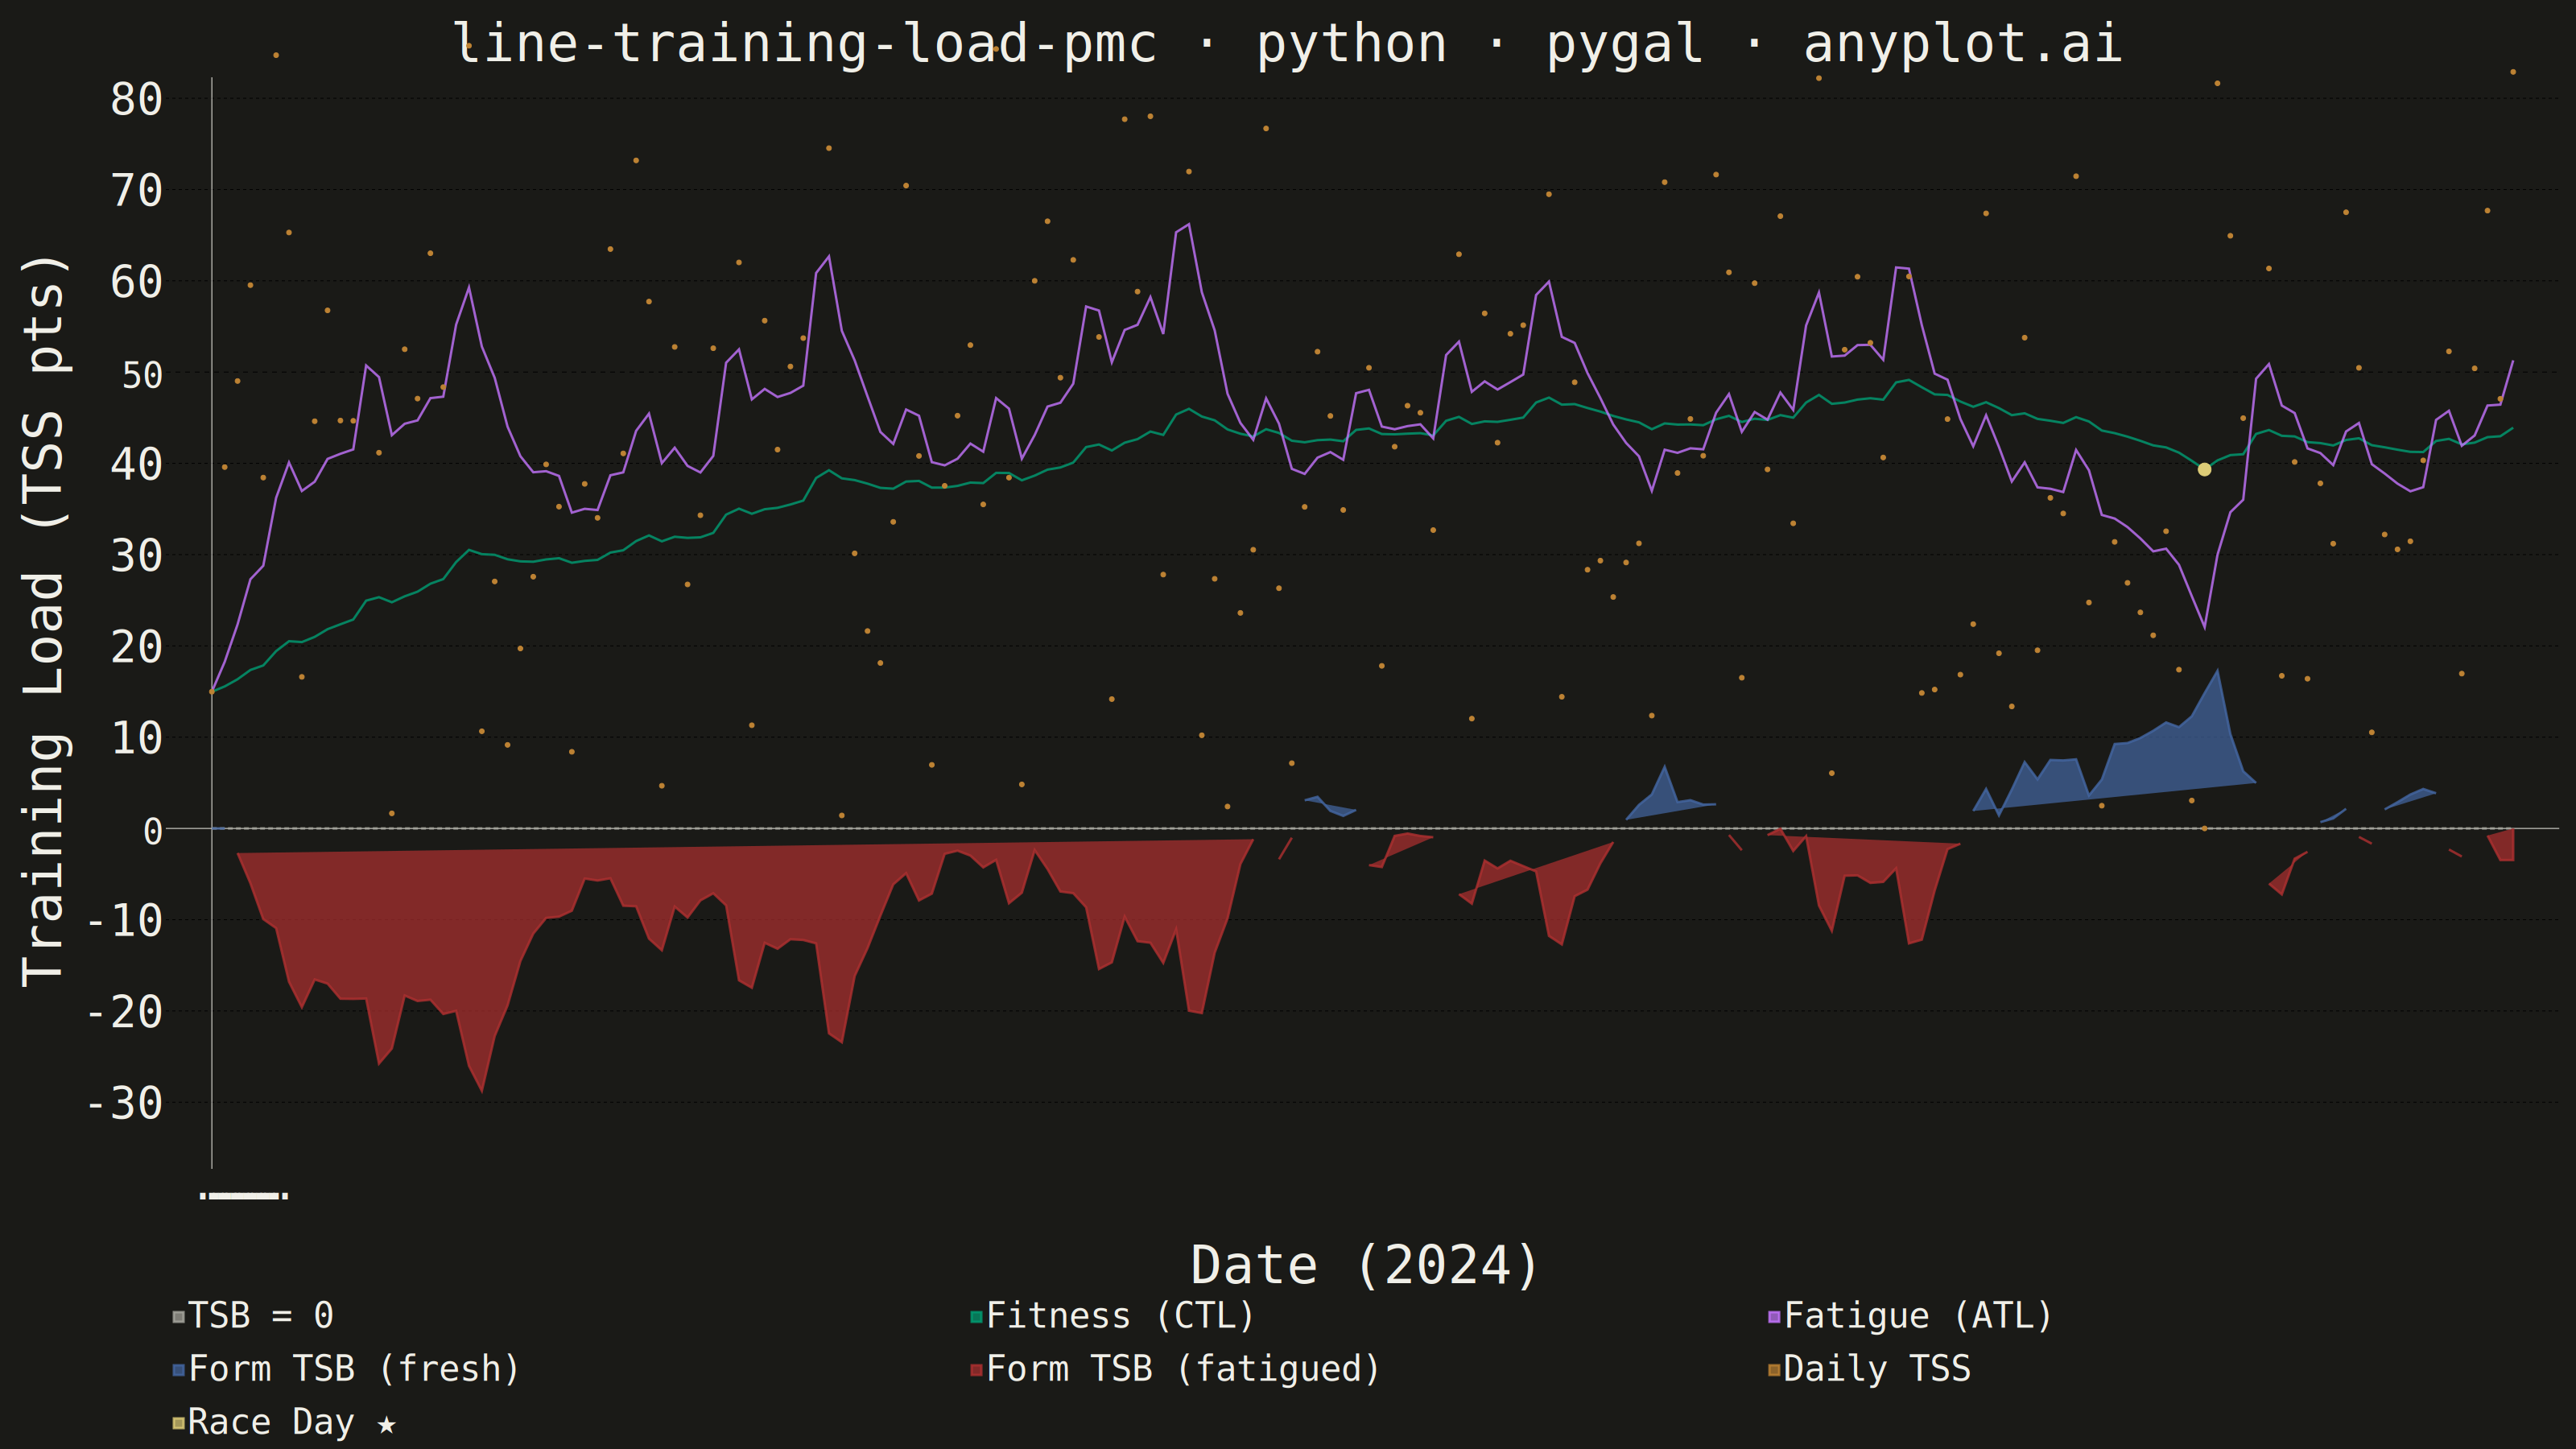
A Performance Management Chart (PMC), popularized by TrainingPeaks, summarizes an endurance athlete's training history on a single shared time axis. Two exponentially-smoothed lines track Chronic Training Load (CTL, "fitness", ~42-day time constant) and Acute Training Load (ATL, "fatigue", ~7-day time constant), while a filled area or band shows Training Stress Balance (TSB, "form" = CTL − ATL) above and below a zero baseline. Daily Training Stress Score (TSS) values appear as points or thin vertical bars, giving the raw workout intensity behind the smoothed trends. The chart reveals whether an athlete is building fitness, accumulating fatigue, or freshening up (positive form) for a target event.
""" anyplot.ai
line-training-load-pmc: Training Load Performance Management Chart
Library: pygal 3.1.0 | Python 3.13.13
Quality: 85/100 | Created: 2026-06-13
"""

import os
import sys


# Script filename shadows the installed `pygal` package; remove script dir from path.
sys.path.pop(0)

import numpy as np
import pandas as pd
import pygal
from pygal.style import Style


# Theme tokens
THEME = os.getenv("ANYPLOT_THEME", "light")
PAGE_BG = "#FAF8F1" if THEME == "light" else "#1A1A17"
INK = "#1A1A17" if THEME == "light" else "#F0EFE8"
INK_MUTED = "#6B6A63" if THEME == "light" else "#A8A79F"

# Palette in series-add order: ref, CTL, ATL, TSB+ (fresh), TSB- (fatigued), TSS, race-day
CHART_COLORS = (
    INK_MUTED,  # 0: TSB = 0 reference line (dashed)
    "#009E73",  # 1: Fitness (CTL)  — Imprint pos 1
    "#C475FD",  # 2: Fatigue (ATL)  — Imprint pos 2
    "#4467A3",  # 3: Form TSB (fresh / positive) — Imprint pos 3
    "#AE3030",  # 4: Form TSB (fatigued / negative) — Imprint pos 5
    "#BD8233",  # 5: Daily TSS — Imprint pos 4
    "#DDCC77",  # 6: Race Day marker — ANYPLOT_AMBER
    "#2ABCCD",
    "#954477",
)

# Data — 180-day training block (Jan–Jun 2024)
np.random.seed(42)
n_days = 180
dates = pd.date_range("2024-01-01", periods=n_days, freq="D")

# Daily TSS: 3-week build + 1-week recovery pattern
tss = np.zeros(n_days)
for i in range(n_days):
    dow = dates[i].dayofweek  # 0=Mon, 6=Sun
    cycle = (i // 7) % 4  # 0–2 = build, 3 = recovery

    if cycle < 3:
        base = 55 + cycle * 12  # 55 → 67 → 79 TSS across build weeks
    else:
        base = 35  # recovery week

    if dow == 0:  # Monday: rest / very easy
        tss[i] = max(0.0, np.random.normal(12, 6))
    elif dow == 5:  # Saturday: long session
        tss[i] = max(0.0, np.random.normal(base * 1.6, 14))
    elif dow == 6:  # Sunday: medium effort
        tss[i] = max(0.0, np.random.normal(base * 0.9, 10))
    else:  # Tue–Fri: quality / tempo
        tss[i] = max(0.0, np.random.normal(base * 0.75, 12))

# Two-week taper into target race on day 155
for i in range(140, 156):
    tss[i] *= max(0.12, 1.0 - (i - 140) / 18.0)
tss[155] = 0.0  # race day

# EWMA: CTL tau=42 days (fitness), ATL tau=7 days (fatigue)
a_ctl = 1.0 - np.exp(-1.0 / 42)
a_atl = 1.0 - np.exp(-1.0 / 7)

ctl = np.zeros(n_days)
atl = np.zeros(n_days)
tsb = np.zeros(n_days)
ctl[0] = atl[0] = tss[0]

for i in range(1, n_days):
    ctl[i] = ctl[i - 1] + a_ctl * (tss[i] - ctl[i - 1])
    atl[i] = atl[i - 1] + a_atl * (tss[i] - atl[i - 1])
    tsb[i] = ctl[i - 1] - atl[i - 1]  # previous-day CTL minus previous-day ATL

# Two-toned TSB: split into positive (fresh) and negative (fatigued) fill areas
tsb_list = tsb.tolist()
tsb_pos = [v if v >= 0 else None for v in tsb_list]
tsb_neg = [v if v < 0 else None for v in tsb_list]

# Race day marker: single dot at day 155 (taper complete, form peaks)
race_day_marker = [None] * n_days
race_day_marker[155] = float(ctl[155])

# X-axis: only month-start labels (6 entries) — avoids rendering artefact
x_labels = [d.strftime("%b %Y") for d in dates if d.day == 1]

# Title — 52 chars → ratio 1.0 → title_font_size 66
title = "line-training-load-pmc · python · pygal · anyplot.ai"

# Style
custom_style = Style(
    background=PAGE_BG,
    plot_background=PAGE_BG,
    foreground=INK,
    foreground_strong=INK,
    foreground_subtle=INK_MUTED,
    colors=CHART_COLORS,
    title_font_size=66,
    label_font_size=56,
    major_label_font_size=44,
    legend_font_size=44,
    value_font_size=36,
    stroke_width=3.0,
)

# Chart — y-range capped at 80 so CTL/ATL dominate; TSS dots scatter in the upper zone
chart = pygal.Line(
    width=3200,
    height=1800,
    style=custom_style,
    title=title,
    x_title="Date (2024)",
    y_title="Training Load (TSS pts)",
    show_x_guides=False,
    show_y_guides=True,
    show_dots=False,
    fill=False,
    legend_at_bottom=True,  # horizontal legend gives full label width — no truncation
    range=[-35, 80],  # clips extreme TSS spikes; ATL/CTL (≤65) fully visible
)

chart.x_labels = x_labels

# Add series in color-assignment order
chart.add("TSB = 0", [0] * n_days, stroke_style={"width": 1.2, "dasharray": "6 4"})
chart.add("Fitness (CTL)", ctl.tolist(), stroke_style={"width": 5.5})
chart.add("Fatigue (ATL)", atl.tolist(), stroke_style={"width": 3.5})
# TSB as two-toned filled area: blue=fresh (positive form), red=fatigued (negative form)
chart.add("Form TSB (fresh)", tsb_pos, allow_interruptions=True, fill=True, stroke_style={"width": 1.5})
chart.add("Form TSB (fatigued)", tsb_neg, allow_interruptions=True, fill=True, stroke_style={"width": 1.5})
# TSS as scatter dots — stroke=False so only dots render without dominating spike-lines
chart.add("Daily TSS", tss.tolist(), stroke=False, show_dots=True, dots_size=3)
# Race-day marker: single amber dot at day 155 anchors the taper narrative
chart.add("Race Day ★", race_day_marker, allow_interruptions=True, stroke=False, show_dots=True, dots_size=8)

# Save PNG and interactive HTML
chart.render_to_png(f"plot-{THEME}.png")
with open(f"plot-{THEME}.html", "wb") as f:
    f.write(chart.render())
Runnable source as JSON, for any HTTP client: https://api.anyplot.ai/specs/line-training-load-pmc/pygal/code. Any spec id and library id listed in llms-full.txt fit the same URL shape; every URL below is complete and callable.
{
  "spec_id": "line-training-load-pmc",
  "language": "python",
  "library": "pygal",
  "page": "https://anyplot.ai/line-training-load-pmc/python/pygal",
  "hub": "https://anyplot.ai/line-training-load-pmc",
  "code_json": "https://api.anyplot.ai/specs/line-training-load-pmc/pygal/code",
  "spec_json": "https://api.anyplot.ai/specs/line-training-load-pmc",
  "render_light_png": "https://storage.googleapis.com/anyplot-images/plots/line-training-load-pmc/python/pygal/plot-light.png",
  "render_dark_png": "https://storage.googleapis.com/anyplot-images/plots/line-training-load-pmc/python/pygal/plot-dark.png",
  "interactive_light_html": "https://storage.googleapis.com/anyplot-images/plots/line-training-load-pmc/python/pygal/plot-light.html",
  "interactive_dark_html": "https://storage.googleapis.com/anyplot-images/plots/line-training-load-pmc/python/pygal/plot-dark.html",
  "quality_score": 85.0,
  "license": "MIT",
  "guide": "https://anyplot.ai/llms.txt"
}
Part of Training Load Performance Management Chart on anyplot.ai.