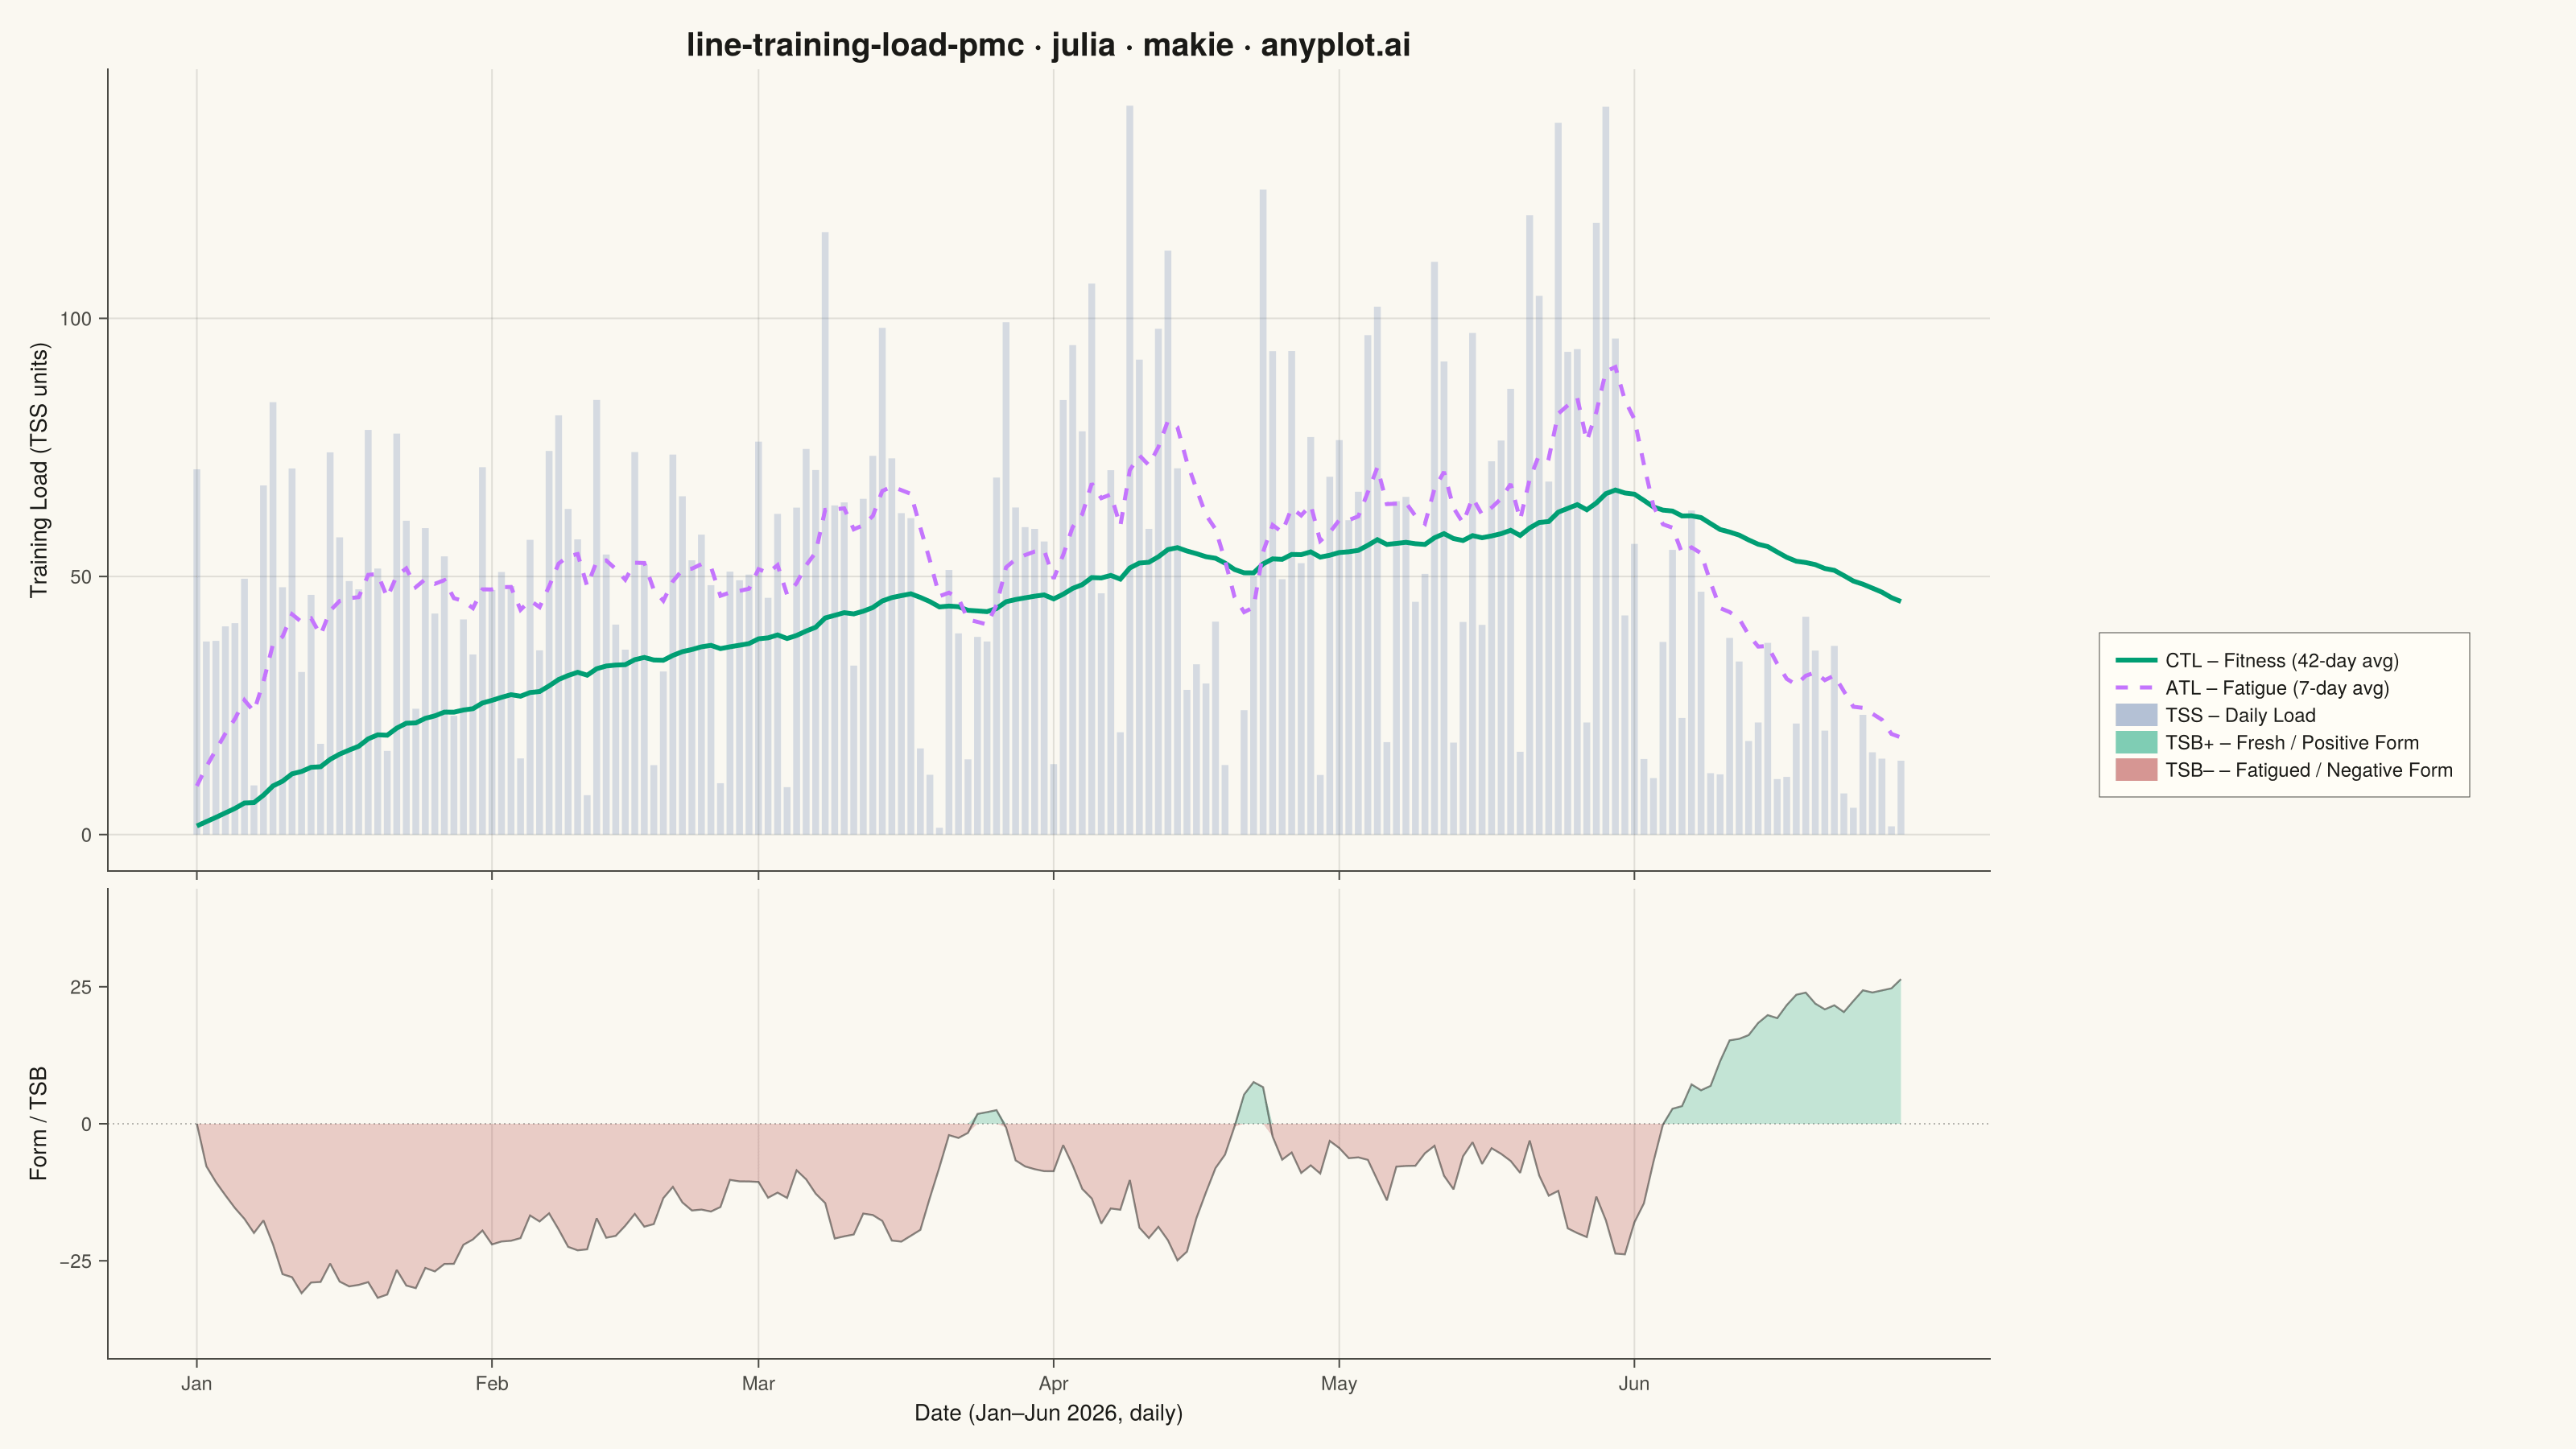
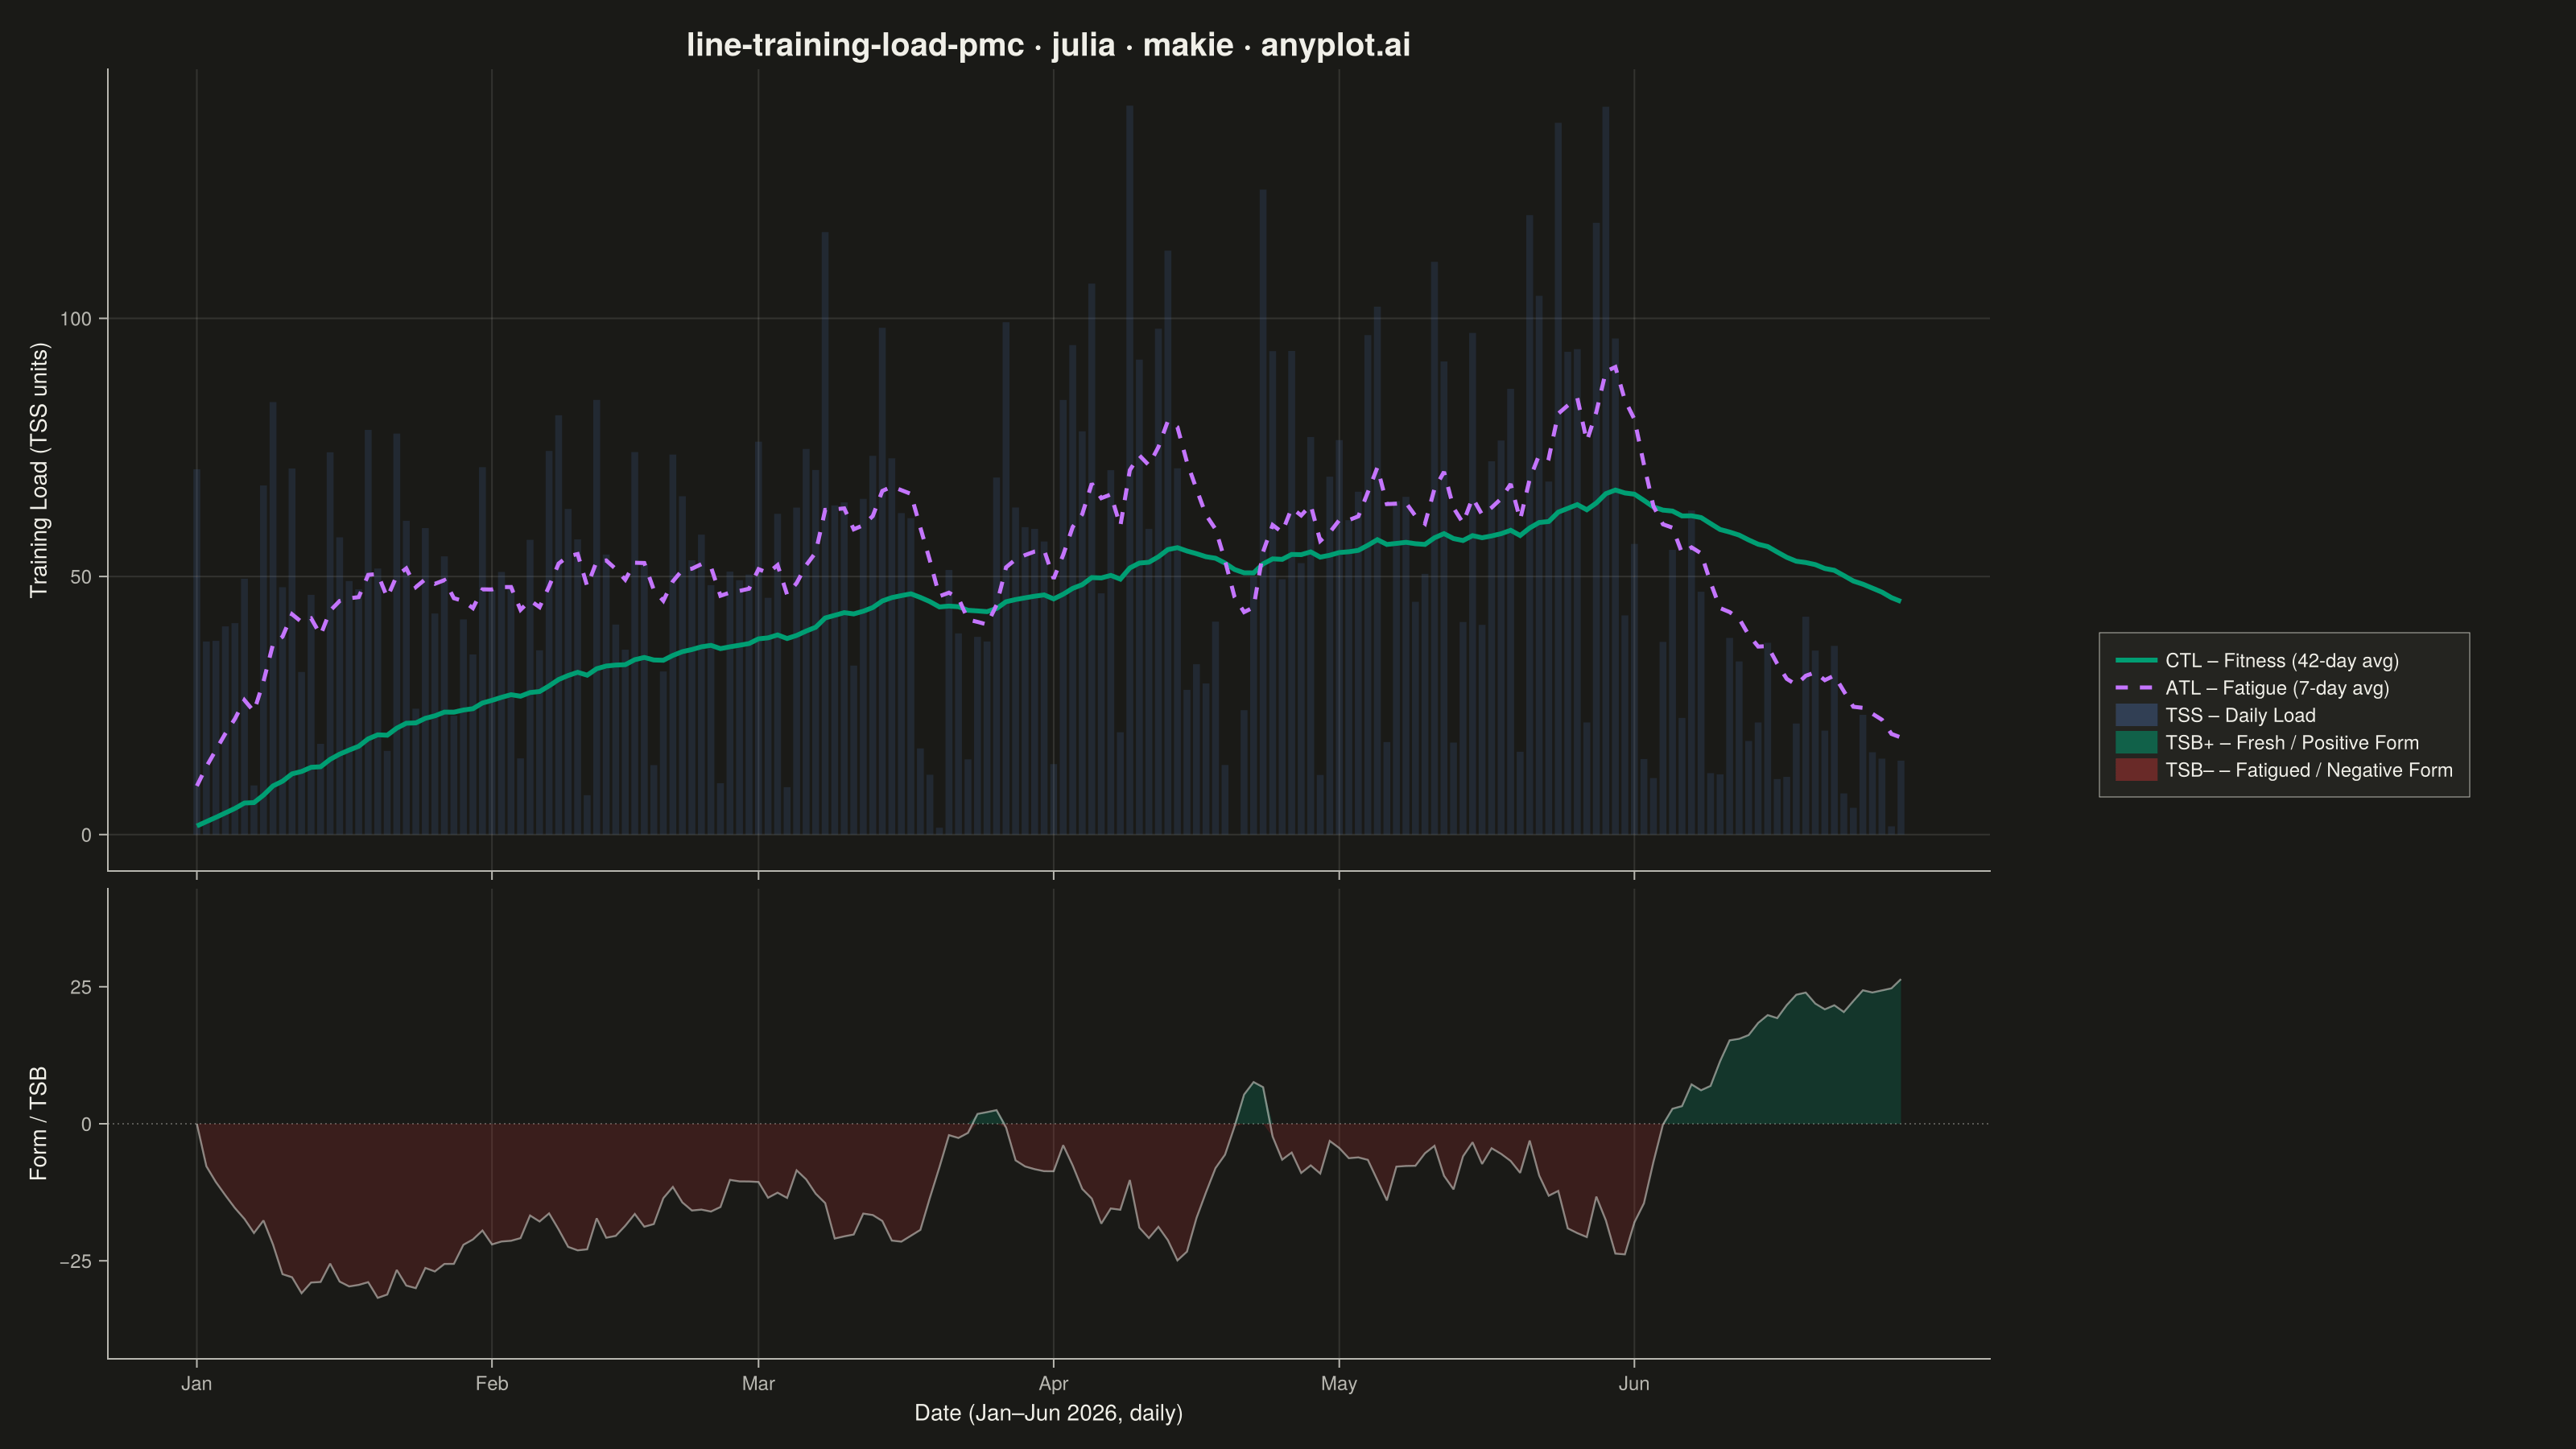
A Performance Management Chart (PMC), popularized by TrainingPeaks, summarizes an endurance athlete's training history on a single shared time axis. Two exponentially-smoothed lines track Chronic Training Load (CTL, "fitness", ~42-day time constant) and Acute Training Load (ATL, "fatigue", ~7-day time constant), while a filled area or band shows Training Stress Balance (TSB, "form" = CTL − ATL) above and below a zero baseline. Daily Training Stress Score (TSS) values appear as points or thin vertical bars, giving the raw workout intensity behind the smoothed trends. The chart reveals whether an athlete is building fitness, accumulating fatigue, or freshening up (positive form) for a target event.
# anyplot.ai
# line-training-load-pmc: Training Load Performance Management Chart
# Library: makie 0.22.10 | Julia 1.11.9
# Quality: 93/100 | Created: 2026-06-13

using CairoMakie
using Colors
using Random

Random.seed!(42)

# Theme tokens (Imprint chrome)
const THEME       = get(ENV, "ANYPLOT_THEME", "light")
const PAGE_BG     = THEME == "light" ? colorant"#FAF8F1" : colorant"#1A1A17"
const ELEVATED_BG = THEME == "light" ? colorant"#FFFDF6" : colorant"#242420"
const INK         = THEME == "light" ? colorant"#1A1A17" : colorant"#F0EFE8"
const INK_SOFT    = THEME == "light" ? colorant"#4A4A44" : colorant"#B8B7B0"
const INK_MUTED   = THEME == "light" ? colorant"#6B6A63" : colorant"#A8A79F"

# Imprint palette — semantic assignment for PMC series
const C_CTL     = colorant"#009E73"  # pos 1, brand green  — CTL / fitness (first series)
const C_ATL     = colorant"#C475FD"  # pos 2, lavender     — ATL / fatigue
const C_TSS     = colorant"#4467A3"  # pos 3, blue         — daily TSS bars
const C_TSB_POS = colorant"#009E73"  # green (semantic: fresh / positive form)
const C_TSB_NEG = colorant"#AE3030"  # pos 5, matte red    — fatigued / negative form

# Data: 180-day cycling season (Jan–Jun 2026) — base build, peak, taper
n   = 180
tss = zeros(Float64, n)

for i in 1:n
    dow = (i - 1) % 7   # 0=Mon … 6=Sun
    if i <= 60           # Base: aerobic foundation
        if dow < 5
            tss[i] = max(0.0, 55.0 + 20.0 * randn())
        else
            tss[i] = max(0.0, 15.0 + 6.0 * randn())
        end
        dow == 5 && (tss[i] += 35.0)
    elseif i <= 120      # Build: 3 hard weeks + 1 recovery per block
        if (i - 1) % 28 >= 21
            tss[i] = max(0.0, 30.0 + 12.0 * randn())   # recovery week
        elseif dow < 5
            tss[i] = max(0.0, 78.0 + 28.0 * randn())
        else
            tss[i] = max(0.0, 18.0 + 8.0 * randn())
        end
        (dow == 5 && (i - 1) % 28 < 21) && (tss[i] += 55.0)
    elseif i <= 150      # Peak: race-prep intensity blocks
        if dow < 5
            tss[i] = max(0.0, 90.0 + 32.0 * randn())
        else
            tss[i] = max(0.0, 20.0 + 10.0 * randn())
        end
        dow == 5 && (tss[i] += 65.0)
    else                 # Taper: cut volume for peak race
        taper = 1.0 - 0.7 * (i - 150) / 30.0
        if dow < 5
            tss[i] = max(0.0, (62.0 + 18.0 * randn()) * taper)
        else
            tss[i] = max(0.0, (14.0 + 5.0 * randn()) * taper)
        end
    end
end

# Exponentially weighted moving averages (TrainingPeaks standard formulas)
alpha_ctl = 1.0 - exp(-1.0 / 42.0)   # 42-day time constant → chronic fitness
alpha_atl = 1.0 - exp(-1.0 / 7.0)    # 7-day time constant  → acute fatigue

ctl = zeros(Float64, n)
atl = zeros(Float64, n)
tsb = zeros(Float64, n)

ctl[1] = tss[1] * alpha_ctl
atl[1] = tss[1] * alpha_atl

for i in 2:n
    tsb[i] = ctl[i-1] - atl[i-1]                          # form = yesterday's fitness − fatigue
    ctl[i] = ctl[i-1] + alpha_ctl * (tss[i] - ctl[i-1])
    atl[i] = atl[i-1] + alpha_atl * (tss[i] - atl[i-1])
end

days    = collect(1:n)
tsb_pos = [max(0.0, v) for v in tsb]
tsb_neg = [min(0.0, v) for v in tsb]

month_ticks = ([1, 32, 60, 91, 121, 152], ["Jan", "Feb", "Mar", "Apr", "May", "Jun"])

# Figure: landscape canvas → 3200 × 1800 px at px_per_unit = 2
fig = Figure(
    size            = (1600, 900),
    fontsize        = 14,
    backgroundcolor = PAGE_BG,
)

# Top panel — CTL, ATL, TSS
ax1 = Axis(
    fig[1, 1];
    backgroundcolor    = PAGE_BG,
    title              = "line-training-load-pmc · julia · makie · anyplot.ai",
    titlesize          = 20,
    titlecolor         = INK,
    ylabel             = "Training Load (TSS units)",
    ylabelsize         = 14,
    ylabelcolor        = INK,
    yticklabelsize     = 12,
    yticklabelcolor    = INK_SOFT,
    ytickcolor         = INK_SOFT,
    leftspinecolor     = INK_SOFT,
    bottomspinecolor   = INK_SOFT,
    topspinevisible    = false,
    rightspinevisible  = false,
    xticklabelsvisible = false,
    xlabelvisible      = false,
    xtickcolor         = INK_SOFT,
    xgridcolor         = RGBAf(INK.r, INK.g, INK.b, 0.12),
    ygridcolor         = RGBAf(INK.r, INK.g, INK.b, 0.12),
    xminorgridvisible  = false,
    yminorgridvisible  = false,
    xticks             = month_ticks,
)

# Bottom panel — TSB / Form
ax2 = Axis(
    fig[2, 1];
    backgroundcolor   = PAGE_BG,
    xlabel            = "Date (Jan–Jun 2026, daily)",
    ylabel            = "Form / TSB",
    xlabelsize        = 14,
    ylabelsize        = 14,
    xlabelcolor       = INK,
    ylabelcolor       = INK,
    xticklabelsize    = 12,
    yticklabelsize    = 12,
    xticklabelcolor   = INK_SOFT,
    yticklabelcolor   = INK_SOFT,
    xtickcolor        = INK_SOFT,
    ytickcolor        = INK_SOFT,
    leftspinecolor    = INK_SOFT,
    bottomspinecolor  = INK_SOFT,
    topspinevisible   = false,
    rightspinevisible = false,
    xgridcolor        = RGBAf(INK.r, INK.g, INK.b, 0.12),
    ygridvisible      = false,
    xminorgridvisible = false,
    yminorgridvisible = false,
    xticks            = month_ticks,
)

rowsize!(fig.layout, 1, Relative(0.63))
rowsize!(fig.layout, 2, Relative(0.37))
rowgap!(fig.layout, 1, 6)

linkxaxes!(ax1, ax2)

# TSS bars — raw daily training stress (background layer, semi-transparent)
barplot!(ax1, days, tss;
    color       = (C_TSS, 0.20),
    strokewidth = 0.0,
    width       = 0.9,
)

# CTL — chronic fitness line (green, thick, smooth)
lines!(ax1, days, ctl;
    color     = C_CTL,
    linewidth = 3.0,
)

# ATL — acute fatigue line (lavender, dashed)
lines!(ax1, days, atl;
    color     = C_ATL,
    linewidth = 2.5,
    linestyle = :dash,
)

# TSB zero reference
hlines!(ax2, [0.0];
    color     = (INK, 0.30),
    linewidth = 1.0,
    linestyle = :dot,
)

# TSB filled area — green above zero (fresh), red below zero (fatigued)
band!(ax2, days, zeros(n), tsb_pos;
    color = (C_TSB_POS, 0.22),
)
band!(ax2, days, tsb_neg, zeros(n);
    color = (C_TSB_NEG, 0.22),
)

# TSB outline (subtle ink trace)
lines!(ax2, days, tsb;
    color     = (INK, 0.50),
    linewidth = 1.2,
)

# Symmetric TSB y-axis so zero sits at midpoint
tsb_extent = maximum(abs.(tsb)) * 1.35
ylims!(ax2, -tsb_extent, tsb_extent)

# External legend (right column, spans both panels)
leg_elements = [
    LineElement(color = C_CTL, linewidth = 3.0),
    LineElement(color = C_ATL, linewidth = 2.5, linestyle = :dash),
    PolyElement(color = (C_TSS, 0.40)),
    PolyElement(color = (C_TSB_POS, 0.50)),
    PolyElement(color = (C_TSB_NEG, 0.50)),
]
leg_labels = [
    "CTL – Fitness (42-day avg)",
    "ATL – Fatigue (7-day avg)",
    "TSS – Daily Load",
    "TSB+ – Fresh / Positive Form",
    "TSB– – Fatigued / Negative Form",
]

Legend(
    fig[1:2, 2],
    leg_elements,
    leg_labels;
    framecolor      = INK_SOFT,
    backgroundcolor = ELEVATED_BG,
    labelcolor      = INK,
    labelsize  = 12,
    patchsize  = (26, 14),
    framewidth = 0.5,
    padding    = (10, 10, 10, 10),
)

colsize!(fig.layout, 2, Relative(0.22))

save("plot-$(THEME).png", fig; px_per_unit = 2)
Runnable source as JSON, for any HTTP client: https://api.anyplot.ai/specs/line-training-load-pmc/makie/code. Any spec id and library id listed in llms-full.txt fit the same URL shape; every URL below is complete and callable.
{
  "spec_id": "line-training-load-pmc",
  "language": "julia",
  "library": "makie",
  "page": "https://anyplot.ai/line-training-load-pmc/julia/makie",
  "hub": "https://anyplot.ai/line-training-load-pmc",
  "code_json": "https://api.anyplot.ai/specs/line-training-load-pmc/makie/code",
  "spec_json": "https://api.anyplot.ai/specs/line-training-load-pmc",
  "render_light_png": "https://storage.googleapis.com/anyplot-images/plots/line-training-load-pmc/julia/makie/plot-light.png",
  "render_dark_png": "https://storage.googleapis.com/anyplot-images/plots/line-training-load-pmc/julia/makie/plot-dark.png",
  "quality_score": 93.0,
  "license": "MIT",
  "guide": "https://anyplot.ai/llms.txt"
}
Part of Training Load Performance Management Chart on anyplot.ai.