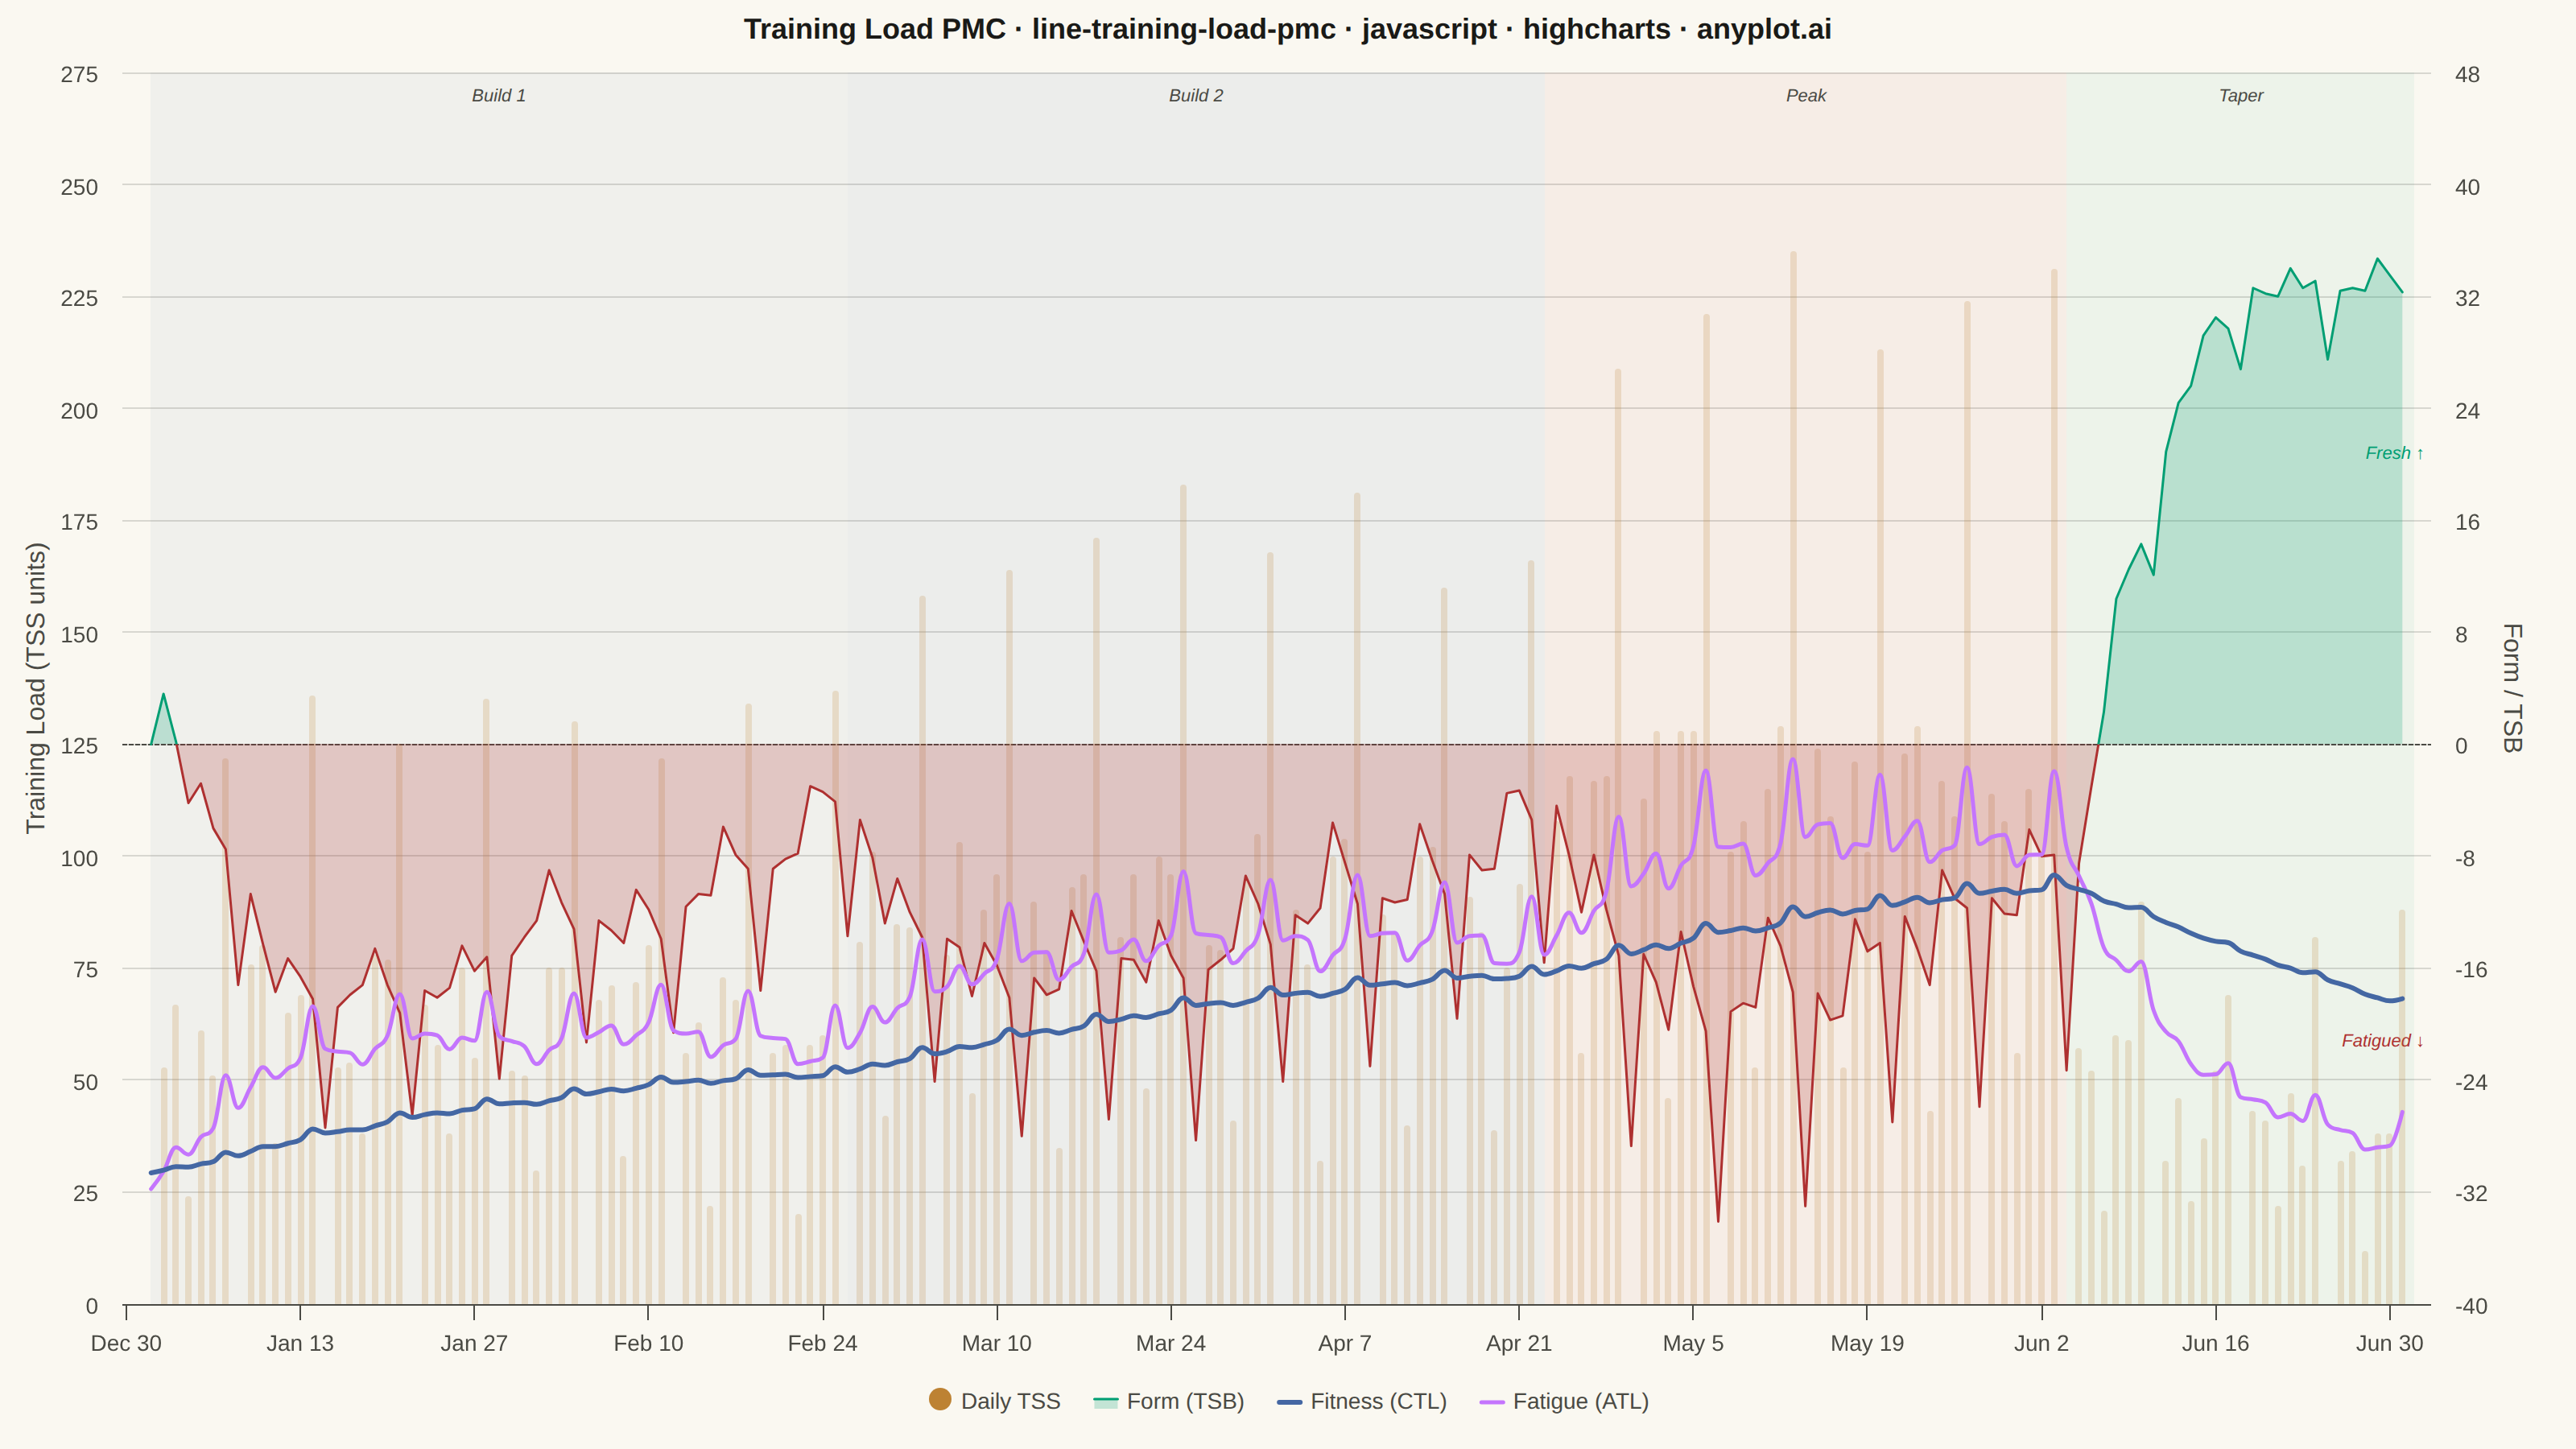
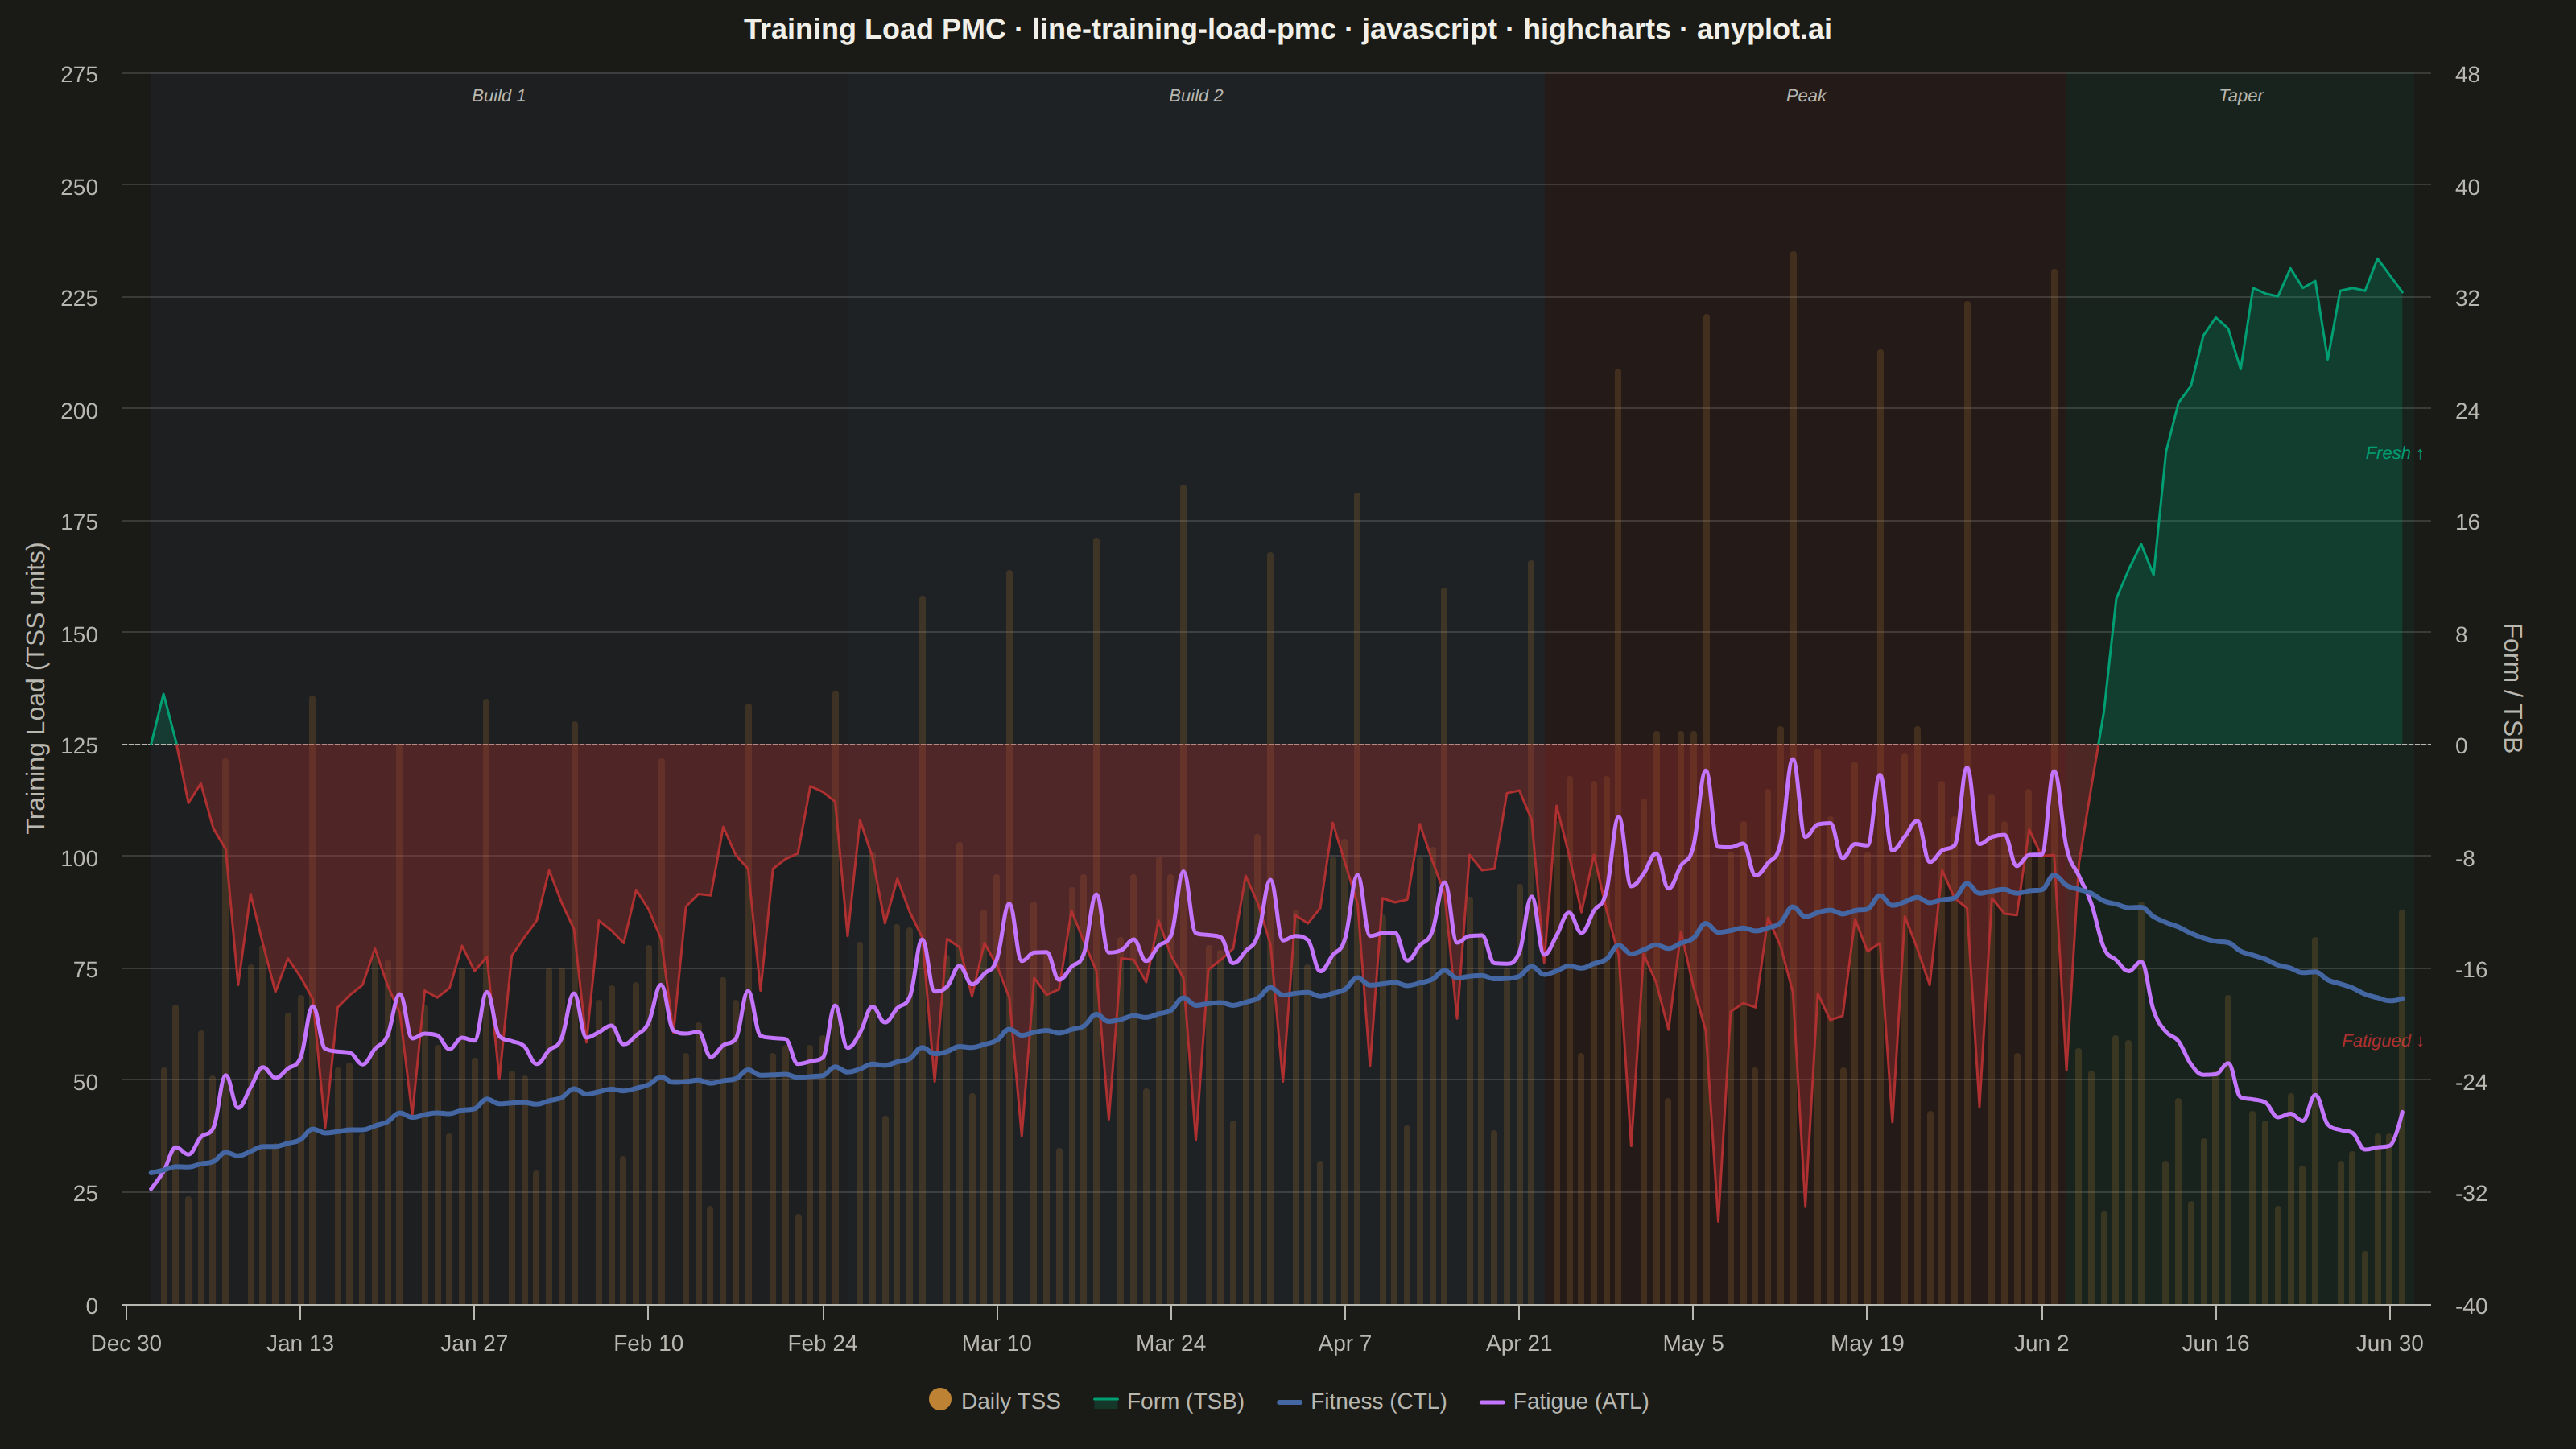
A Performance Management Chart (PMC), popularized by TrainingPeaks, summarizes an endurance athlete's training history on a single shared time axis. Two exponentially-smoothed lines track Chronic Training Load (CTL, "fitness", ~42-day time constant) and Acute Training Load (ATL, "fatigue", ~7-day time constant), while a filled area or band shows Training Stress Balance (TSB, "form" = CTL − ATL) above and below a zero baseline. Daily Training Stress Score (TSS) values appear as points or thin vertical bars, giving the raw workout intensity behind the smoothed trends. The chart reveals whether an athlete is building fitness, accumulating fatigue, or freshening up (positive form) for a target event.
// anyplot.ai
// line-training-load-pmc: Training Load Performance Management Chart
// Library: highcharts 12.6.0 | JavaScript 22.22.3
// Quality: 91/100 | Created: 2026-06-13

//# anyplot-orientation: landscape

const t = window.ANYPLOT_TOKENS;
const isDark = window.ANYPLOT_THEME === "dark";

// Seeded LCG for deterministic data (no seeded RNG in the browser)
function makeLcg(seed) {
  let s = seed >>> 0;
  return function () {
    s = (s * 1664525 + 1013904223) >>> 0;
    return s / 0x100000000;
  };
}
const rng = makeLcg(42);

// 182-day (26-week) training block — build1 → build2 → peak → taper
const DAYS = 182;
const START_MS = Date.UTC(2025, 0, 1);
const MS_PER_DAY = 86400000;

function phaseBase(weekIdx) {
  if (weekIdx < 8)  return 65;
  if (weekIdx < 16) return 90;
  if (weekIdx < 22) return 115;
  return 45; // taper
}

const rawTss = [];
for (let i = 0; i < DAYS; i++) {
  const week = Math.floor(i / 7);
  const dow  = i % 7;
  const base = phaseBase(week);
  const r    = rng();

  let tss;
  if (dow === 0) {
    tss = 0;                                          // rest day
  } else if (dow === 3) {
    tss = Math.max(0, base * 0.45 + (r - 0.5) * 20); // easy
  } else if (dow === 6) {
    tss = Math.max(0, base * 1.9  + (r - 0.5) * 35); // long/hard
  } else {
    tss = Math.max(0, base        + (r - 0.5) * 30); // normal
  }
  rawTss.push(Math.round(tss));
}

// EWMA: ATL 7-day, CTL 42-day; TSB = previous-day CTL − ATL
const tssPoints = [], atlPoints = [], ctlPoints = [], tsbPoints = [];
let prevAtl = 30, prevCtl = 30;

for (let i = 0; i < DAYS; i++) {
  const ts  = START_MS + i * MS_PER_DAY;
  const tss = rawTss[i];

  tsbPoints.push([ts, Math.round((prevCtl - prevAtl) * 10) / 10]);
  tssPoints.push([ts, tss]);

  const newAtl = prevAtl + (tss - prevAtl) / 7;
  const newCtl = prevCtl + (tss - prevCtl) / 42;

  atlPoints.push([ts, Math.round(newAtl * 10) / 10]);
  ctlPoints.push([ts, Math.round(newCtl * 10) / 10]);

  prevAtl = newAtl;
  prevCtl = newCtl;
}

// Title font scaled for length > 67 chars
const TITLE = "Training Load PMC · line-training-load-pmc · javascript · highcharts · anyplot.ai";
const titleSize = Math.max(14, Math.round(22 * 67 / TITLE.length));

// Dark bg absorbs semi-transparent color more; boost negative fill alpha on dark
const negFillAlpha = isDark ? 0.35 : 0.22;

// Phase date boundaries for x-axis plotBands
const phase1End = START_MS + 8  * 7 * MS_PER_DAY;
const phase2End = START_MS + 16 * 7 * MS_PER_DAY;
const phase3End = START_MS + 22 * 7 * MS_PER_DAY;
const END_MS    = START_MS + DAYS * MS_PER_DAY;

const bandAlpha = isDark ? 0.07 : 0.05;
const phaseLabel = { style: { color: t.inkSoft, fontSize: "11px", fontStyle: "italic" }, y: 18, align: "center" };

Highcharts.chart("container", {
  chart: {
    backgroundColor: "transparent",
    animation: false,
    style: { fontFamily: "inherit" },
    marginRight: 90
  },
  credits: { enabled: false },
  colors: t.palette,
  title: {
    text: TITLE,
    style: { color: t.ink, fontSize: titleSize + "px", fontWeight: "600" }
  },
  xAxis: {
    type: "datetime",
    lineColor: t.inkSoft,
    tickColor: t.inkSoft,
    gridLineColor: t.grid,
    labels: { style: { color: t.inkSoft, fontSize: "14px" } },
    // Phase bands guide unfamiliar viewers through the training periodization narrative
    plotBands: [
      { from: START_MS, to: phase1End, color: `rgba(68,103,163,${bandAlpha})`,  label: { ...phaseLabel, text: "Build 1" } },
      { from: phase1End, to: phase2End, color: `rgba(68,103,163,${bandAlpha * 1.5})`, label: { ...phaseLabel, text: "Build 2" } },
      { from: phase2End, to: phase3End, color: `rgba(174,48,48,${bandAlpha})`,  label: { ...phaseLabel, text: "Peak" } },
      { from: phase3End, to: END_MS,    color: `rgba(0,158,115,${bandAlpha})`,  label: { ...phaseLabel, text: "Taper" } }
    ]
  },
  yAxis: [
    {
      // Left — CTL, ATL, and TSS share TSS-unit scale
      title: {
        text: "Training Load (TSS units)",
        style: { color: t.inkSoft, fontSize: "16px" }
      },
      min: 0,
      gridLineColor: t.grid,
      labels: { style: { color: t.inkSoft, fontSize: "14px" } }
    },
    {
      // Right — TSB form oscillates around zero
      title: {
        text: "Form / TSB",
        style: { color: t.inkSoft, fontSize: "16px" }
      },
      opposite: true,
      gridLineColor: "transparent",
      labels: { style: { color: t.inkSoft, fontSize: "14px" } },
      plotLines: [
        {
          value: 0,
          color: t.inkSoft,
          width: 1,
          dashStyle: "ShortDash",
          zIndex: 3
        },
        // CVD-redundant positional labels: provide text cues in addition to color
        {
          value: 20,
          color: "transparent",
          width: 0,
          label: {
            text: "Fresh ↑",
            style: { color: t.palette[0], fontSize: "11px", fontStyle: "italic" },
            align: "right",
            x: -4
          }
        },
        {
          value: -22,
          color: "transparent",
          width: 0,
          label: {
            text: "Fatigued ↓",
            style: { color: t.palette[4], fontSize: "11px", fontStyle: "italic" },
            align: "right",
            x: -4
          }
        }
      ]
    }
  ],
  legend: {
    enabled: true,
    align: "center",
    verticalAlign: "bottom",
    itemStyle: { color: t.inkSoft, fontSize: "14px", fontWeight: "normal" },
    itemHoverStyle: { color: t.ink }
  },
  plotOptions: {
    series: { animation: false },
    column: {
      borderWidth: 0,
      pointPadding: 0,
      groupPadding: 0,
      maxPointWidth: 4
    },
    area: { marker: { enabled: false } },
    spline: { marker: { enabled: false } }
  },
  series: [
    {
      // Raw daily training stress — subdued ochre bars, read as background input
      name: "Daily TSS",
      type: "column",
      data: tssPoints,
      yAxis: 0,
      color: t.palette[3],  // ochre #BD8233
      opacity: 0.45,
      zIndex: 1
    },
    {
      // TSB form area — green above zero (fresh), red below (fatigued)
      name: "Form (TSB)",
      type: "area",
      data: tsbPoints,
      yAxis: 1,
      threshold: 0,
      color: t.palette[0],                                        // green #009E73 — positive/fresh
      fillColor: "rgba(0,158,115,0.22)",
      negativeColor: t.palette[4],                               // red #AE3030 — negative/fatigued
      negativeFillColor: `rgba(174,48,48,${negFillAlpha})`,      // boosted alpha on dark bg
      lineWidth: 1.5,
      zIndex: 2
    },
    {
      // CTL fitness — smoothest, slowest-reacting line
      name: "Fitness (CTL)",
      type: "spline",
      data: ctlPoints,
      yAxis: 0,
      color: t.palette[2],  // blue #4467A3
      lineWidth: 3,
      zIndex: 4
    },
    {
      // ATL fatigue — spikier, faster-reacting line
      name: "Fatigue (ATL)",
      type: "spline",
      data: atlPoints,
      yAxis: 0,
      color: t.palette[1],  // lavender #C475FD
      lineWidth: 2.5,
      zIndex: 3
    }
  ]
});
Runnable source as JSON, for any HTTP client: https://api.anyplot.ai/specs/line-training-load-pmc/highcharts/code. Any spec id and library id listed in llms-full.txt fit the same URL shape; every URL below is complete and callable.
{
  "spec_id": "line-training-load-pmc",
  "language": "javascript",
  "library": "highcharts",
  "page": "https://anyplot.ai/line-training-load-pmc/javascript/highcharts",
  "hub": "https://anyplot.ai/line-training-load-pmc",
  "code_json": "https://api.anyplot.ai/specs/line-training-load-pmc/highcharts/code",
  "spec_json": "https://api.anyplot.ai/specs/line-training-load-pmc",
  "render_light_png": "https://storage.googleapis.com/anyplot-images/plots/line-training-load-pmc/javascript/highcharts/plot-light.png",
  "render_dark_png": "https://storage.googleapis.com/anyplot-images/plots/line-training-load-pmc/javascript/highcharts/plot-dark.png",
  "interactive_light_html": "https://storage.googleapis.com/anyplot-images/plots/line-training-load-pmc/javascript/highcharts/plot-light.html",
  "interactive_dark_html": "https://storage.googleapis.com/anyplot-images/plots/line-training-load-pmc/javascript/highcharts/plot-dark.html",
  "quality_score": 91.0,
  "license": "MIT",
  "guide": "https://anyplot.ai/llms.txt"
}
Part of Training Load Performance Management Chart on anyplot.ai.