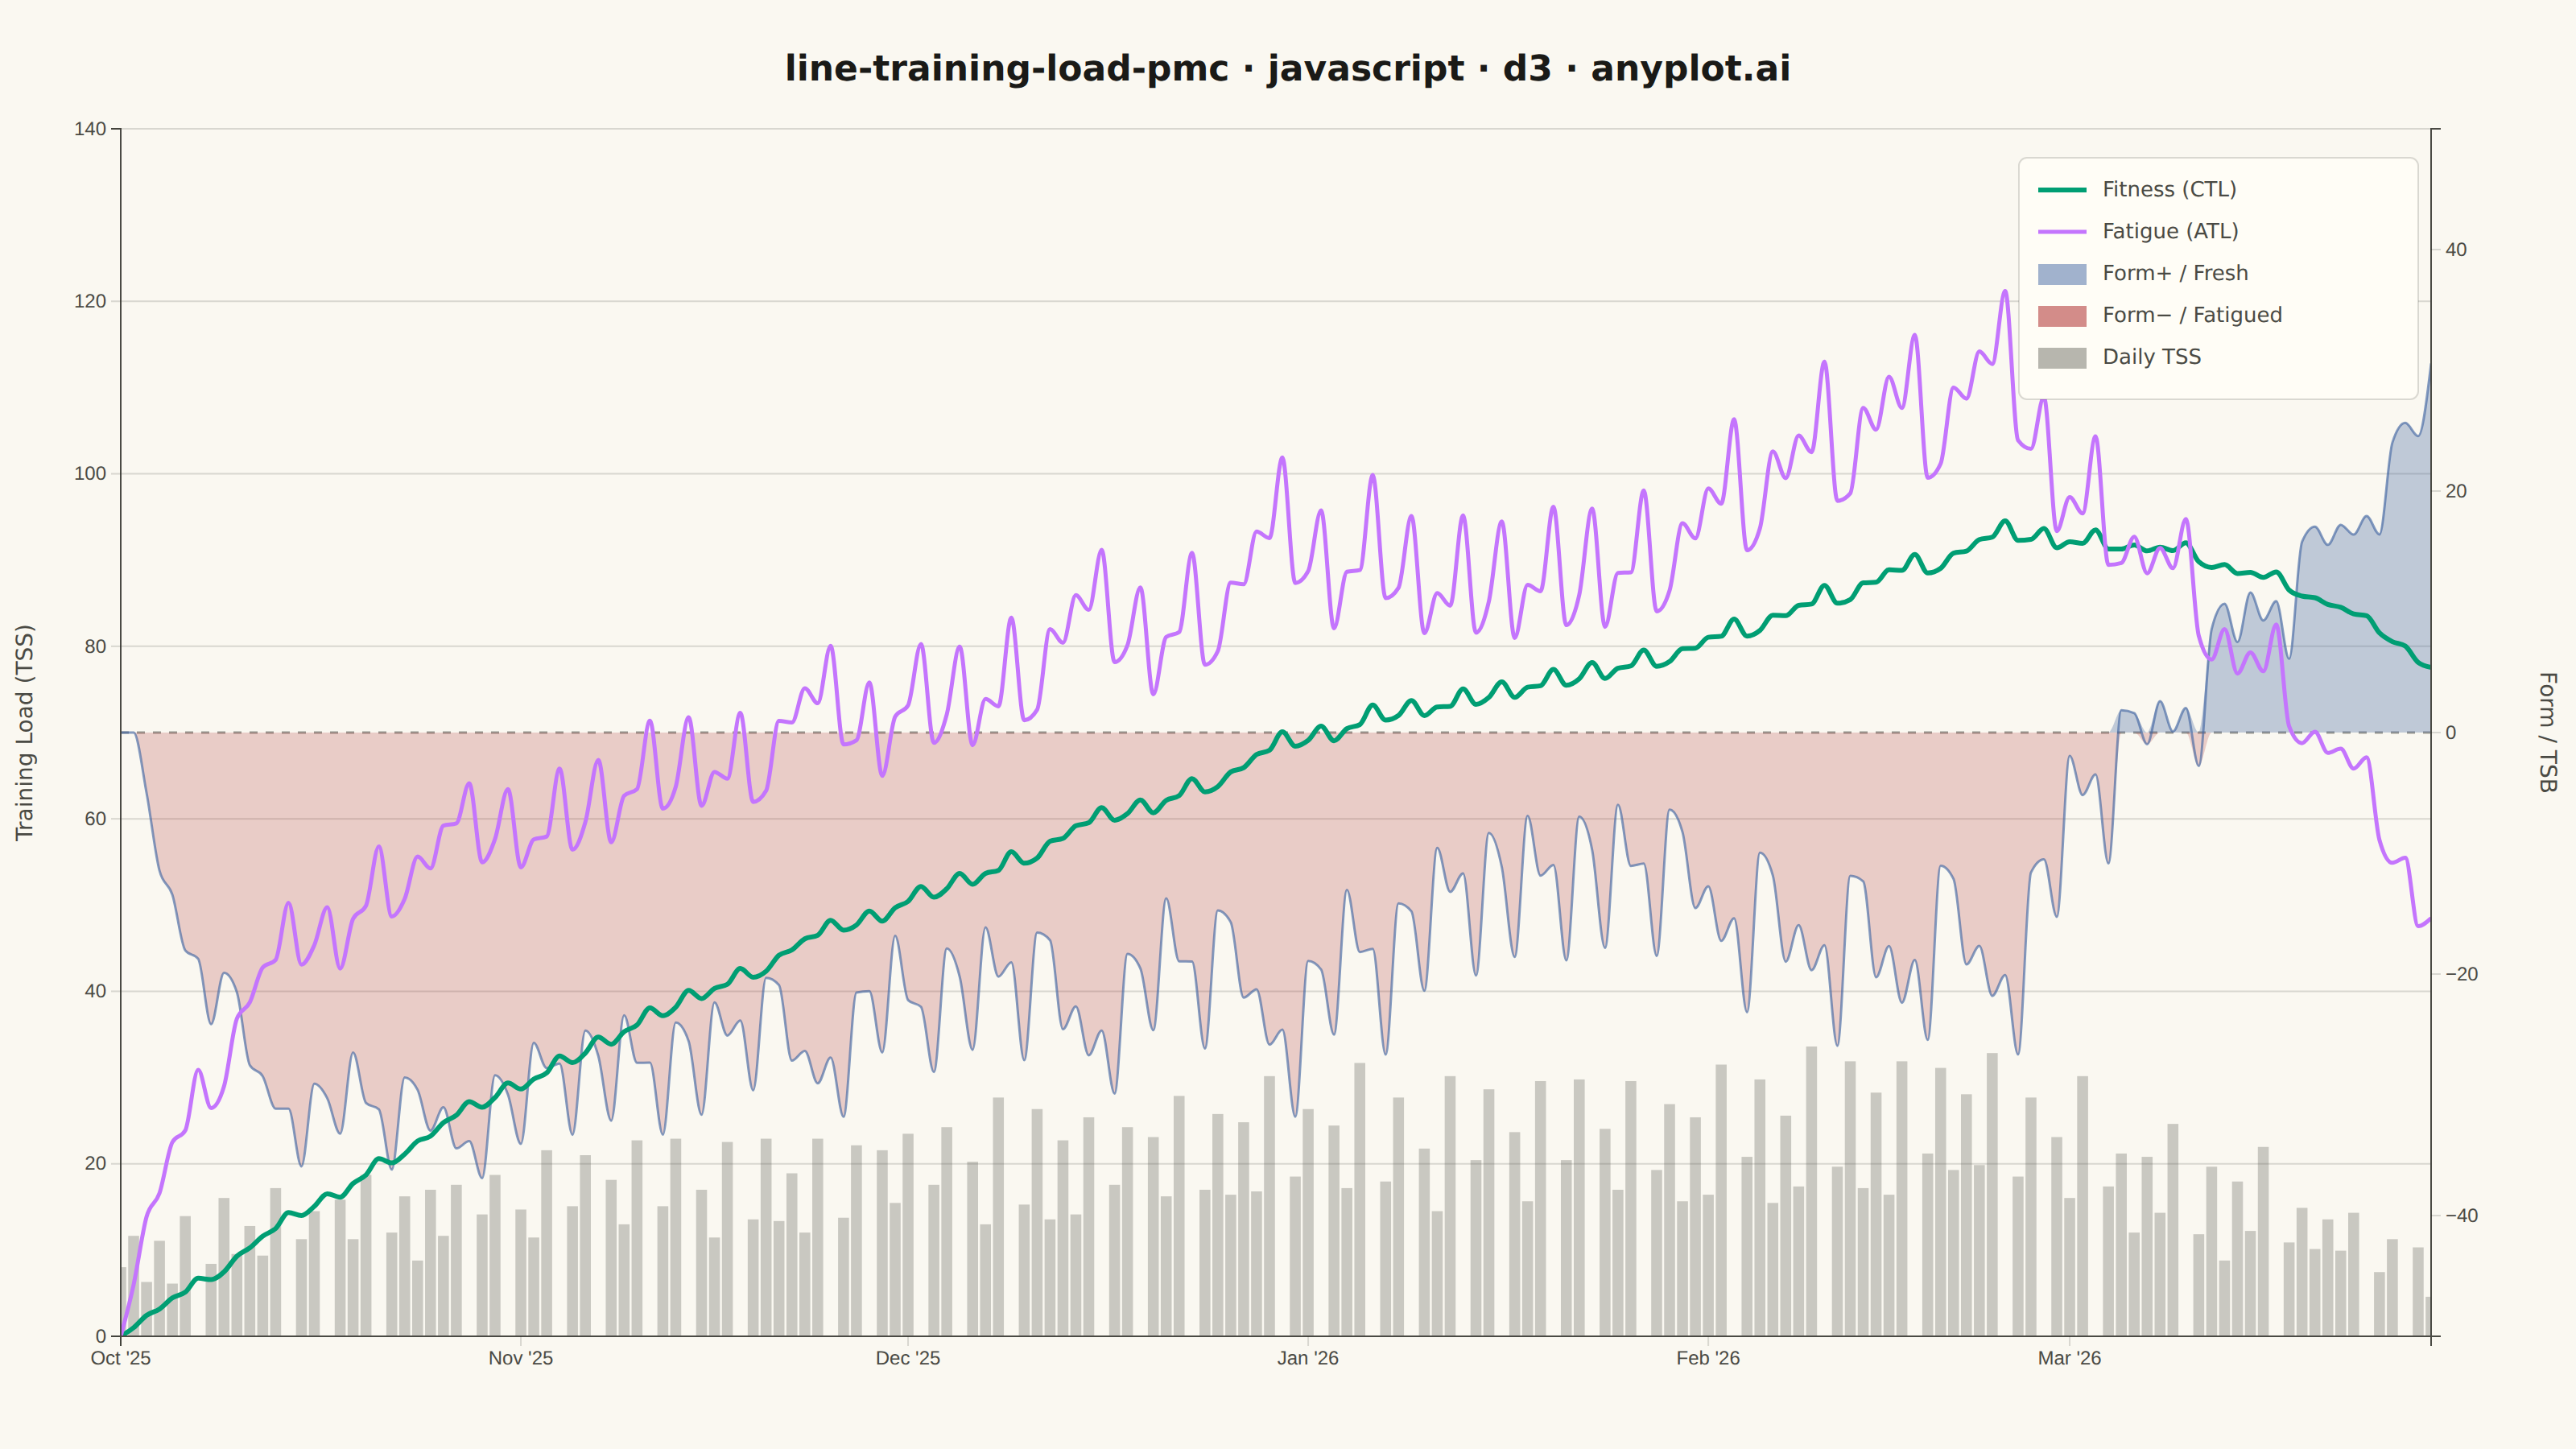
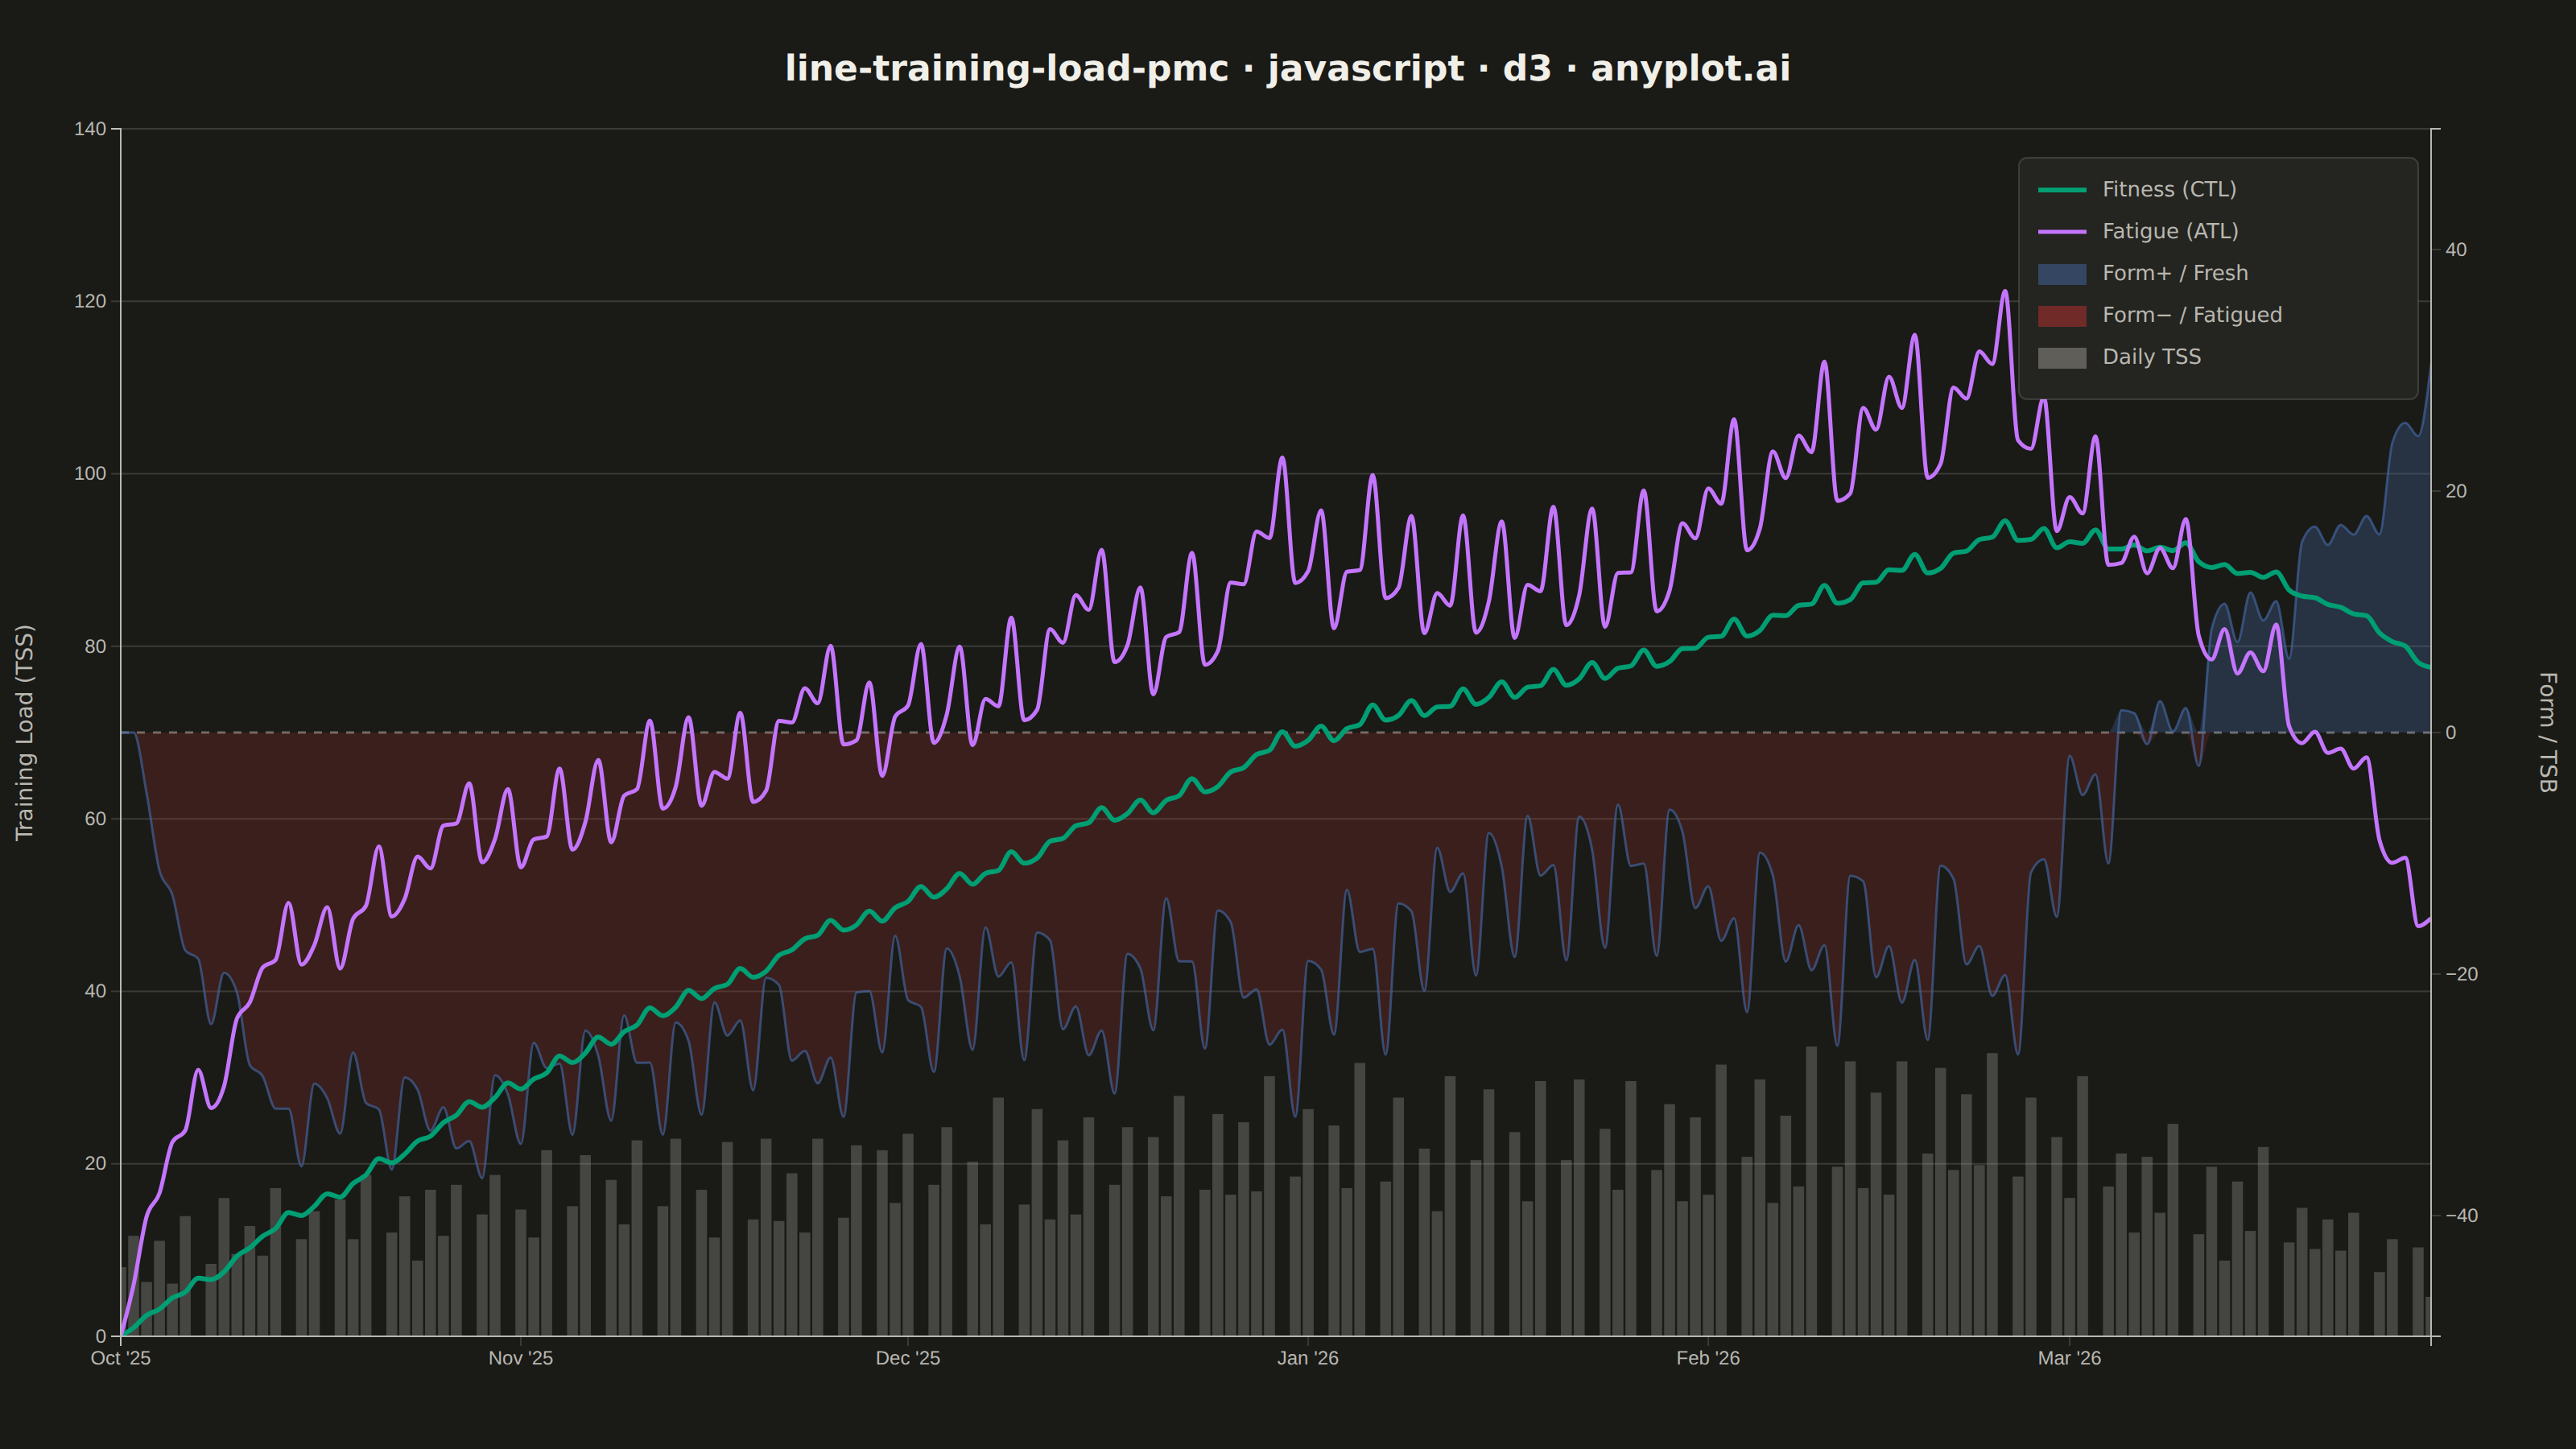
A Performance Management Chart (PMC), popularized by TrainingPeaks, summarizes an endurance athlete's training history on a single shared time axis. Two exponentially-smoothed lines track Chronic Training Load (CTL, "fitness", ~42-day time constant) and Acute Training Load (ATL, "fatigue", ~7-day time constant), while a filled area or band shows Training Stress Balance (TSB, "form" = CTL − ATL) above and below a zero baseline. Daily Training Stress Score (TSS) values appear as points or thin vertical bars, giving the raw workout intensity behind the smoothed trends. The chart reveals whether an athlete is building fitness, accumulating fatigue, or freshening up (positive form) for a target event.
// anyplot.ai
// line-training-load-pmc: Training Load Performance Management Chart
// Library: d3 7.9.0 | JavaScript 22.22.3
// Quality: 93/100 | Created: 2026-06-13

const t = window.ANYPLOT_TOKENS;
const { width, height } = window.ANYPLOT_SIZE;

const margin = { top: 80, right: 90, bottom: 70, left: 75 };
const iw = width - margin.left - margin.right;
const ih = height - margin.top - margin.bottom;

// Seeded LCG RNG (browser has no seeded Math.random)
let _seed = 42;
const rng = () => { _seed = (1664525 * _seed + 1013904223) >>> 0; return _seed / 4294967296; };

// --- Data: 180-day cycling season (Oct 2025 – Mar 2026) -------------------
const N = 180;
const DAY_MS = 86400000;
const startMs = new Date(2025, 9, 1).getTime(); // Oct 1, 2025
const dates = Array.from({ length: N }, (_, i) => new Date(startMs + i * DAY_MS));

// Periodized TSS: 6-wk build → 8-wk peak → 6-wk race prep → 6-wk taper
const tssRaw = Array.from({ length: N }, (_, i) => {
  const week = Math.floor(i / 7);
  const dow = i % 7; // 0=Mon … 6=Sun
  if (dow === 6) return 0; // Sunday always rest
  if (dow === 2 && rng() < 0.45) return 0; // occasional Wednesday rest

  let base;
  if (week < 6)       base = 55 + week * 6;         // build:   55 → 85
  else if (week < 14) base = 88 + (week - 6) * 4;   // peak:    88 → 116
  else if (week < 20) base = 112 + (week - 14) * 3; // race:   112 → 127
  else                base = 130 - (week - 20) * 17; // taper:  130 → 45

  const dayMult = [0.85, 1.25, 0.7, 1.1, 0.75, 1.35, 0][dow];
  const jitter = (rng() - 0.5) * 20;
  return Math.max(0, Math.round(base * dayMult + jitter));
});

// EWMA: CTL (42-day fitness) and ATL (7-day fatigue)
const ctl = [0];
const atl = [0];
for (let i = 1; i < N; i++) {
  ctl.push(ctl[i - 1] + (tssRaw[i - 1] - ctl[i - 1]) / 42);
  atl.push(atl[i - 1] + (tssRaw[i - 1] - atl[i - 1]) / 7);
}
// TSB = yesterday's CTL − yesterday's ATL
const tsb = ctl.map((_, i) => (i === 0 ? 0 : ctl[i - 1] - atl[i - 1]));

const data = dates.map((date, i) => ({
  date, tss: tssRaw[i], ctl: ctl[i], atl: atl[i], tsb: tsb[i],
}));

// --- SVG mount -------------------------------------------------------------
const svg = d3.select("#container")
  .append("svg").attr("width", width).attr("height", height)
  .style("font-family", "system-ui, -apple-system, sans-serif");
const g = svg.append("g").attr("transform", `translate(${margin.left},${margin.top})`);

// Clip path for data layers
svg.append("defs").append("clipPath").attr("id", "clip")
  .append("rect").attr("width", iw).attr("height", ih);

// --- Scales ----------------------------------------------------------------
const x = d3.scaleTime().domain([dates[0], dates[N - 1]]).range([0, iw]);

const ctlAtlMax = d3.max(data, (d) => Math.max(d.ctl, d.atl)) * 1.12;
const yLeft = d3.scaleLinear().domain([0, ctlAtlMax]).nice().range([ih, 0]);

const tsbExtent = Math.max(
  Math.abs(d3.min(data, (d) => d.tsb)),
  d3.max(data, (d) => d.tsb)
) * 1.25;
const yRight = d3.scaleLinear().domain([-tsbExtent, tsbExtent]).nice().range([ih, 0]);

const tssMax = d3.max(data, (d) => d.tss) || 1;
const yTSS = d3.scaleLinear().domain([0, tssMax]).range([ih, ih * 0.76]); // bottom 24%

// --- Gridlines (y-left ticks, horizontal) ---------------------------------
const yTicks = yLeft.ticks(6);
g.append("g").selectAll("line.grid").data(yTicks).join("line")
  .attr("x1", 0).attr("x2", iw)
  .attr("y1", (d) => yLeft(d)).attr("y2", (d) => yLeft(d))
  .attr("stroke", t.grid).attr("stroke-width", 1);

// --- TSB zero reference line ----------------------------------------------
g.append("line")
  .attr("x1", 0).attr("x2", iw)
  .attr("y1", yRight(0)).attr("y2", yRight(0))
  .attr("stroke", t.inkSoft).attr("stroke-width", 1.5)
  .attr("stroke-dasharray", "5,5").attr("opacity", 0.55);

// --- TSS bars (raw daily load, behind all other elements) -----------------
const barW = Math.max(1.5, (iw / N) * 0.85);
const tssLayer = g.append("g").attr("clip-path", "url(#clip)");
tssLayer.selectAll("rect").data(data).join("rect")
  .attr("x", (d) => x(d.date) - barW / 2)
  .attr("y", (d) => yTSS(d.tss))
  .attr("width", barW)
  .attr("height", (d) => ih - yTSS(d.tss))
  .attr("fill", t.inkSoft)
  .attr("opacity", 0.28);

// --- TSB filled area (two-toned: blue = fresh/positive, red = fatigued/negative)
const curve = d3.curveMonotoneX;
const areaPos = d3.area().curve(curve)
  .x((d) => x(d.date)).y0(yRight(0)).y1((d) => yRight(Math.max(0, d.tsb)));
const areaNeg = d3.area().curve(curve)
  .x((d) => x(d.date)).y0(yRight(0)).y1((d) => yRight(Math.min(0, d.tsb)));
const lineTSB = d3.line().curve(curve)
  .x((d) => x(d.date)).y((d) => yRight(d.tsb));

const tsbLayer = g.append("g").attr("clip-path", "url(#clip)");
tsbLayer.append("path").datum(data)
  .attr("d", areaPos)
  .attr("fill", t.palette[2])   // #4467A3 blue = fresh
  .attr("opacity", 0.32);
tsbLayer.append("path").datum(data)
  .attr("d", areaNeg)
  .attr("fill", t.palette[4])   // #AE3030 red = fatigued
  .attr("opacity", 0.22);
tsbLayer.append("path").datum(data)
  .attr("d", lineTSB)
  .attr("fill", "none")
  .attr("stroke", t.palette[2])
  .attr("stroke-width", 1.5)
  .attr("opacity", 0.65);

// --- CTL line (fitness, Imprint pos 0 = brand green #009E73) -------------
const lineCTL = d3.line().curve(curve)
  .x((d) => x(d.date)).y((d) => yLeft(d.ctl));
const lineATL = d3.line().curve(curve)
  .x((d) => x(d.date)).y((d) => yLeft(d.atl));

const lineLayer = g.append("g").attr("clip-path", "url(#clip)");
lineLayer.append("path").datum(data)
  .attr("d", lineCTL)
  .attr("fill", "none")
  .attr("stroke", t.palette[0])   // #009E73 brand green = Fitness (CTL)
  .attr("stroke-width", 3);
lineLayer.append("path").datum(data)
  .attr("d", lineATL)
  .attr("fill", "none")
  .attr("stroke", t.palette[1])   // #C475FD lavender = Fatigue (ATL)
  .attr("stroke-width", 2.5);

// --- Axes ------------------------------------------------------------------
const dateFmt = d3.timeFormat("%b '%y");

const xAx = g.append("g").attr("transform", `translate(0,${ih})`)
  .call(d3.axisBottom(x).ticks(d3.timeMonth.every(1)).tickFormat(dateFmt));
xAx.selectAll("text").attr("fill", t.inkSoft).style("font-size", "12px");
xAx.selectAll("line").attr("stroke", t.grid);
xAx.select(".domain").attr("stroke", t.inkSoft);

const yAxL = g.append("g").call(d3.axisLeft(yLeft).ticks(6));
yAxL.selectAll("text").attr("fill", t.inkSoft).style("font-size", "12px");
yAxL.selectAll("line").attr("stroke", t.grid);
yAxL.select(".domain").attr("stroke", t.inkSoft);

const yAxR = g.append("g").attr("transform", `translate(${iw},0)`)
  .call(d3.axisRight(yRight).ticks(6));
yAxR.selectAll("text").attr("fill", t.inkSoft).style("font-size", "12px");
yAxR.selectAll("line").attr("stroke", t.grid);
yAxR.select(".domain").attr("stroke", t.inkSoft);

// --- Axis labels -----------------------------------------------------------
svg.append("text")
  .attr("transform", "rotate(-90)")
  .attr("x", -(margin.top + ih / 2))
  .attr("y", 20)
  .attr("text-anchor", "middle")
  .attr("fill", t.inkSoft).style("font-size", "14px")
  .text("Training Load (TSS)");

svg.append("text")
  .attr("transform", "rotate(90)")
  .attr("x", margin.top + ih / 2)
  .attr("y", -(width - 22))
  .attr("text-anchor", "middle")
  .attr("fill", t.inkSoft).style("font-size", "14px")
  .text("Form / TSB");

// --- Legend ---------------------------------------------------------------
const lItems = [
  { label: "Fitness (CTL)", type: "line", stroke: t.palette[0], sw: 3 },
  { label: "Fatigue (ATL)", type: "line", stroke: t.palette[1], sw: 2.5 },
  { label: "Form+ / Fresh",  type: "rect", fill: t.palette[2], opacity: 0.5 },
  { label: "Form− / Fatigued", type: "rect", fill: t.palette[4], opacity: 0.55 },
  { label: "Daily TSS",     type: "rect", fill: t.inkSoft,    opacity: 0.4 },
];
const lW = 248;
const lH = lItems.length * 26 + 20;
const legendX = margin.left + iw - lW - 8;
const legendY = margin.top + 18;

const leg = svg.append("g").attr("transform", `translate(${legendX},${legendY})`);
leg.append("rect")
  .attr("width", lW).attr("height", lH)
  .attr("fill", t.elevatedBg).attr("rx", 5)
  .attr("stroke", t.grid).attr("stroke-width", 1);

lItems.forEach((item, i) => {
  const iy = 14 + i * 26;
  if (item.type === "line") {
    leg.append("line")
      .attr("x1", 12).attr("x2", 42).attr("y1", iy + 6).attr("y2", iy + 6)
      .attr("stroke", item.stroke).attr("stroke-width", item.sw);
  } else {
    leg.append("rect")
      .attr("x", 12).attr("y", iy).attr("width", 30).attr("height", 13)
      .attr("fill", item.fill).attr("opacity", item.opacity);
  }
  leg.append("text")
    .attr("x", 52).attr("y", iy + 10)
    .attr("fill", t.inkSoft).style("font-size", "13px")
    .text(item.label);
});

// --- Title ----------------------------------------------------------------
svg.append("text")
  .attr("x", width / 2).attr("y", 50)
  .attr("text-anchor", "middle")
  .attr("fill", t.ink).style("font-size", "22px").style("font-weight", "600")
  .text("line-training-load-pmc · javascript · d3 · anyplot.ai");
Runnable source as JSON, for any HTTP client: https://api.anyplot.ai/specs/line-training-load-pmc/d3/code. Any spec id and library id listed in llms-full.txt fit the same URL shape; every URL below is complete and callable.
{
  "spec_id": "line-training-load-pmc",
  "language": "javascript",
  "library": "d3",
  "page": "https://anyplot.ai/line-training-load-pmc/javascript/d3",
  "hub": "https://anyplot.ai/line-training-load-pmc",
  "code_json": "https://api.anyplot.ai/specs/line-training-load-pmc/d3/code",
  "spec_json": "https://api.anyplot.ai/specs/line-training-load-pmc",
  "render_light_png": "https://storage.googleapis.com/anyplot-images/plots/line-training-load-pmc/javascript/d3/plot-light.png",
  "render_dark_png": "https://storage.googleapis.com/anyplot-images/plots/line-training-load-pmc/javascript/d3/plot-dark.png",
  "interactive_light_html": "https://storage.googleapis.com/anyplot-images/plots/line-training-load-pmc/javascript/d3/plot-light.html",
  "interactive_dark_html": "https://storage.googleapis.com/anyplot-images/plots/line-training-load-pmc/javascript/d3/plot-dark.html",
  "quality_score": 93.0,
  "license": "MIT",
  "guide": "https://anyplot.ai/llms.txt"
}
Part of Training Load Performance Management Chart on anyplot.ai.