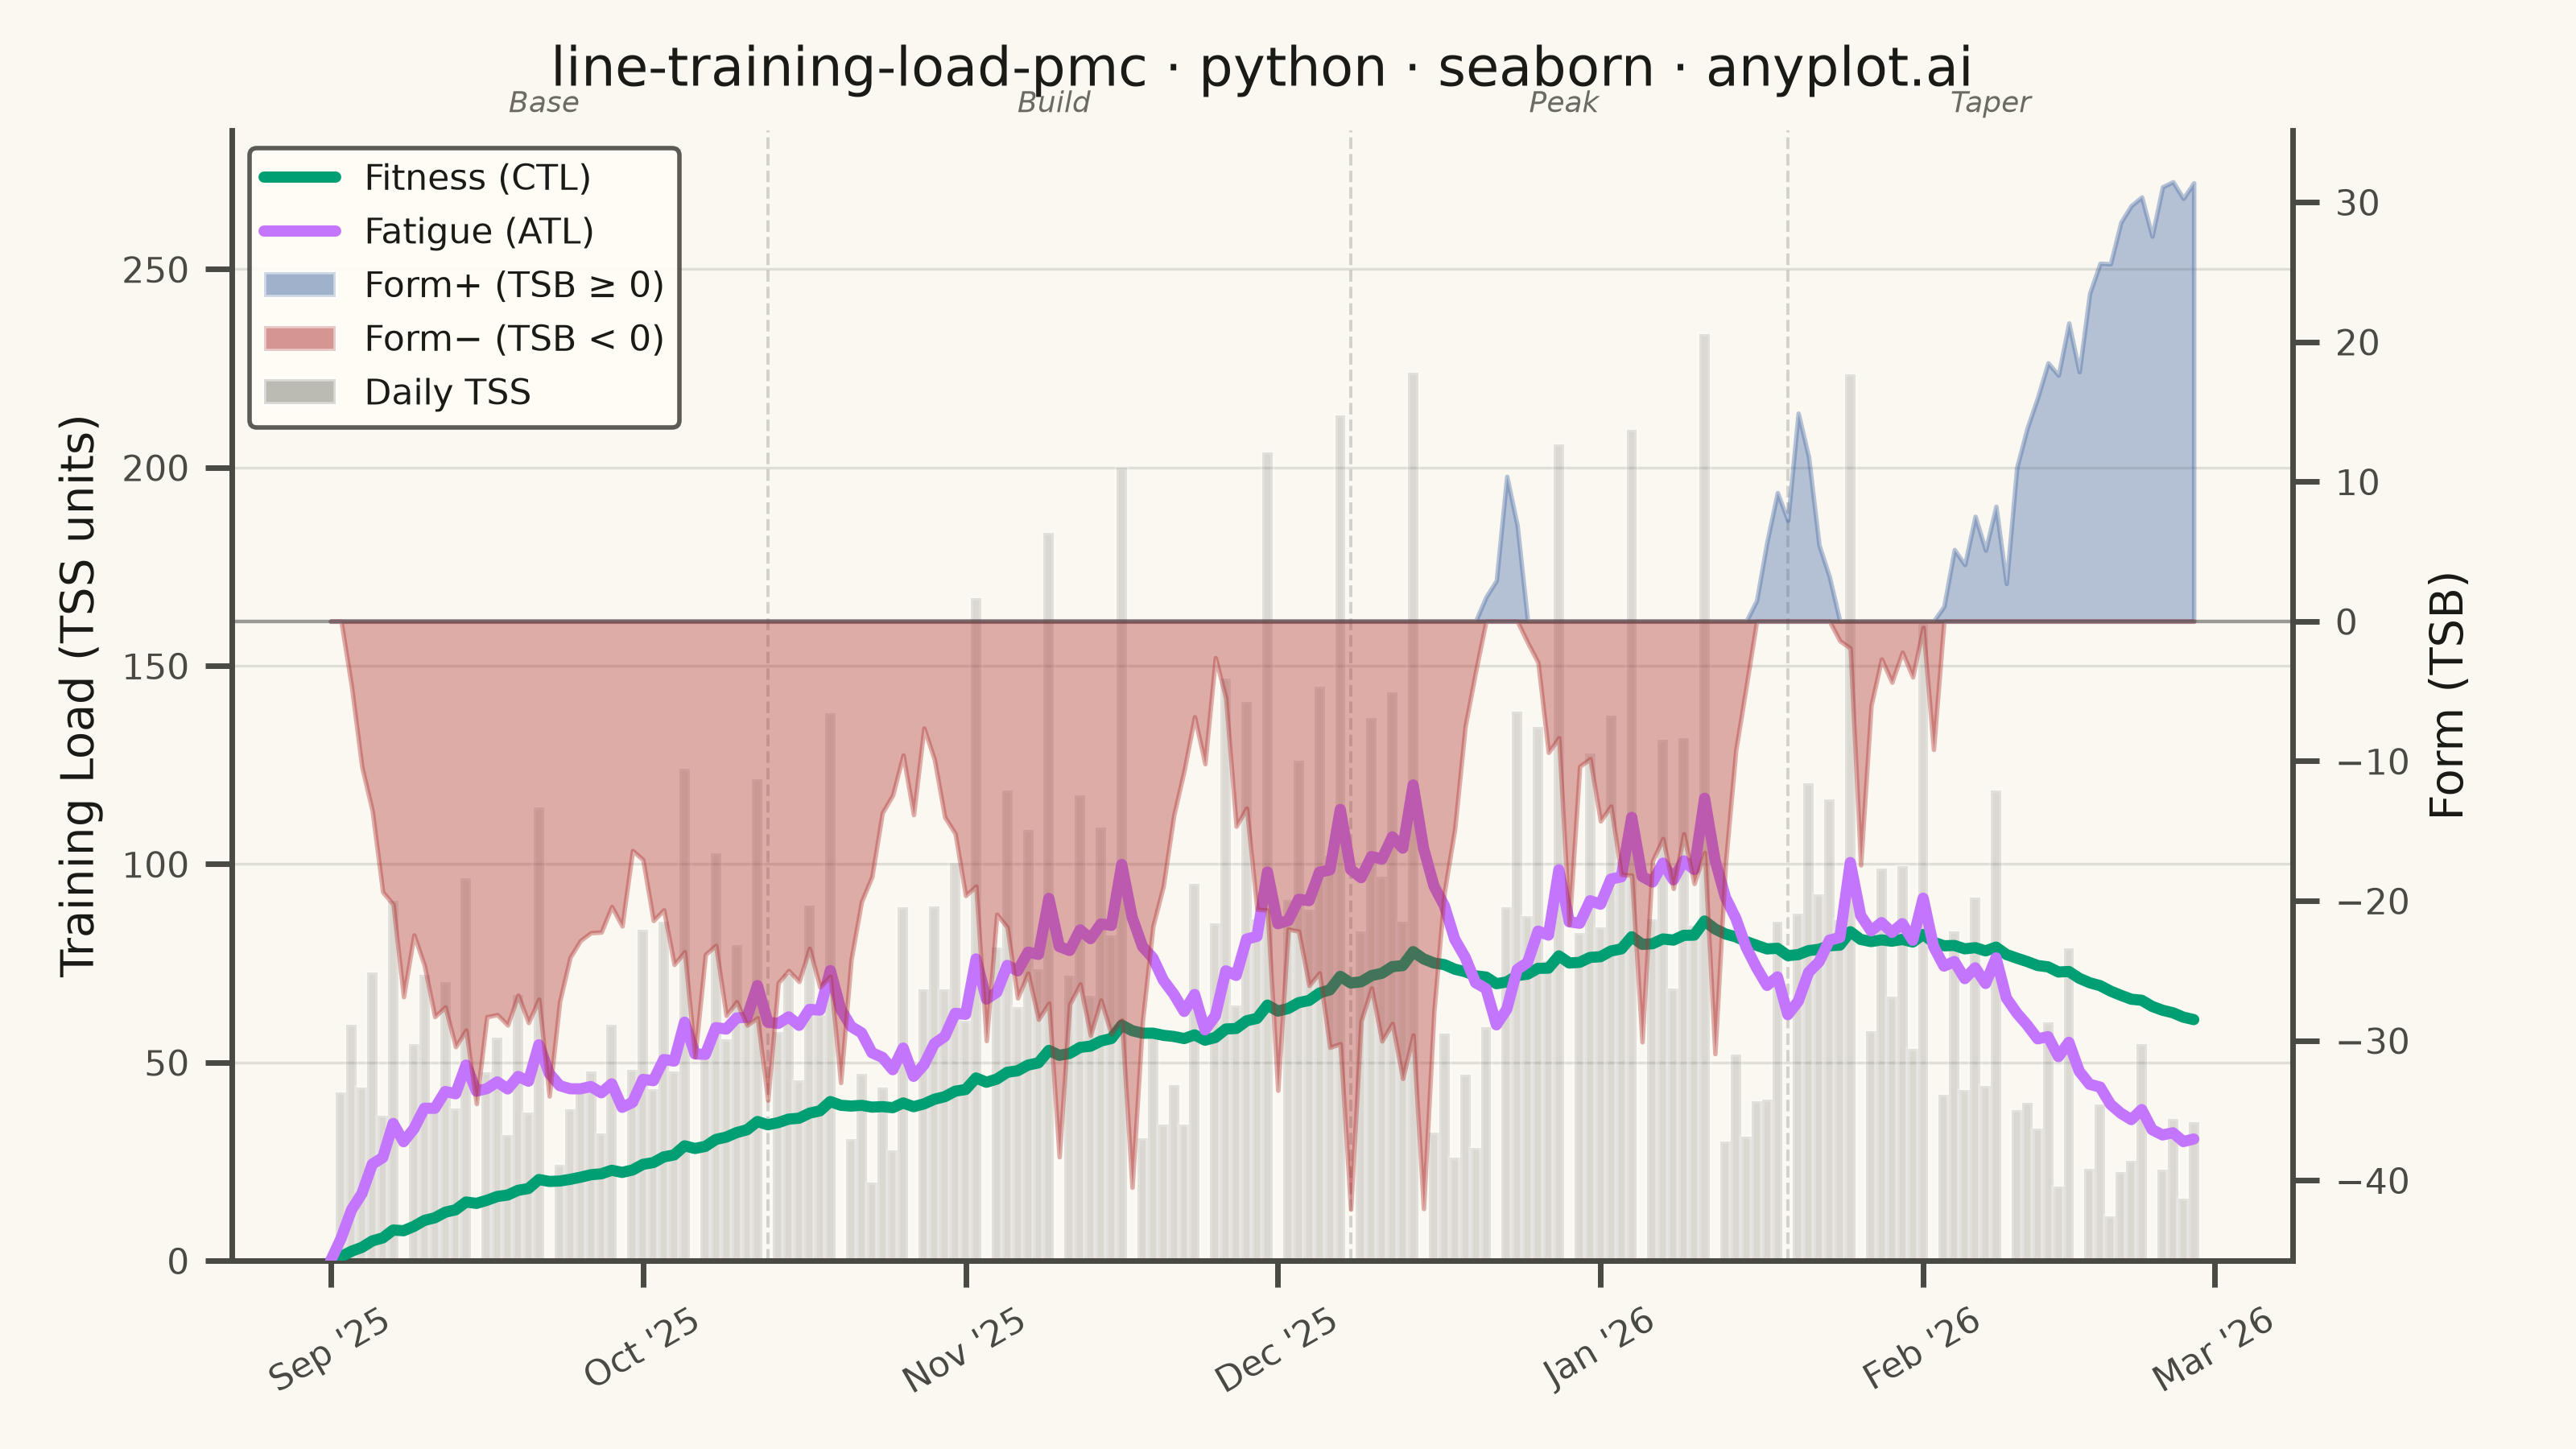
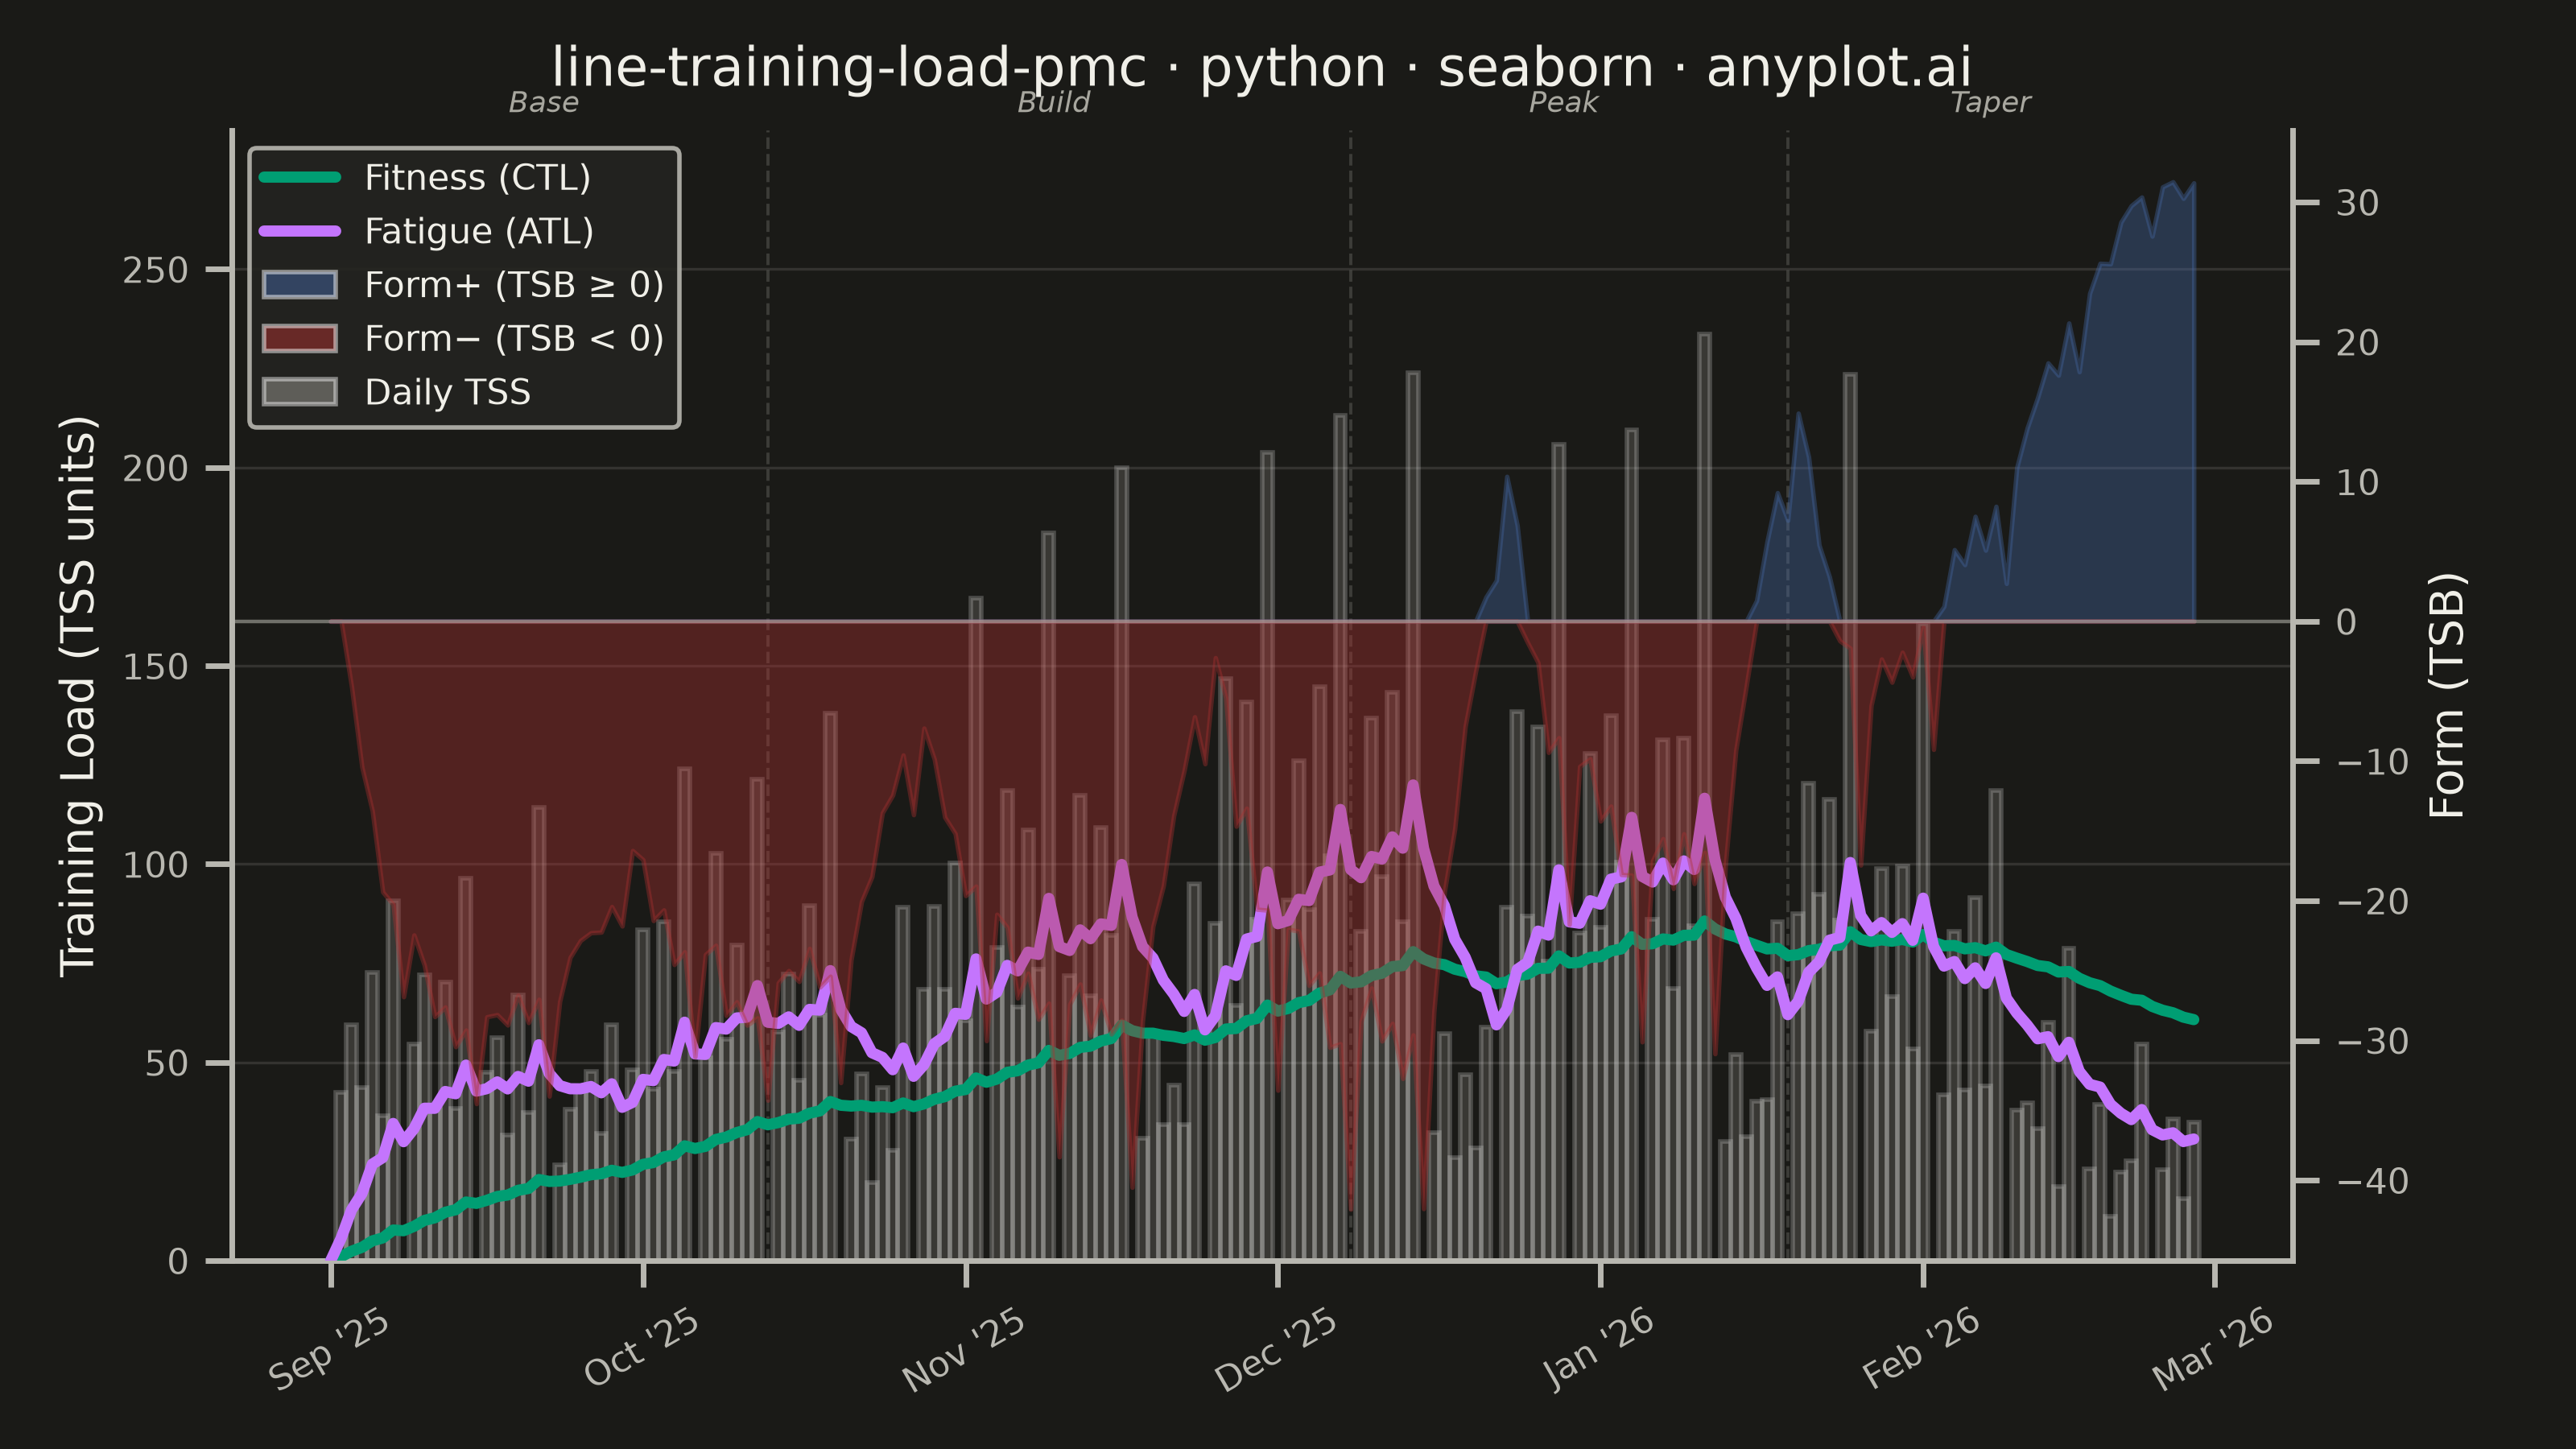
A Performance Management Chart (PMC), popularized by TrainingPeaks, summarizes an endurance athlete's training history on a single shared time axis. Two exponentially-smoothed lines track Chronic Training Load (CTL, "fitness", ~42-day time constant) and Acute Training Load (ATL, "fatigue", ~7-day time constant), while a filled area or band shows Training Stress Balance (TSB, "form" = CTL − ATL) above and below a zero baseline. Daily Training Stress Score (TSS) values appear as points or thin vertical bars, giving the raw workout intensity behind the smoothed trends. The chart reveals whether an athlete is building fitness, accumulating fatigue, or freshening up (positive form) for a target event.
""" anyplot.ai
line-training-load-pmc: Training Load Performance Management Chart
Library: seaborn 0.13.2 | Python 3.13.13
Quality: 90/100 | Created: 2026-06-13
"""

import os as _os
import sys as _sys


# Prevent this file (seaborn.py) from shadowing the installed seaborn package
_here = _os.path.dirname(_os.path.abspath(__file__))
while _here in _sys.path:
    _sys.path.remove(_here)
del _here

import os

import matplotlib.dates as mdates
import matplotlib.lines as mlines
import matplotlib.patches as mpatches
import matplotlib.pyplot as plt
import numpy as np
import pandas as pd
import seaborn as sns


# Theme tokens
THEME = os.getenv("ANYPLOT_THEME", "light")
PAGE_BG = "#FAF8F1" if THEME == "light" else "#1A1A17"
ELEVATED_BG = "#FFFDF6" if THEME == "light" else "#242420"
INK = "#1A1A17" if THEME == "light" else "#F0EFE8"
INK_SOFT = "#4A4A44" if THEME == "light" else "#B8B7B0"
INK_MUTED = "#6B6A63" if THEME == "light" else "#A8A79F"

# Imprint palette positions for PMC series (first series always #009E73)
CTL_COLOR = "#009E73"  # brand green (pos 1) — Fitness/CTL: growth, health
ATL_COLOR = "#C475FD"  # lavender   (pos 2) — Fatigue/ATL
TSB_POS = "#4467A3"  # blue       (pos 3) — positive form (fresh)
TSB_NEG = "#AE3030"  # matte red  (pos 5) — negative form (semantic: bad/fatigued)

sns.set_theme(
    style="ticks",
    rc={
        "figure.facecolor": PAGE_BG,
        "axes.facecolor": PAGE_BG,
        "axes.edgecolor": INK_SOFT,
        "axes.labelcolor": INK,
        "text.color": INK,
        "xtick.color": INK_SOFT,
        "ytick.color": INK_SOFT,
        "grid.color": INK,
        "grid.alpha": 0.15,
        "legend.facecolor": ELEVATED_BG,
        "legend.edgecolor": INK_SOFT,
    },
)

# Data — 180-day endurance training block (Sep 2025 – Feb 2026)
np.random.seed(42)
n_days = 180
dates = pd.date_range("2025-09-01", periods=n_days, freq="D")

# Periodised schedule: base → build → peak → taper
tss_values = []
for i in range(n_days):
    week = i // 7
    dow = i % 7

    if week % 4 == 3:  # recovery week
        base = 45
    elif week < 6:  # base phase
        base = 55 + week * 5
    elif week < 14:  # build phase
        base = 80 + (week - 6) * 7
    elif week < 20:  # peak phase
        base = 128 - (week - 14) * 2
    else:  # taper
        base = max(30, 116 - (week - 20) * 22)

    if dow == 0:  # Monday: complete rest
        load = 0.0
    elif dow == 6:  # Sunday: long session
        load = base * 1.7 + np.random.normal(0, 12)
    elif dow in (2, 4):  # Tue/Thu: quality sessions
        load = base * 1.1 + np.random.normal(0, 8)
    else:  # easy/moderate
        load = base * 0.7 + np.random.normal(0, 8)

    tss_values.append(max(0.0, round(load, 1)))

tss = np.array(tss_values)

# TrainingPeaks EWMA: CTL (42-day time constant) and ATL (7-day)
alpha_ctl = 1 - np.exp(-1 / 42)
alpha_atl = 1 - np.exp(-1 / 7)

ctl = np.zeros(n_days)
atl = np.zeros(n_days)
tsb = np.zeros(n_days)
ctl[0] = tss[0]
atl[0] = tss[0]

for i in range(1, n_days):
    tsb[i] = ctl[i - 1] - atl[i - 1]
    ctl[i] = ctl[i - 1] + (tss[i] - ctl[i - 1]) * alpha_ctl
    atl[i] = atl[i - 1] + (tss[i] - atl[i - 1]) * alpha_atl

# Long-form dataframe for seaborn lineplot
df_lines = pd.concat(
    [
        pd.DataFrame({"date": dates, "value": ctl, "metric": "Fitness (CTL)"}),
        pd.DataFrame({"date": dates, "value": atl, "metric": "Fatigue (ATL)"}),
    ],
    ignore_index=True,
)

# Plot
fig, ax1 = plt.subplots(figsize=(8, 4.5), dpi=400, facecolor=PAGE_BG)
ax1.set_facecolor(PAGE_BG)

ax2 = ax1.twinx()

# Layer 1 — daily TSS impulses (background)
ax1.bar(dates, tss, color=INK_MUTED, alpha=0.22, width=pd.Timedelta(days=1), zorder=1)

# Layer 2 — TSB filled zones on secondary axis (fresh vs fatigued)
ax2.fill_between(dates, 0, np.where(tsb >= 0, tsb, 0), color=TSB_POS, alpha=0.38, zorder=2)
ax2.fill_between(dates, np.where(tsb < 0, tsb, 0), 0, color=TSB_NEG, alpha=0.38, zorder=2)
ax2.axhline(0, color=INK_SOFT, linewidth=0.8, alpha=0.55, zorder=3)

# Layer 3 — CTL and ATL smoothed lines via seaborn
sns.lineplot(
    data=df_lines,
    x="date",
    y="value",
    hue="metric",
    palette={"Fitness (CTL)": CTL_COLOR, "Fatigue (ATL)": ATL_COLOR},
    linewidth=2.5,
    ax=ax1,
    zorder=5,
)
if ax1.get_legend() is not None:
    ax1.get_legend().remove()

# Explicit ylim with headroom so phase labels have a clear slot above bars
y_data_max = max(float(tss.max()), float(atl.max()))
ax1.set_ylim(0, y_data_max * 1.22)

# Training phase boundary lines (subtle dashes at phase transitions)
phase_transition_dates = [dates[42], dates[98], dates[140]]
for d in phase_transition_dates:
    ax1.axvline(d, color=INK_SOFT, alpha=0.22, linewidth=0.7, linestyle="--", zorder=1)

# Phase labels — annotated just above the top axis spine (axes-fraction y)
phase_segments = [
    ("Base", dates[0], dates[41]),
    ("Build", dates[42], dates[97]),
    ("Peak", dates[98], dates[139]),
    ("Taper", dates[140], dates[179]),
]
xaxis_transform = ax1.get_xaxis_transform()
for phase_name, start, end in phase_segments:
    mid = start + (end - start) / 2
    ax1.annotate(
        phase_name,
        xy=(mid, 1.01),
        xycoords=xaxis_transform,
        ha="center",
        va="bottom",
        fontsize=6.5,
        color=INK_MUTED,
        style="italic",
        annotation_clip=False,
    )

# Style — primary axis: seaborn-idiomatic spine removal via sns.despine
title = "line-training-load-pmc · python · seaborn · anyplot.ai"
ax1.set_title(title, fontsize=12, fontweight="medium", color=INK, pad=10)
ax1.set_xlabel("", color=INK)
ax1.set_ylabel("Training Load (TSS units)", fontsize=10, color=INK)
ax1.tick_params(axis="y", labelsize=8, colors=INK_SOFT)
sns.despine(ax=ax1, top=True, right=True)
ax1.yaxis.grid(True, alpha=0.12, linewidth=0.6, color=INK, zorder=0)

ax1.xaxis.set_major_locator(mdates.MonthLocator())
ax1.xaxis.set_major_formatter(mdates.DateFormatter("%b '%y"))
ax1.tick_params(axis="x", labelsize=8, colors=INK_SOFT, rotation=30)

# Style — secondary axis (TSB)
ax2.set_ylabel("Form (TSB)", fontsize=10, color=INK)
ax2.tick_params(axis="y", labelsize=8, colors=INK_SOFT)
ax2.yaxis.label.set_color(INK)
ax2.spines["top"].set_visible(False)
ax2.spines["left"].set_visible(False)
ax2.spines["bottom"].set_visible(False)
ax2.spines["right"].set_color(INK_SOFT)

# Combined legend with manual handles
legend_handles = [
    mlines.Line2D([], [], color=CTL_COLOR, linewidth=2.5, label="Fitness (CTL)"),
    mlines.Line2D([], [], color=ATL_COLOR, linewidth=2.5, label="Fatigue (ATL)"),
    mpatches.Patch(facecolor=TSB_POS, alpha=0.5, label="Form+ (TSB ≥ 0)"),
    mpatches.Patch(facecolor=TSB_NEG, alpha=0.5, label="Form− (TSB < 0)"),
    mpatches.Patch(facecolor=INK_MUTED, alpha=0.45, label="Daily TSS"),
]
ax1.legend(
    handles=legend_handles, loc="upper left", fontsize=8, framealpha=0.9, facecolor=ELEVATED_BG, edgecolor=INK_SOFT
)

fig.subplots_adjust(left=0.09, right=0.89, top=0.91, bottom=0.13)
plt.savefig(f"plot-{THEME}.png", dpi=400, facecolor=PAGE_BG)
Runnable source as JSON, for any HTTP client: https://api.anyplot.ai/specs/line-training-load-pmc/seaborn/code. Any spec id and library id listed in llms-full.txt fit the same URL shape; every URL below is complete and callable.
{
  "spec_id": "line-training-load-pmc",
  "language": "python",
  "library": "seaborn",
  "page": "https://anyplot.ai/line-training-load-pmc/python/seaborn",
  "hub": "https://anyplot.ai/line-training-load-pmc",
  "code_json": "https://api.anyplot.ai/specs/line-training-load-pmc/seaborn/code",
  "spec_json": "https://api.anyplot.ai/specs/line-training-load-pmc",
  "render_light_png": "https://storage.googleapis.com/anyplot-images/plots/line-training-load-pmc/python/seaborn/plot-light.png",
  "render_dark_png": "https://storage.googleapis.com/anyplot-images/plots/line-training-load-pmc/python/seaborn/plot-dark.png",
  "quality_score": 90.0,
  "license": "MIT",
  "guide": "https://anyplot.ai/llms.txt"
}
Part of Training Load Performance Management Chart on anyplot.ai.