The same plot in 14 other libraries — JavaScript: D3.js, Apache ECharts, Highcharts, MUI X Charts; Python: Altair, Bokeh, lets-plot, Matplotlib, Plotly, plotnine, Pygal, Seaborn; R: ggplot2; Julia: Makie.jl. Compare all 15 side by side: Win Probability Chart in Python, R, Julia and JavaScript.
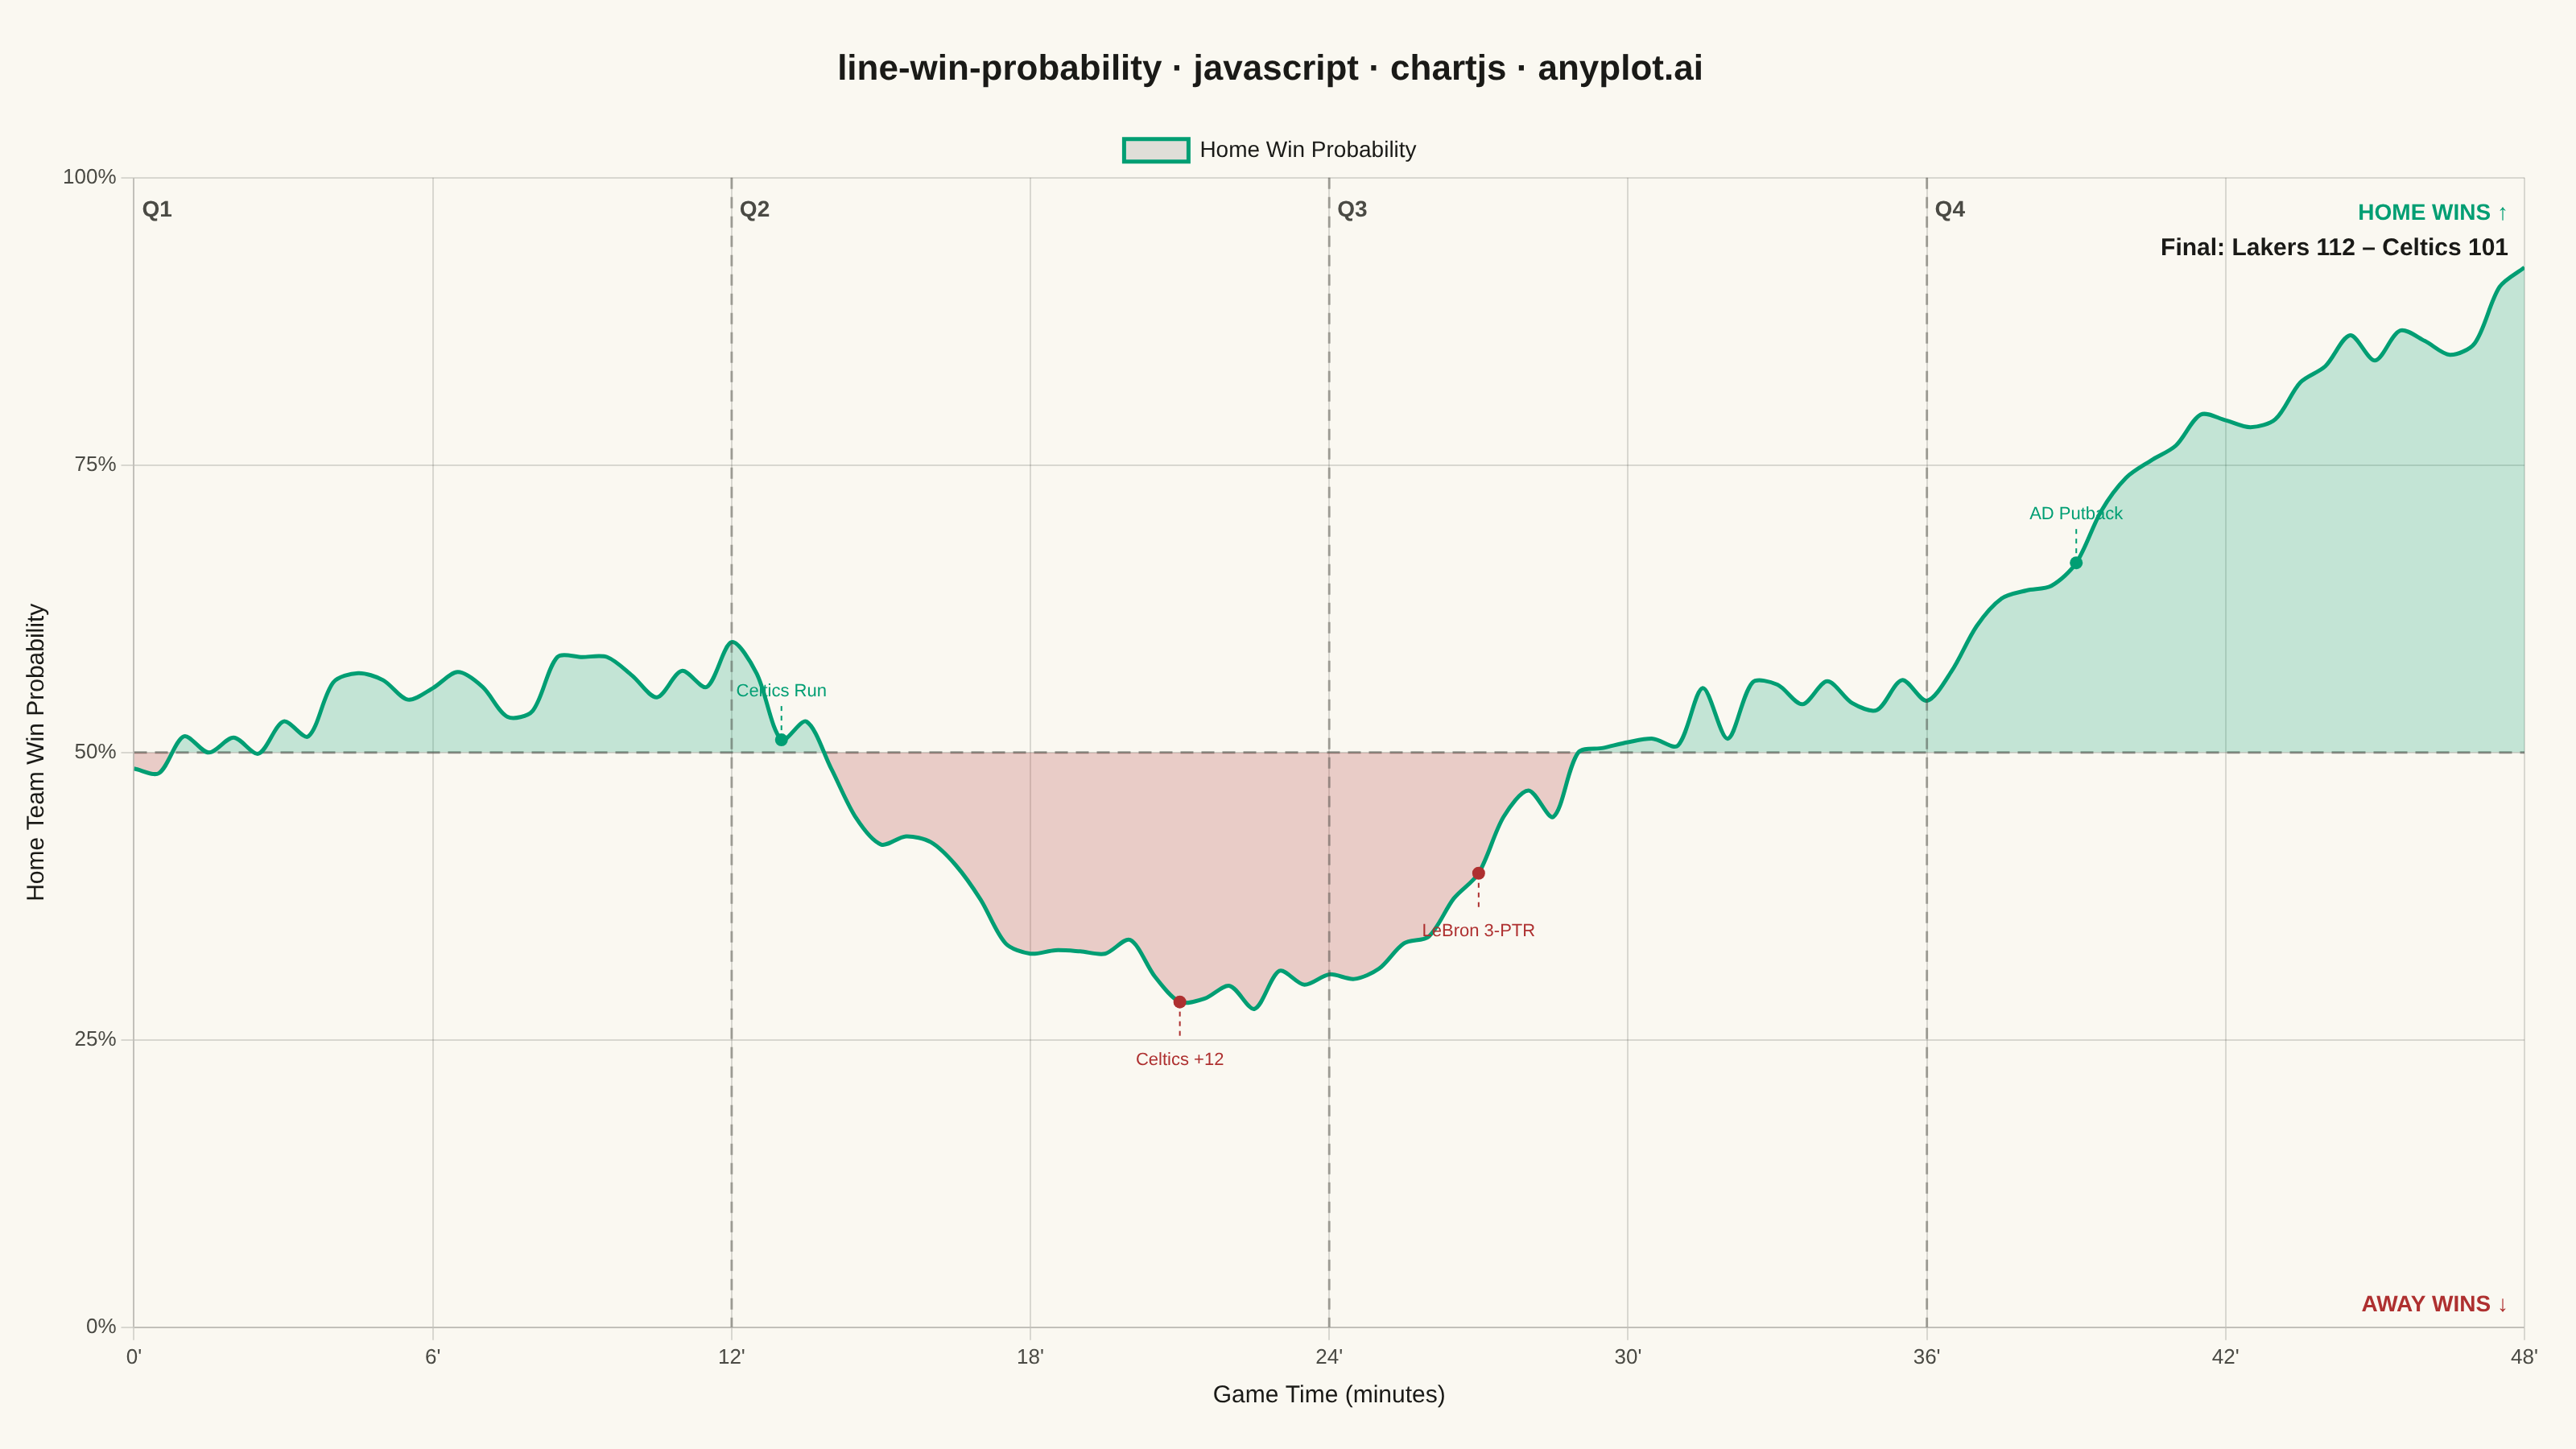
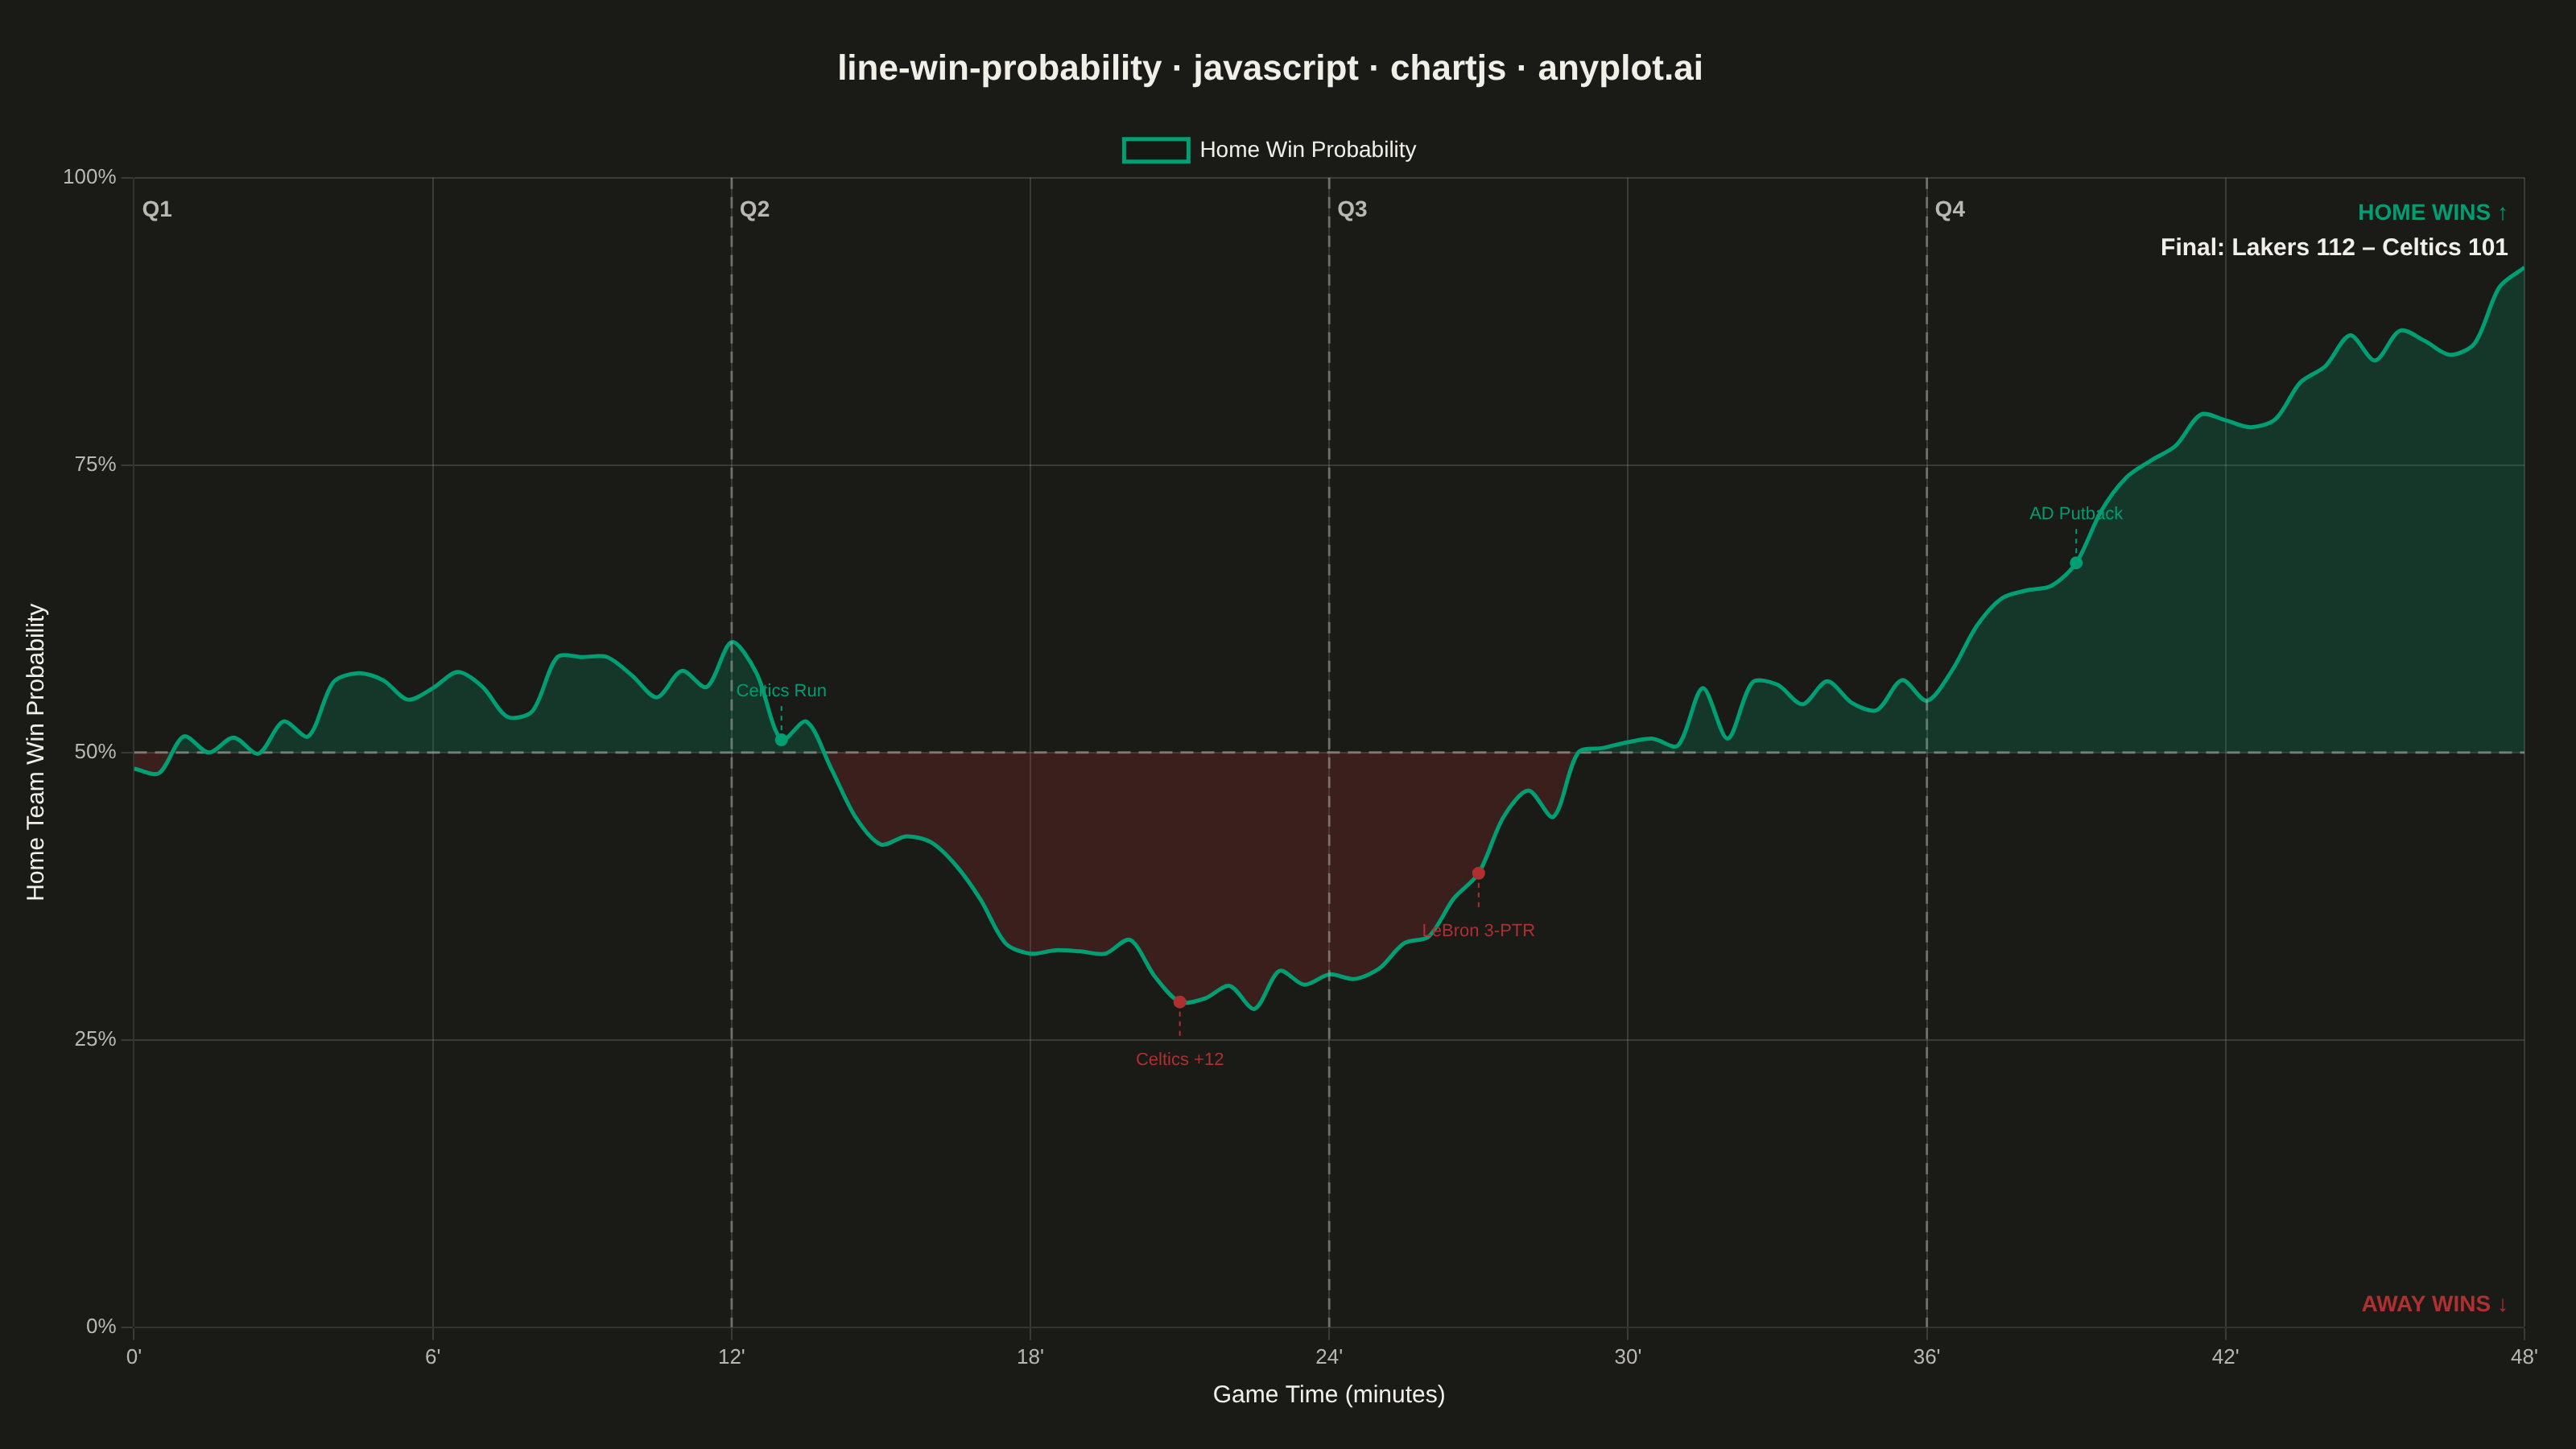
A win probability chart shows how each team's likelihood of winning evolves over the course of a game. The line starts near 50% and fluctuates based on scoring events, ultimately reaching 100% or 0% at game end. The area above and below the 50% baseline is filled with team colors to convey momentum at a glance. This visualization is widely used across major sports for post-game analysis and live broadcasting.
// anyplot.ai
// line-win-probability: Win Probability Chart
// Library: chartjs 4.4.7 | JavaScript 22.22.3
// Quality: 89/100 | Created: 2026-06-21

const t = window.ANYPLOT_TOKENS;

// Deterministic LCG for reproducible pseudo-random data
let seed = 42;
function lcg() {
  seed = (seed * 1664525 + 1013904223) >>> 0;
  return seed / 4294967295;
}

// NBA game: Lakers (home) vs Celtics (away), 48 minutes
// Narrative: home team trails in Q2, stages comeback, seals win in Q4
const TOTAL_MINUTES = 48;
const N = 97; // ~one point per 30 seconds

function trendAt(m) {
  if (m < 4)  return 0.500 + m * 0.010;
  if (m < 12) return 0.540 + (m - 4) * 0.004;
  if (m < 18) return 0.572 - (m - 12) * 0.042;
  if (m < 24) return 0.320 - (m - 18) * 0.005;
  if (m < 30) return 0.290 + (m - 24) * 0.038;
  if (m < 36) return 0.518 + (m - 30) * 0.008;
  if (m < 42) return 0.566 + (m - 36) * 0.038;
  return 0.794 + (m - 42) * 0.017;
}

const points = Array.from({ length: N }, (_, i) => {
  const m = (i / (N - 1)) * TOTAL_MINUTES;
  const trend = trendAt(m);
  const noise = (lcg() - 0.5) * 0.055;
  const prob = Math.min(0.98, Math.max(0.02, trend + noise));
  return { x: +m.toFixed(2), y: +(prob * 100).toFixed(1) };
});

const refLine = points.map(p => ({ x: p.x, y: 50 }));

// Imprint palette: home team = brand green, away team = matte red (semantic: win/loss)
const homeColor = t.palette[0]; // #009E73
const awayColor = t.palette[4]; // #AE3030
const HOME_FILL = "rgba(0, 158, 115, 0.22)";
const AWAY_FILL = "rgba(174, 48, 48, 0.22)";

// Key scoring events annotated on the probability line
const EVENTS = [
  { minute: 13, label: "Celtics Run" },   // Q2 start of big decline
  { minute: 21, label: "Celtics +12" },   // deepest deficit, ~30%
  { minute: 27, label: "LeBron 3-PTR" },  // comeback begins, ~40%
  { minute: 39, label: "AD Putback" },    // decisive surge, ~68%
];

// Quarter boundary + event annotation plugin
const quarterPlugin = {
  id: "quarters",
  afterDraw(chart) {
    const { ctx, chartArea: ca, scales } = chart;
    ctx.save();

    // Quarter dividers
    [12, 24, 36].forEach((q, i) => {
      const x = scales.x.getPixelForValue(q);
      ctx.beginPath();
      ctx.setLineDash([7, 5]);
      ctx.strokeStyle = t.inkSoft + "70";
      ctx.lineWidth = 1.5;
      ctx.moveTo(x, ca.top);
      ctx.lineTo(x, ca.bottom);
      ctx.stroke();
      ctx.setLineDash([]);
      ctx.fillStyle = t.inkSoft;
      ctx.font = "bold 14px sans-serif";
      ctx.textAlign = "left";
      ctx.fillText(`Q${i + 2}`, x + 5, ca.top + 20);
    });

    // Q1 label
    ctx.setLineDash([]);
    ctx.fillStyle = t.inkSoft;
    ctx.font = "bold 14px sans-serif";
    ctx.textAlign = "left";
    ctx.fillText("Q1", scales.x.getPixelForValue(0) + 5, ca.top + 20);

    // Scoring event annotations: dot + dashed connector + label
    EVENTS.forEach(ev => {
      const closest = points.reduce((best, p) =>
        Math.abs(p.x - ev.minute) < Math.abs(best.x - ev.minute) ? p : best
      );
      const ex = scales.x.getPixelForValue(closest.x);
      const ey = scales.y.getPixelForValue(closest.y);
      const isAbove = closest.y >= 50;
      const color = isAbove ? homeColor : awayColor;
      const dir = isAbove ? -1 : 1;
      const connLen = 24;

      // Dot on data line
      ctx.beginPath();
      ctx.arc(ex, ey, 4, 0, Math.PI * 2);
      ctx.fillStyle = color;
      ctx.fill();

      // Dashed connector
      ctx.beginPath();
      ctx.strokeStyle = color;
      ctx.lineWidth = 1;
      ctx.setLineDash([3, 3]);
      ctx.moveTo(ex, ey);
      ctx.lineTo(ex, ey + dir * connLen);
      ctx.stroke();
      ctx.setLineDash([]);

      // Event label
      ctx.fillStyle = color;
      ctx.font = "11px sans-serif";
      ctx.textAlign = "center";
      const labelY = isAbove ? ey - connLen - 6 : ey + connLen + 12;
      ctx.fillText(ev.label, ex, labelY);
    });

    // HOME / AWAY directional labels
    ctx.font = "bold 14px sans-serif";
    ctx.textAlign = "right";
    ctx.fillStyle = homeColor;
    ctx.fillText("HOME WINS ↑", ca.right - 10, ca.top + 22);
    ctx.fillStyle = awayColor;
    ctx.fillText("AWAY WINS ↓", ca.right - 10, ca.bottom - 14);

    // Final score
    ctx.fillStyle = t.ink;
    ctx.font = "bold 15px sans-serif";
    ctx.textAlign = "right";
    ctx.fillText("Final: Lakers 112 – Celtics 101", ca.right - 10, ca.top + 44);

    ctx.restore();
  },
};

const canvas = document.createElement("canvas");
document.getElementById("container").appendChild(canvas);

new Chart(canvas, {
  type: "line",
  data: {
    datasets: [
      {
        label: "Home Win Probability",
        data: points,
        borderColor: homeColor,
        borderWidth: 2.5,
        pointRadius: 0,
        fill: {
          target: { value: 50 },
          above: HOME_FILL,
          below: AWAY_FILL,
        },
        tension: 0.3,
      },
      {
        label: "_ref50",
        data: refLine,
        borderColor: t.inkSoft + "90",
        borderWidth: 1.5,
        borderDash: [8, 5],
        pointRadius: 0,
        fill: false,
      },
    ],
  },
  options: {
    responsive: true,
    maintainAspectRatio: false,
    animation: false,
    layout: { padding: { top: 30, right: 32, bottom: 20, left: 10 } },
    plugins: {
      title: {
        display: true,
        text: "line-win-probability · javascript · chartjs · anyplot.ai",
        color: t.ink,
        font: { size: 22, weight: "600" },
        padding: { bottom: 20 },
      },
      legend: {
        labels: {
          color: t.ink,
          font: { size: 14 },
          filter: item => !item.text.startsWith("_"),
        },
      },
    },
    scales: {
      x: {
        type: "linear",
        min: 0,
        max: 48,
        ticks: {
          color: t.inkSoft,
          font: { size: 13 },
          stepSize: 6,
          callback: v => `${v}'`,
        },
        grid: { color: t.grid },
        title: {
          display: true,
          text: "Game Time (minutes)",
          color: t.ink,
          font: { size: 15 },
        },
      },
      y: {
        min: 0,
        max: 100,
        ticks: {
          color: t.inkSoft,
          font: { size: 13 },
          stepSize: 25,
          callback: v => `${v}%`,
        },
        grid: { color: t.grid },
        title: {
          display: true,
          text: "Home Team Win Probability",
          color: t.ink,
          font: { size: 15 },
        },
      },
    },
  },
  plugins: [quarterPlugin],
});
Runnable source as JSON, for any HTTP client: https://api.anyplot.ai/specs/line-win-probability/chartjs/code. Any spec id and library id listed in llms-full.txt fit the same URL shape; every URL below is complete and callable.
{
  "spec_id": "line-win-probability",
  "language": "javascript",
  "library": "chartjs",
  "page": "https://anyplot.ai/line-win-probability/javascript/chartjs",
  "hub": "https://anyplot.ai/line-win-probability",
  "code_json": "https://api.anyplot.ai/specs/line-win-probability/chartjs/code",
  "spec_json": "https://api.anyplot.ai/specs/line-win-probability",
  "render_light_png": "https://storage.googleapis.com/anyplot-images/plots/line-win-probability/javascript/chartjs/plot-light.png",
  "render_dark_png": "https://storage.googleapis.com/anyplot-images/plots/line-win-probability/javascript/chartjs/plot-dark.png",
  "interactive_light_html": "https://storage.googleapis.com/anyplot-images/plots/line-win-probability/javascript/chartjs/plot-light.html",
  "interactive_dark_html": "https://storage.googleapis.com/anyplot-images/plots/line-win-probability/javascript/chartjs/plot-dark.html",
  "quality_score": 89.0,
  "license": "MIT",
  "guide": "https://anyplot.ai/llms.txt"
}
Part of Win Probability Chart on anyplot.ai.