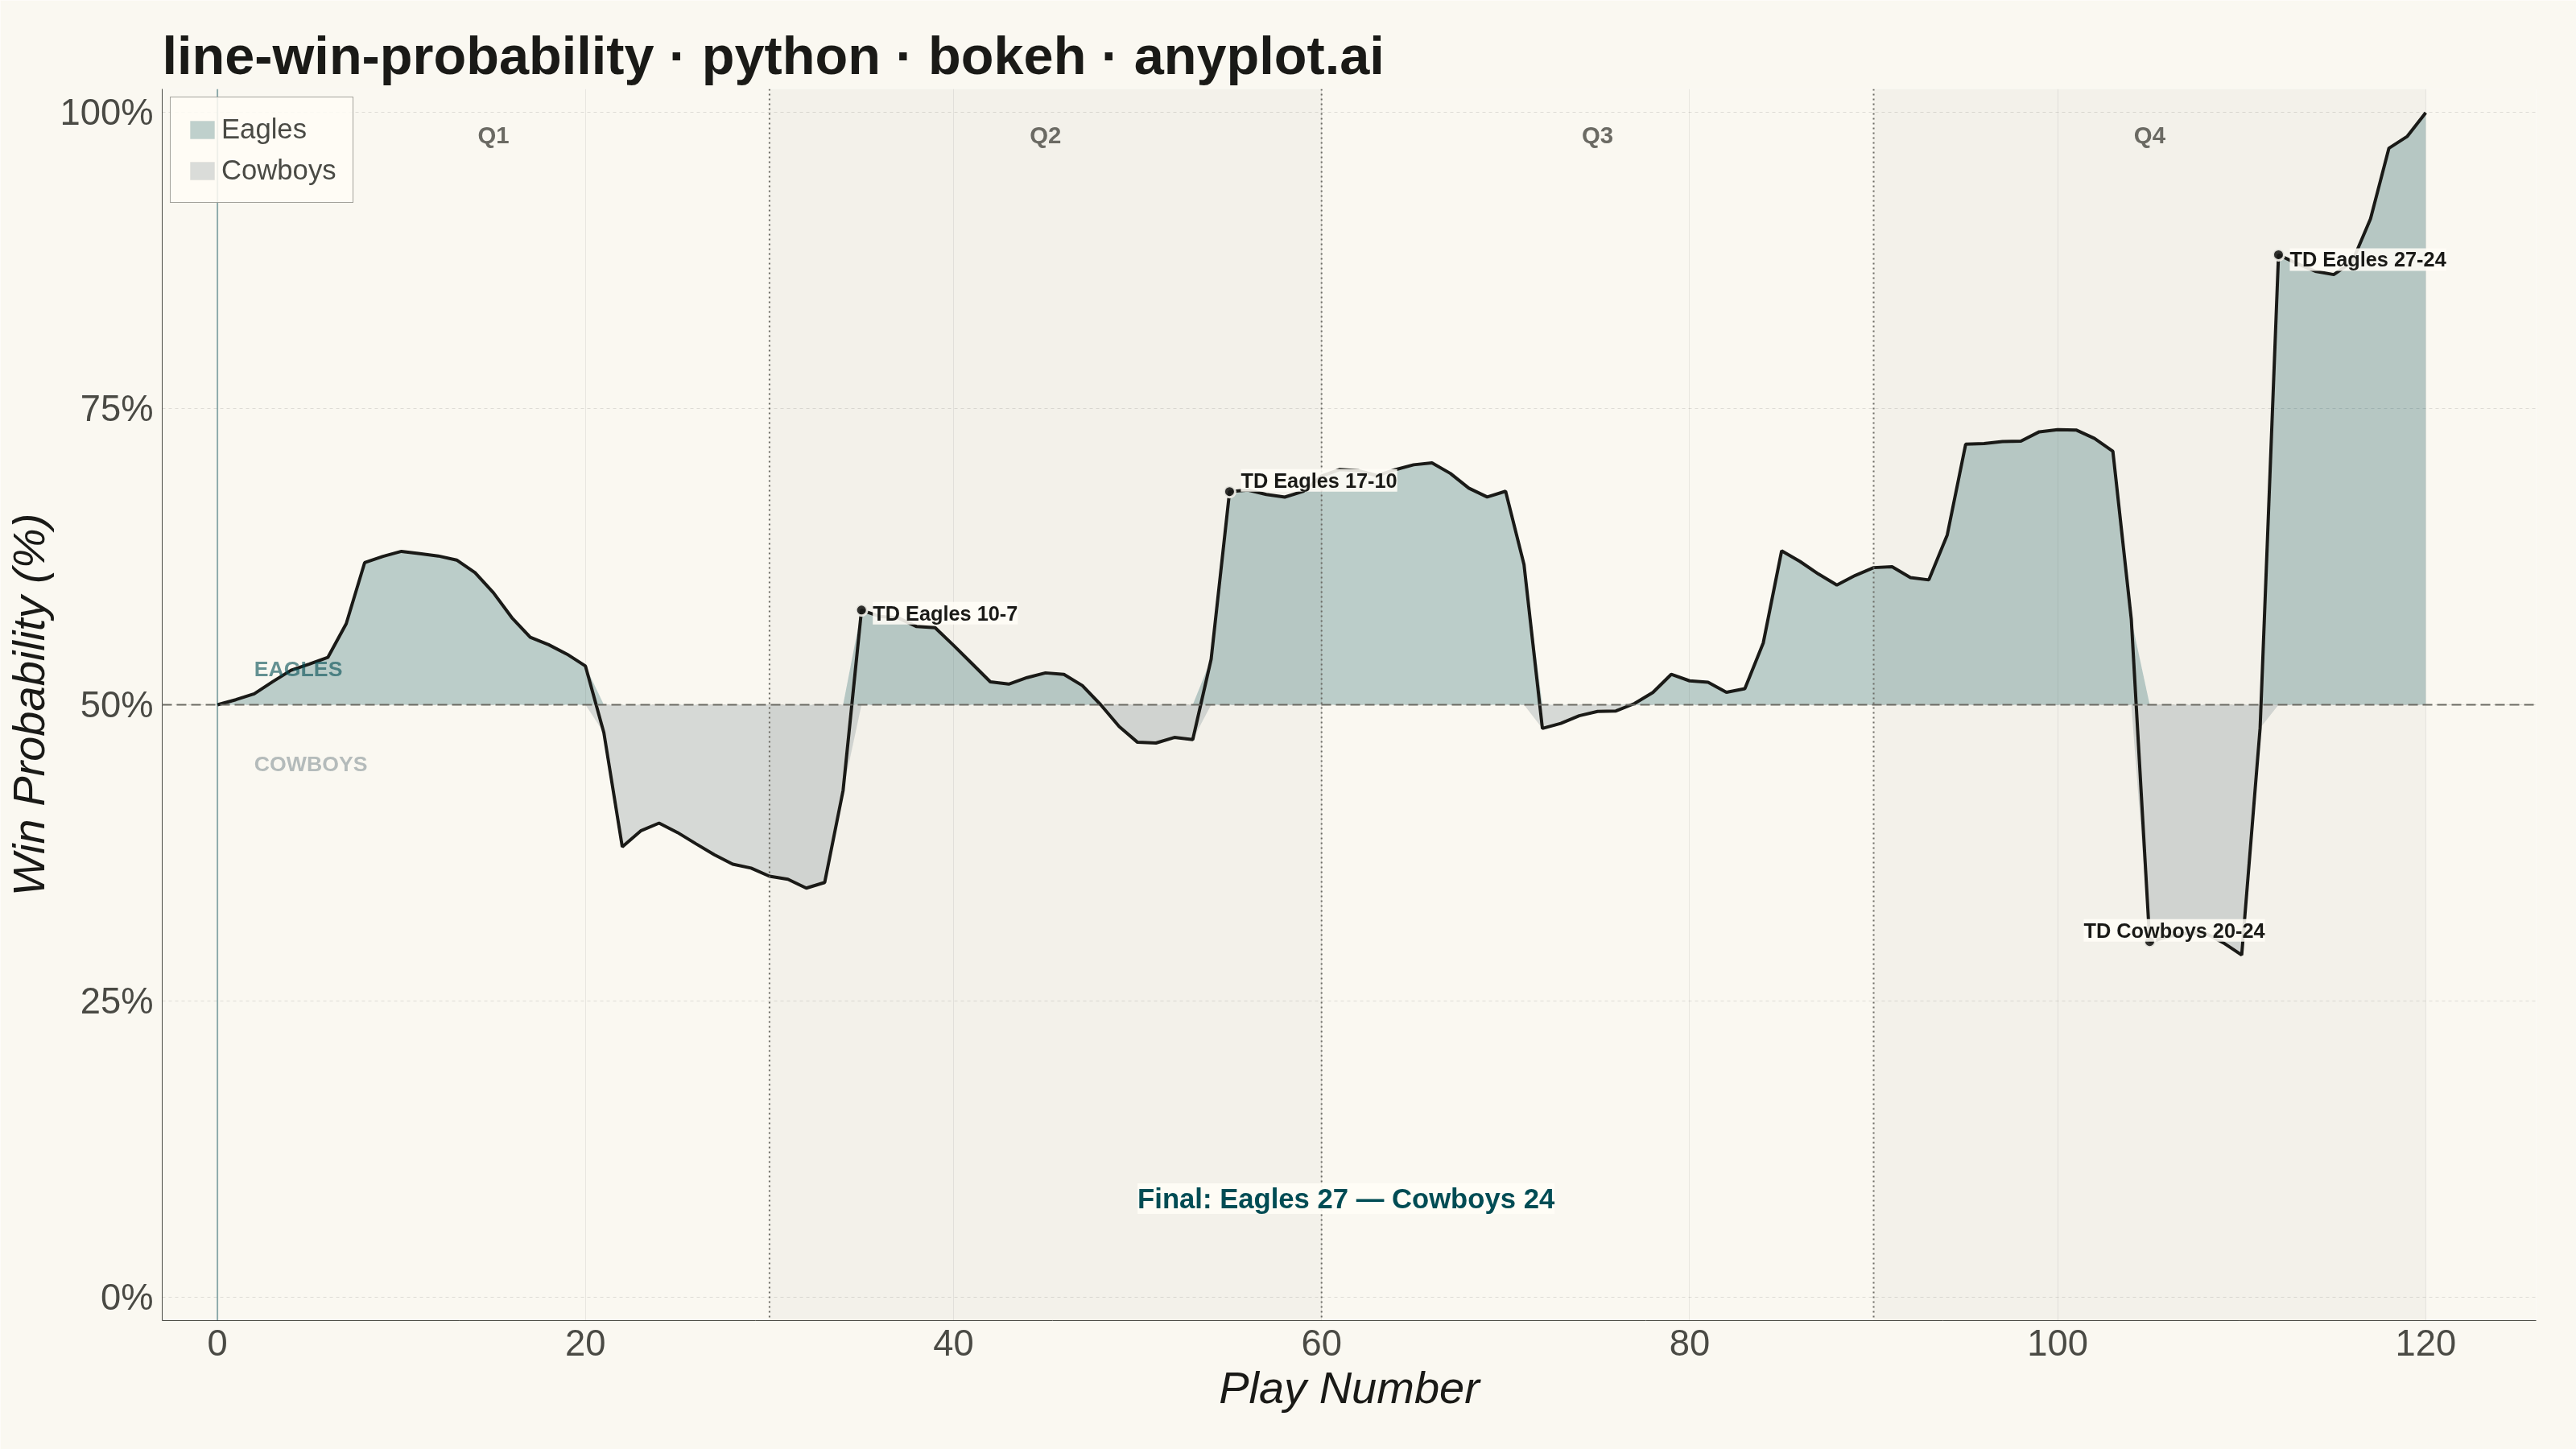
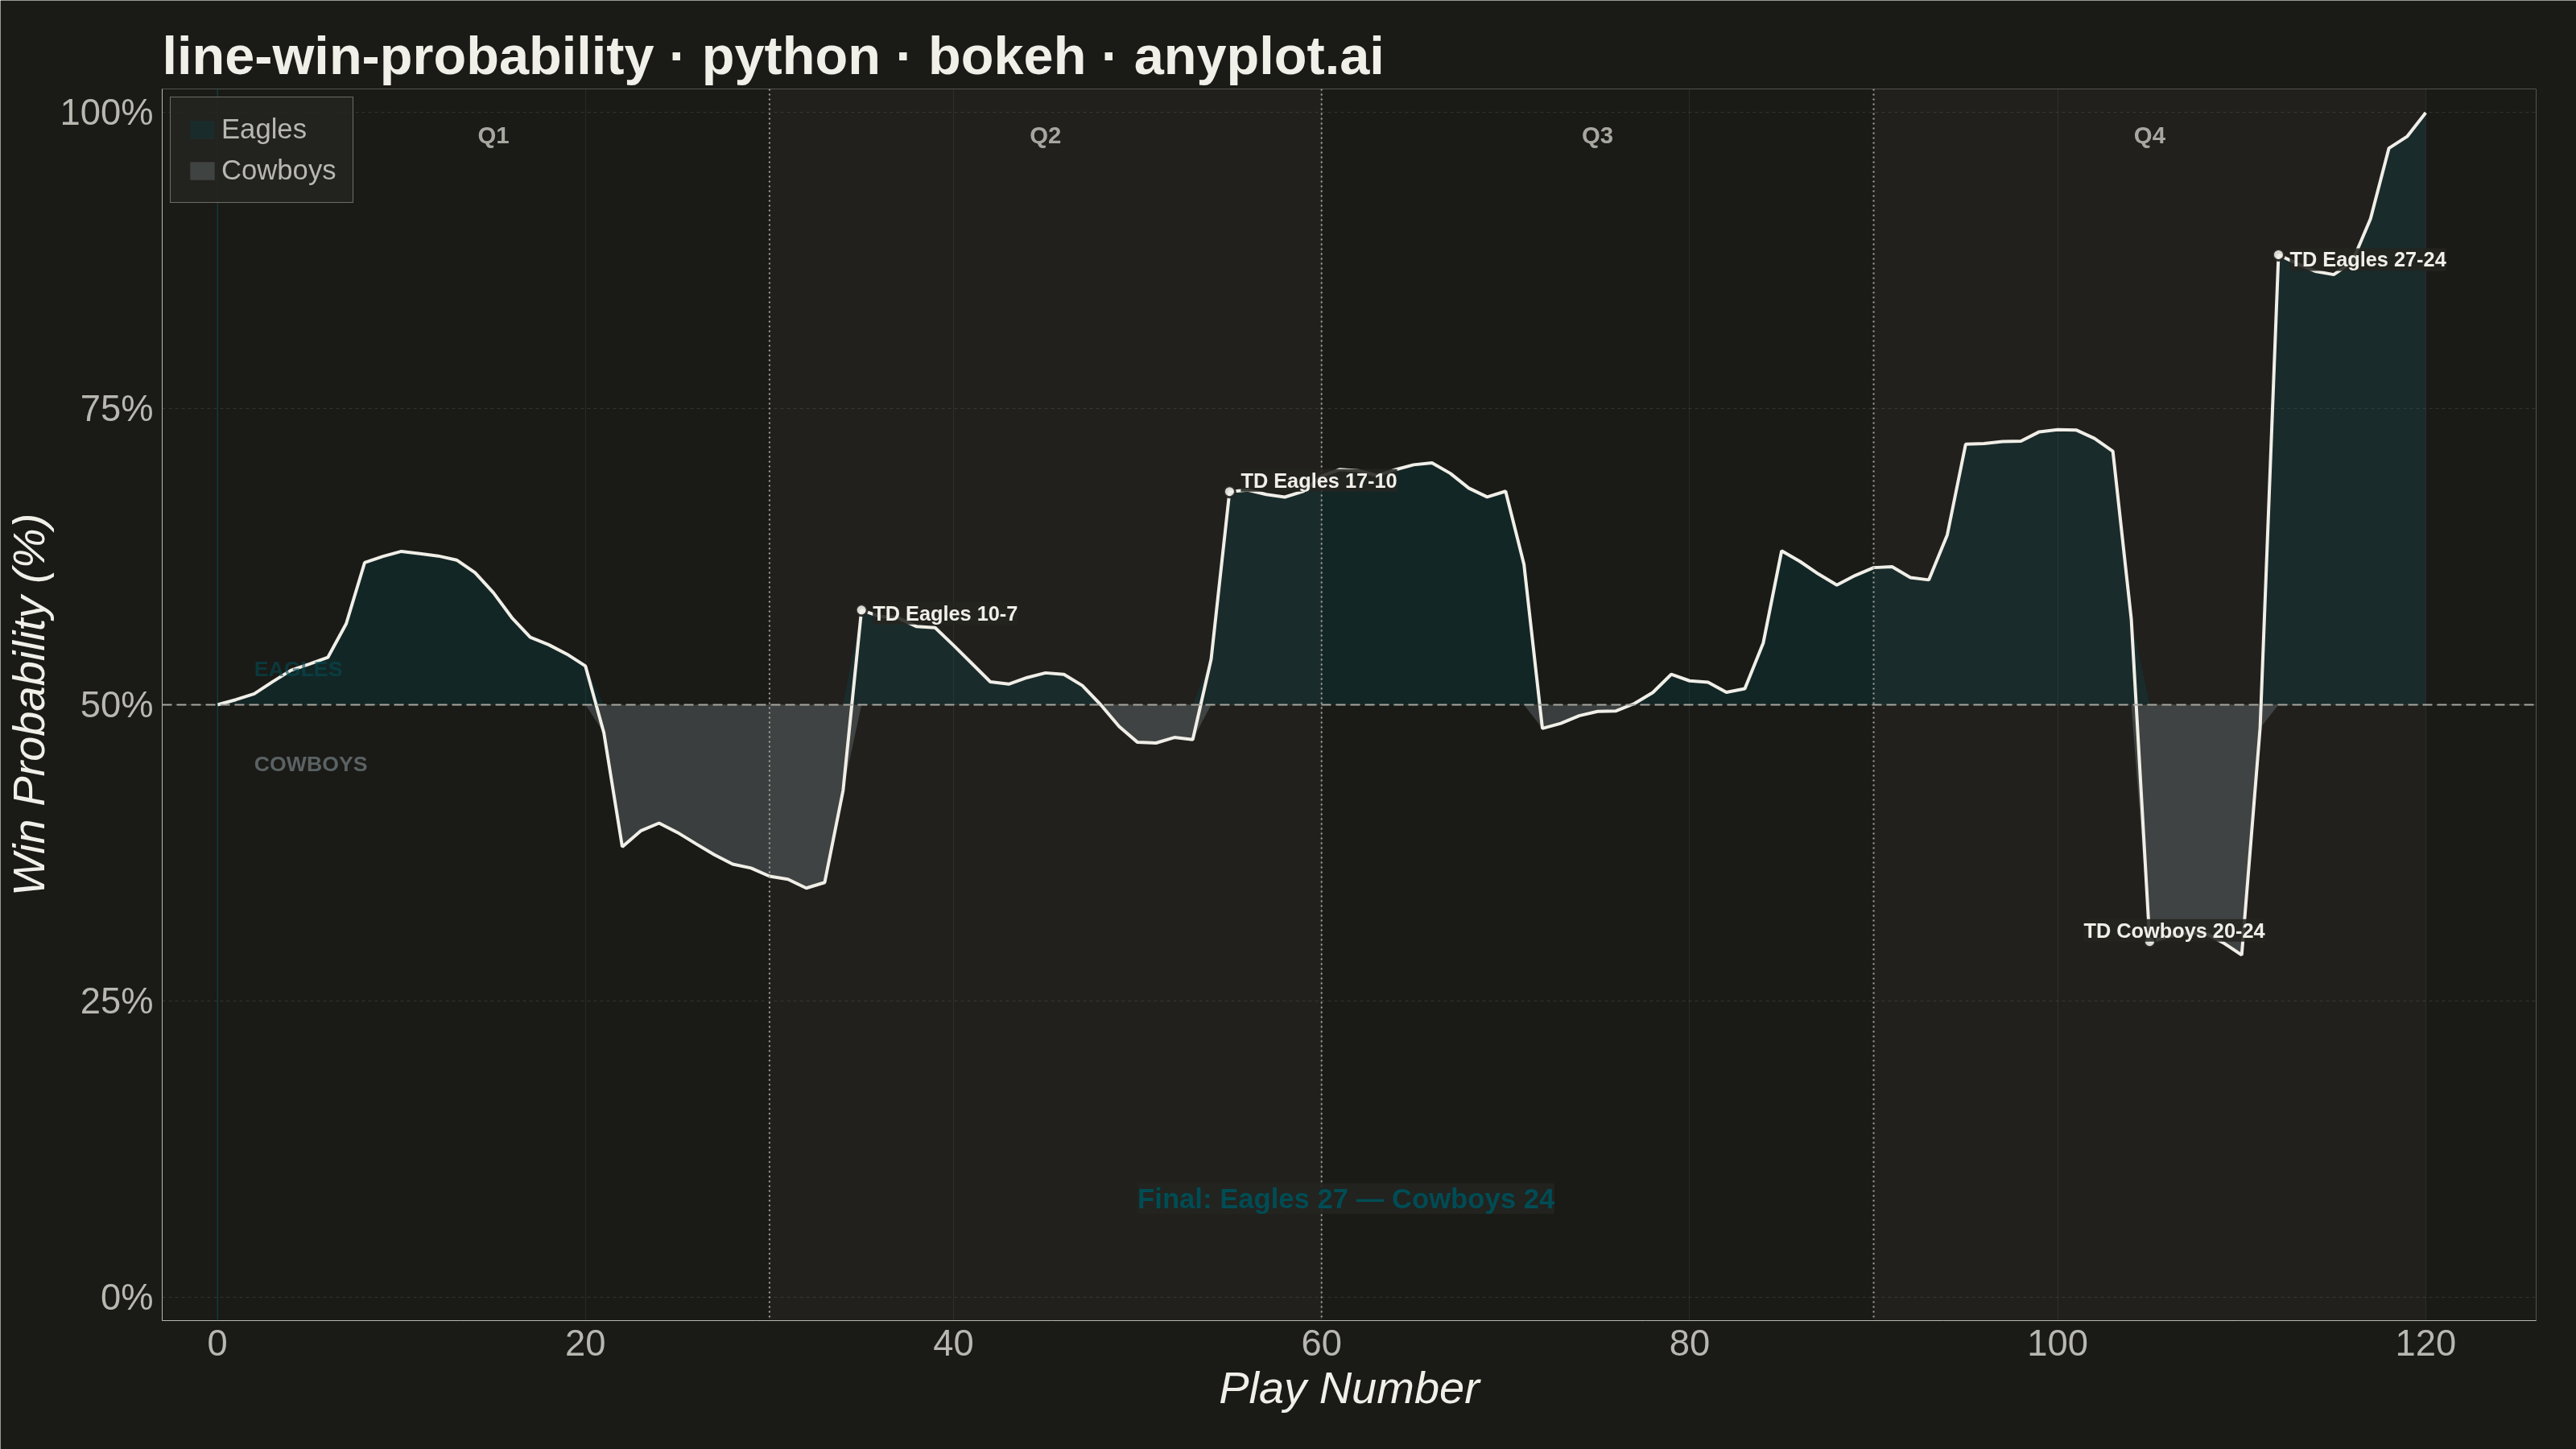
A win probability chart shows how each team's likelihood of winning evolves over the course of a game. The line starts near 50% and fluctuates based on scoring events, ultimately reaching 100% or 0% at game end. The area above and below the 50% baseline is filled with team colors to convey momentum at a glance. This visualization is widely used across major sports for post-game analysis and live broadcasting.
""" anyplot.ai
line-win-probability: Win Probability Chart
Library: bokeh 3.9.1 | Python 3.13.14
Quality: 90/100 | Updated: 2026-06-21
"""

import sys


# Running as `python bokeh.py` inserts the script directory into sys.path[0],
# shadowing the installed bokeh package. Remove it before any bokeh imports.
sys.path.pop(0)

import os
import time
from pathlib import Path

import numpy as np
from bokeh.io import output_file, save
from bokeh.models import (
    BoxAnnotation,
    ColumnDataSource,
    CustomJS,
    HoverTool,
    Label,
    Legend,
    LegendItem,
    NumeralTickFormatter,
    Span,
)
from bokeh.plotting import figure
from selenium import webdriver
from selenium.webdriver.chrome.options import Options


# Theme tokens (Imprint palette / theme-adaptive chrome)
THEME = os.getenv("ANYPLOT_THEME", "light")
PAGE_BG = "#FAF8F1" if THEME == "light" else "#1A1A17"
ELEVATED_BG = "#FFFDF6" if THEME == "light" else "#242420"
INK = "#1A1A17" if THEME == "light" else "#F0EFE8"
INK_SOFT = "#4A4A44" if THEME == "light" else "#B8B7B0"
INK_MUTED = "#6B6A63" if THEME == "light" else "#A8A79F"

# Team colors — semantic exception: real NFL team identity colors
EAGLES_COLOR = "#004C54"  # Eagles midnight green
COWBOYS_COLOR = "#869397"  # Cowboys silver

# Data — simulated NFL game: Eagles vs Cowboys
np.random.seed(42)

plays = np.arange(0, 121)
win_prob = np.full(121, 0.50)

events = {
    8: ("FG Eagles 3-0", 0.62),
    22: ("TD Cowboys 3-7", 0.38),
    35: ("TD Eagles 10-7", 0.58),
    48: ("FG Cowboys 10-10", 0.50),
    55: ("TD Eagles 17-10", 0.68),
    72: ("TD Cowboys 17-17", 0.48),
    85: ("FG Eagles 20-17", 0.63),
    95: ("INT Eagles", 0.72),
    105: ("TD Cowboys 20-24", 0.30),
    112: ("TD Eagles 27-24", 0.88),
    118: ("Turnover on downs", 0.97),
}

current_prob = 0.50
for i in range(1, 121):
    if i in events:
        current_prob = events[i][1]
    else:
        drift = np.random.normal(0, 0.015)
        current_prob = np.clip(current_prob + drift, 0.03, 0.97)
    win_prob[i] = current_prob

win_prob[120] = 1.0

win_prob_smooth = np.convolve(win_prob, np.ones(3) / 3, mode="same")
win_prob_smooth[0] = 0.50
win_prob_smooth[120] = 1.0
for play in events:
    win_prob_smooth[play] = win_prob[play]

upper = np.maximum(win_prob_smooth, 0.50)
lower = np.minimum(win_prob_smooth, 0.50)

source = ColumnDataSource(
    data={
        "play": plays,
        "win_prob": win_prob_smooth,
        "upper": upper,
        "lower": lower,
        "baseline": np.full(121, 0.50),
        "pct": win_prob_smooth * 100,
    }
)

# Title — 50 chars, well under 67 baseline, no scaling needed
title = "line-win-probability · python · bokeh · anyplot.ai"

# Plot — 3200×1800 landscape; toolbar_location=None keeps canvas at exact height
p = figure(
    width=3200,
    height=1800,
    title=title,
    x_axis_label="Play Number",
    y_axis_label="Win Probability (%)",
    y_range=(-0.02, 1.02),
    x_range=(-3, 126),
    toolbar_location=None,
    min_border_bottom=160,
    min_border_left=180,
    min_border_top=110,
    min_border_right=50,
)

# Quarter alternating bands — BoxAnnotation is idiomatic Bokeh
quarter_boundaries = [(0, 30), (30, 60), (60, 90), (90, 120)]
quarter_names = ["Q1", "Q2", "Q3", "Q4"]
for idx, (q_start, q_end) in enumerate(quarter_boundaries):
    if idx % 2 == 1:
        p.add_layout(BoxAnnotation(left=q_start, right=q_end, fill_color=INK, fill_alpha=0.03, line_color=None))

# Area fills — Eagles above 50%, Cowboys below 50%
eagles_fill = p.varea(x="play", y1="baseline", y2="upper", source=source, fill_color=EAGLES_COLOR, fill_alpha=0.25)
cowboys_fill = p.varea(x="play", y1="lower", y2="baseline", source=source, fill_color=COWBOYS_COLOR, fill_alpha=0.30)

# Main probability line
p.line(x="play", y="win_prob", source=source, line_color=INK, line_width=4)

# Invisible scatter layer for hover targeting
hover_scatter = p.scatter(x="play", y="win_prob", source=source, size=22, fill_alpha=0, line_alpha=0)

# Hover tool with styled HTML tooltip
hover = HoverTool(
    renderers=[hover_scatter],
    tooltips="""
    <div style="background:#2a2a2a; padding:12px 16px; border-radius:8px; color:white; font-size:16px; line-height:1.6;">
        <span style="font-weight:bold; font-size:18px;">Play @play</span><br>
        <span style="color:#66ccbb;">Win Prob: @pct{0.1}%</span>
    </div>
    """,
    mode="vline",
)
p.add_tools(hover)

# CustomJS crosshair on hover — distinctive Bokeh interactivity
crosshair_v = Span(location=0, dimension="height", line_color=EAGLES_COLOR, line_width=2, line_alpha=0.4)
p.add_layout(crosshair_v)
hover.callback = CustomJS(
    args={"span": crosshair_v}, code="const geometry = cb_data.geometry; span.location = geometry.x;"
)

# 50% reference line
p.add_layout(Span(location=0.5, dimension="width", line_color=INK_MUTED, line_width=2, line_dash=[12, 6]))

# Quarter boundary lines
for q_start, _ in quarter_boundaries[1:]:
    p.add_layout(Span(location=q_start, dimension="height", line_color=INK_MUTED, line_width=2, line_dash="dotted"))

# Quarter labels
for (q_start, q_end), q_name in zip(quarter_boundaries, quarter_names, strict=False):
    p.add_layout(
        Label(
            x=(q_start + q_end) / 2,
            y=0.97,
            text=q_name,
            text_font_size="22pt",
            text_color=INK_MUTED,
            text_align="center",
            text_font_style="bold",
        )
    )

# Team name labels near the 50% midline
p.add_layout(
    Label(
        x=2,
        y=0.52,
        text="EAGLES",
        text_font_size="20pt",
        text_color=EAGLES_COLOR,
        text_font_style="bold",
        text_alpha=0.6,
    )
)
p.add_layout(
    Label(
        x=2,
        y=0.44,
        text="COWBOYS",
        text_font_size="20pt",
        text_color=COWBOYS_COLOR,
        text_font_style="bold",
        text_alpha=0.6,
    )
)

# Key scoring event annotations — spaced to avoid Q4 crowding
# Format: (play_num, text, y_offset, x_offset)
annotations = [
    (35, "TD Eagles 10-7", -18, 14),
    (55, "TD Eagles 17-10", 0, 14),
    (105, "TD Cowboys 20-24", 0, -82),  # left side: Q4, lower probability
    (112, "TD Eagles 27-24", -20, 14),  # right side: Q4, high probability
]

event_x = [a[0] for a in annotations]
event_y = [win_prob_smooth[a[0]] for a in annotations]
p.scatter(x=event_x, y=event_y, size=14, fill_color=INK, line_color=PAGE_BG, line_width=3, alpha=0.9)
for play_num, text, y_off, x_off in annotations:
    p.add_layout(
        Label(
            x=play_num,
            y=win_prob_smooth[play_num],
            text=text,
            text_font_size="19pt",
            text_color=INK,
            text_font_style="bold",
            x_offset=x_off,
            y_offset=y_off,
            background_fill_color=ELEVATED_BG,
            background_fill_alpha=0.88,
        )
    )

# Final score annotation
p.add_layout(
    Label(
        x=50,
        y=0.07,
        text="Final: Eagles 27 — Cowboys 24",
        text_font_size="26pt",
        text_color=EAGLES_COLOR,
        text_font_style="bold",
        background_fill_color=ELEVATED_BG,
        background_fill_alpha=0.90,
    )
)

# Legend
legend = Legend(
    items=[LegendItem(label="Eagles", renderers=[eagles_fill]), LegendItem(label="Cowboys", renderers=[cowboys_fill])],
    location="top_left",
    label_text_font_size="26pt",
    label_text_color=INK_SOFT,
    glyph_height=28,
    glyph_width=38,
    spacing=12,
    border_line_color=INK_SOFT,
    background_fill_color=ELEVATED_BG,
    background_fill_alpha=0.85,
    padding=20,
)
p.add_layout(legend)

# Y-axis percentage formatter
p.yaxis.ticker = [0, 0.25, 0.50, 0.75, 1.0]
p.yaxis.formatter = NumeralTickFormatter(format="0%")

# Text sizing — canonical values for 3200×1800
p.title.text_font_size = "50pt"
p.title.text_color = INK
p.xaxis.axis_label_text_font_size = "42pt"
p.yaxis.axis_label_text_font_size = "42pt"
p.xaxis.major_label_text_font_size = "34pt"
p.yaxis.major_label_text_font_size = "34pt"
p.xaxis.axis_label_text_color = INK
p.yaxis.axis_label_text_color = INK
p.xaxis.major_label_text_color = INK_SOFT
p.yaxis.major_label_text_color = INK_SOFT

# Grid — subtle horizontal emphasis
p.xgrid.grid_line_color = INK
p.xgrid.grid_line_alpha = 0.08
p.ygrid.grid_line_color = INK
p.ygrid.grid_line_alpha = 0.12
p.ygrid.grid_line_dash = [4, 4]

# Chrome — theme-adaptive
p.background_fill_color = PAGE_BG
p.border_fill_color = PAGE_BG
p.outline_line_color = None
p.xaxis.axis_line_color = INK_SOFT
p.yaxis.axis_line_color = INK_SOFT
p.xaxis.major_tick_line_color = None
p.yaxis.major_tick_line_color = None
p.xaxis.minor_tick_line_color = None
p.yaxis.minor_tick_line_color = None

# Save — HTML (interactive) + PNG via headless Chrome (Selenium Manager auto-resolves driver)
output_file(f"plot-{THEME}.html")
save(p)

import base64


W, H = 3200, 1800
# Set the window larger than the figure so the full chart fits in the viewport;
# CDP clip captures exactly WxH regardless of browser chrome overhead.
opts = Options()
for arg in (
    "--headless=new",
    "--no-sandbox",
    "--disable-dev-shm-usage",
    "--disable-gpu",
    f"--window-size={W},{H + 200}",
    "--hide-scrollbars",
    "--force-device-scale-factor=1",
):
    opts.add_argument(arg)
driver = webdriver.Chrome(options=opts)
driver.set_window_size(W, H + 200)
driver.get(f"file://{Path(f'plot-{THEME}.html').resolve()}")
time.sleep(3)
# Capture exactly WxH from the page origin via Chrome DevTools Protocol
result = driver.execute_cdp_cmd(
    "Page.captureScreenshot", {"format": "png", "clip": {"x": 0, "y": 0, "width": W, "height": H, "scale": 1}}
)
with open(f"plot-{THEME}.png", "wb") as fout:
    fout.write(base64.b64decode(result["data"]))
driver.quit()
Runnable source as JSON, for any HTTP client: https://api.anyplot.ai/specs/line-win-probability/bokeh/code. Any spec id and library id listed in llms-full.txt fit the same URL shape; every URL below is complete and callable.
{
  "spec_id": "line-win-probability",
  "language": "python",
  "library": "bokeh",
  "page": "https://anyplot.ai/line-win-probability/python/bokeh",
  "hub": "https://anyplot.ai/line-win-probability",
  "code_json": "https://api.anyplot.ai/specs/line-win-probability/bokeh/code",
  "spec_json": "https://api.anyplot.ai/specs/line-win-probability",
  "render_light_png": "https://storage.googleapis.com/anyplot-images/plots/line-win-probability/python/bokeh/plot-light.png",
  "render_dark_png": "https://storage.googleapis.com/anyplot-images/plots/line-win-probability/python/bokeh/plot-dark.png",
  "interactive_light_html": "https://storage.googleapis.com/anyplot-images/plots/line-win-probability/python/bokeh/plot-light.html",
  "interactive_dark_html": "https://storage.googleapis.com/anyplot-images/plots/line-win-probability/python/bokeh/plot-dark.html",
  "quality_score": 90.0,
  "license": "MIT",
  "guide": "https://anyplot.ai/llms.txt"
}
Part of Win Probability Chart on anyplot.ai.