The same plot in 14 other libraries — JavaScript: Chart.js, Apache ECharts, Highcharts, MUI X Charts; Python: Altair, Bokeh, lets-plot, Matplotlib, Plotly, plotnine, Pygal, Seaborn; R: ggplot2; Julia: Makie.jl. Compare all 15 side by side: Win Probability Chart in Python, R, Julia and JavaScript.
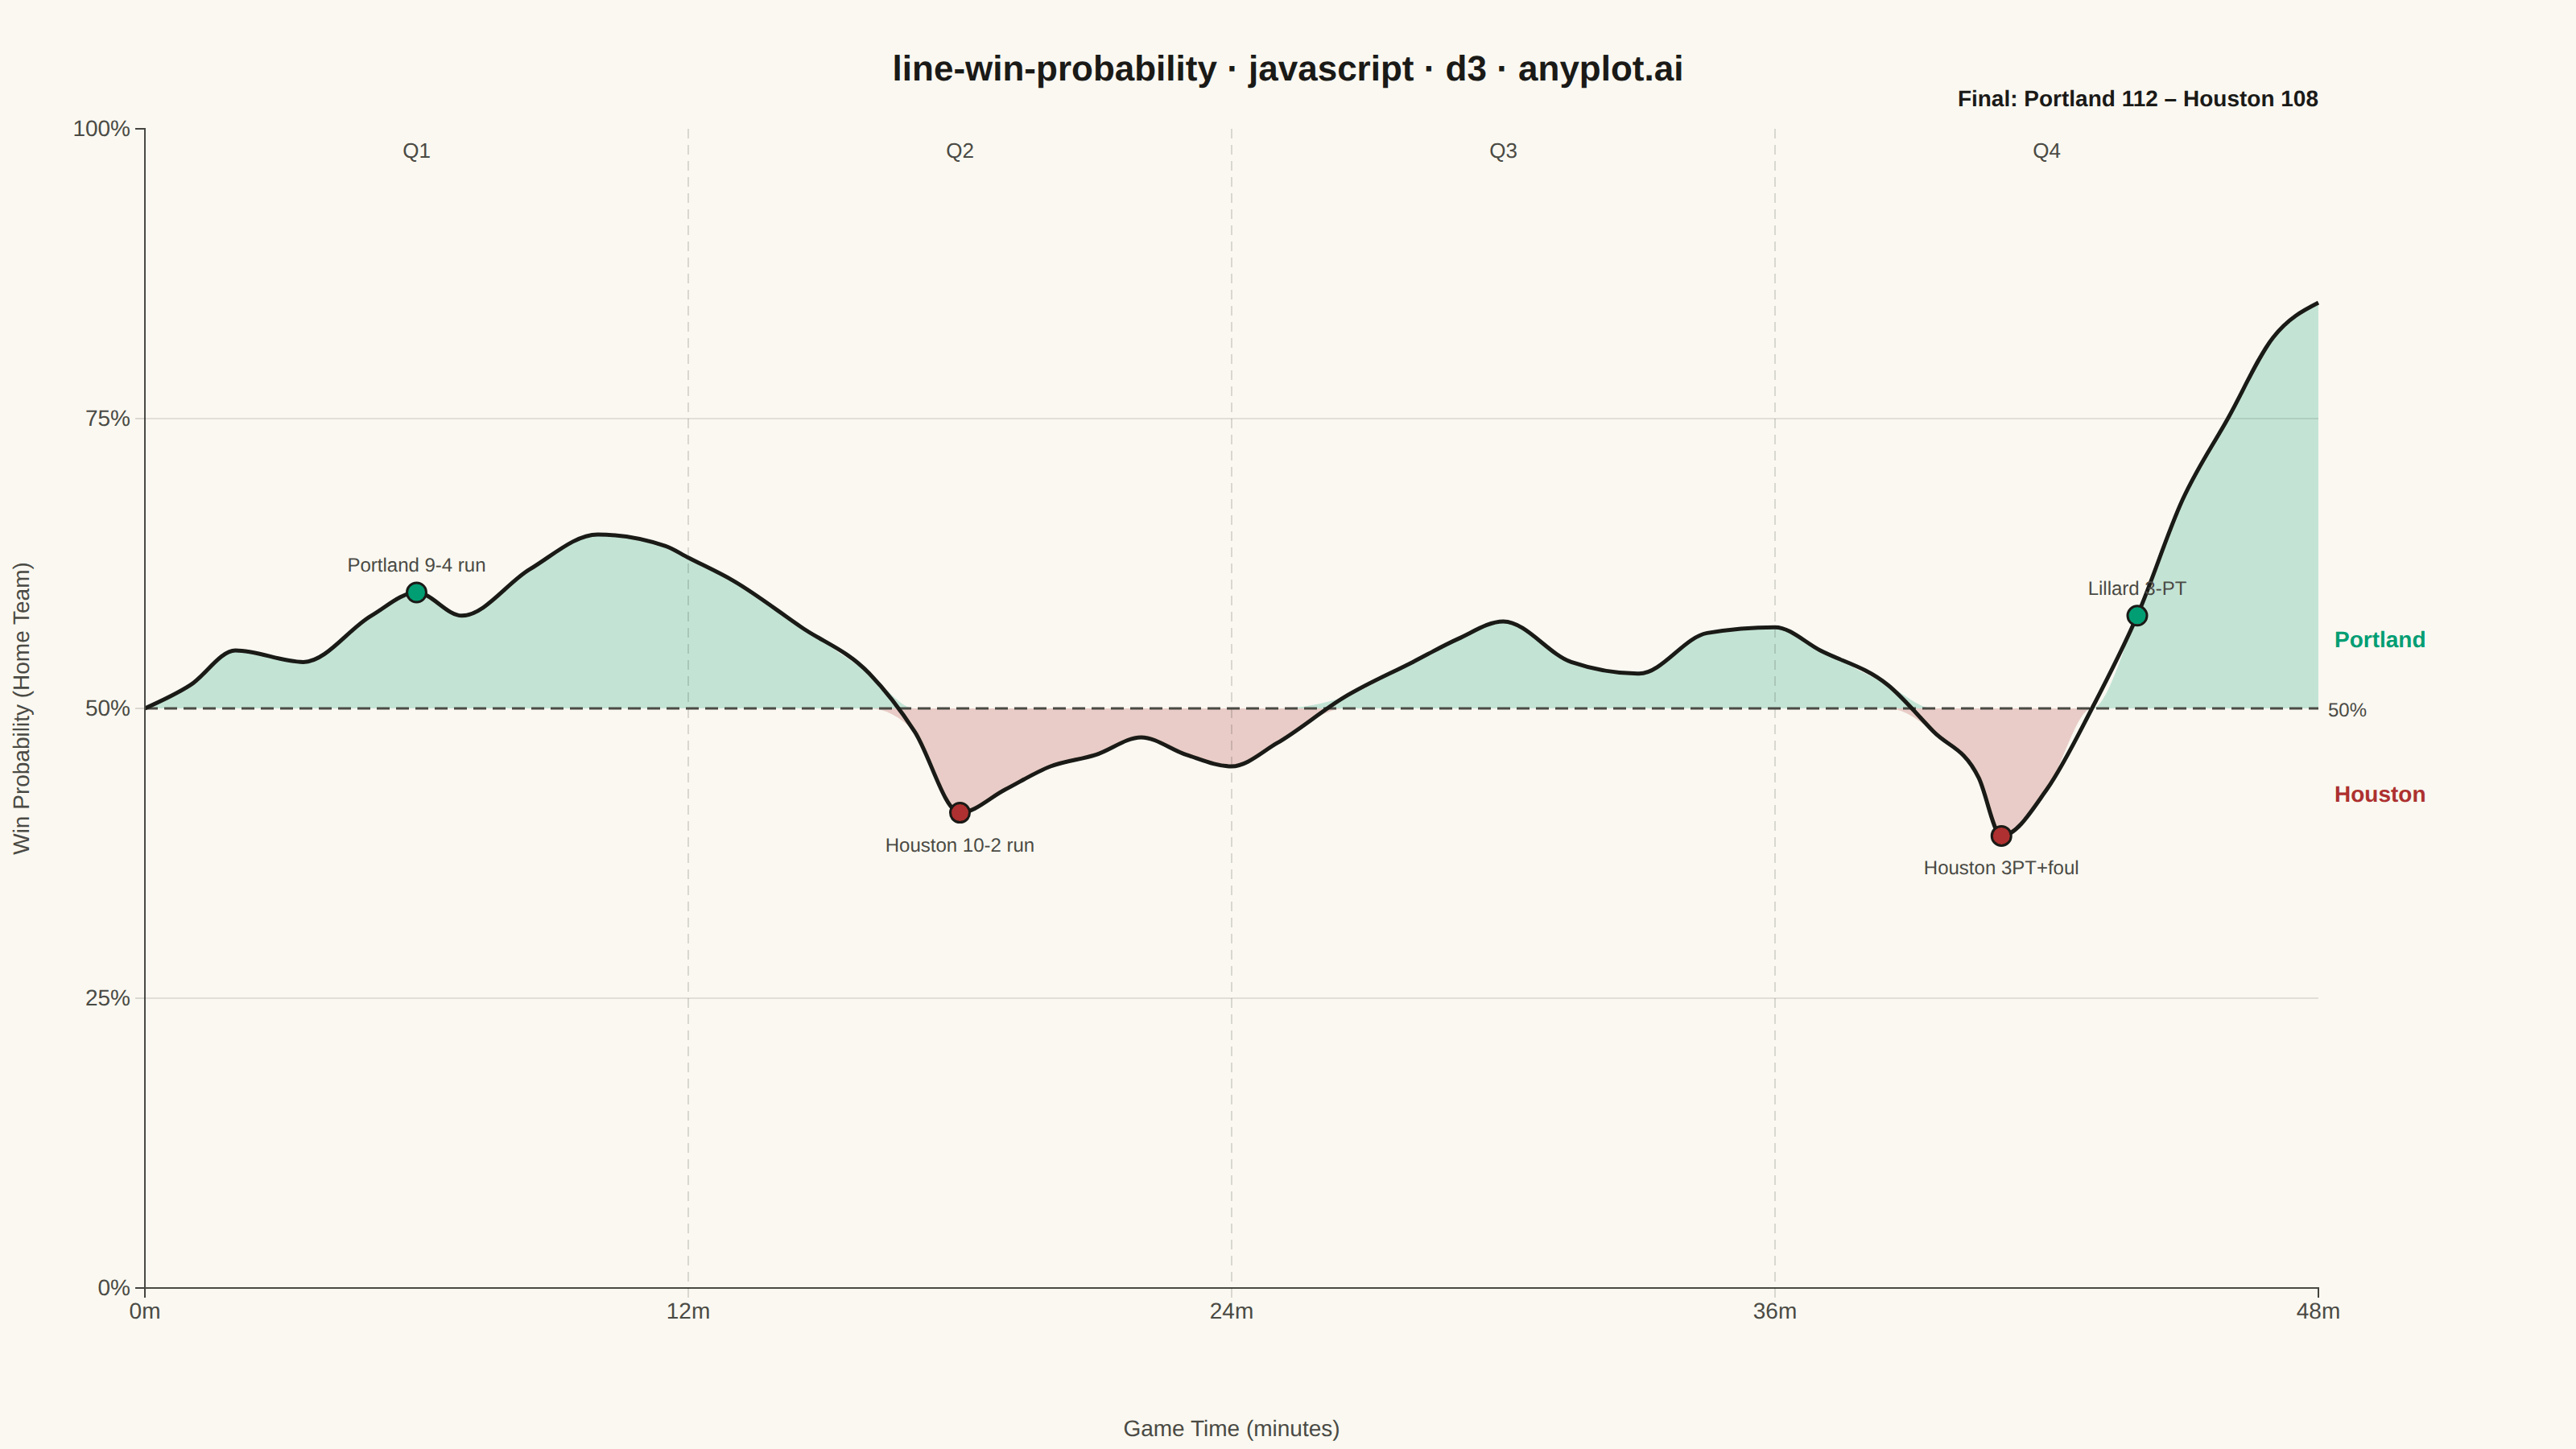
A win probability chart shows how each team's likelihood of winning evolves over the course of a game. The line starts near 50% and fluctuates based on scoring events, ultimately reaching 100% or 0% at game end. The area above and below the 50% baseline is filled with team colors to convey momentum at a glance. This visualization is widely used across major sports for post-game analysis and live broadcasting.
// anyplot.ai
// line-win-probability: Win Probability Chart
// Library: d3 7.9.0 | JavaScript 22.22.3
// Quality: 94/100 | Created: 2026-06-21

const t = window.ANYPLOT_TOKENS;
const { width, height } = window.ANYPLOT_SIZE;

const margin = { top: 80, right: 160, bottom: 100, left: 90 };
const iw = width - margin.left - margin.right;
const ih = height - margin.top - margin.bottom;

// Portland Trail Blazers (home) vs Houston Rockets — synthetic NBA play-by-play
// win probability over 48 minutes; each row is a significant game event
const gameData = [
  { t: 0.0, p: 0.500 },
  { t: 1.0, p: 0.520 },
  { t: 2.0, p: 0.550 },
  { t: 3.5, p: 0.540 },
  { t: 5.0, p: 0.580 },
  { t: 6.0, p: 0.600 },  // Portland opens up a 9-4 run
  { t: 7.0, p: 0.580 },
  { t: 8.5, p: 0.620 },
  { t: 10.0, p: 0.650 },
  { t: 11.5, p: 0.640 },
  { t: 12.0, p: 0.630 },  // End Q1: Portland 28-22
  { t: 13.0, p: 0.610 },
  { t: 14.5, p: 0.570 },
  { t: 16.0, p: 0.530 },
  { t: 17.0, p: 0.480 },
  { t: 18.0, p: 0.410 },  // Houston 10-2 run, takes lead
  { t: 19.0, p: 0.430 },
  { t: 20.0, p: 0.450 },
  { t: 21.0, p: 0.460 },
  { t: 22.0, p: 0.475 },
  { t: 23.0, p: 0.460 },
  { t: 24.0, p: 0.450 },  // Halftime: Portland 47-48
  { t: 25.0, p: 0.470 },
  { t: 26.5, p: 0.510 },
  { t: 28.0, p: 0.540 },
  { t: 29.0, p: 0.560 },
  { t: 30.0, p: 0.575 },
  { t: 31.5, p: 0.540 },
  { t: 33.0, p: 0.530 },
  { t: 34.5, p: 0.565 },
  { t: 36.0, p: 0.570 },  // End Q3: Portland 83-78
  { t: 37.0, p: 0.550 },
  { t: 38.5, p: 0.520 },
  { t: 39.5, p: 0.480 },
  { t: 40.5, p: 0.440 },
  { t: 41.0, p: 0.390 },  // Houston 3PT + foul, 4-point lead
  { t: 42.0, p: 0.430 },
  { t: 43.0, p: 0.500 },
  { t: 44.0, p: 0.580 },  // Lillard 3-pointer with 4 min left
  { t: 45.0, p: 0.680 },  // Houston star fouls out
  { t: 46.0, p: 0.750 },
  { t: 47.0, p: 0.820 },
  { t: 48.0, p: 0.850 },  // Final: Portland 112 - Houston 108
];

// Key events to annotate (significant probability swings)
const keyEvents = [
  { t: 6.0,  p: 0.600, label: "Portland 9-4 run", above: true  },
  { t: 18.0, p: 0.410, label: "Houston 10-2 run",  above: false },
  { t: 41.0, p: 0.390, label: "Houston 3PT+foul",  above: false },
  { t: 44.0, p: 0.580, label: "Lillard 3-PT",       above: true  },
];

const HOME_COLOR = t.palette[0];  // #009E73 — Portland home team (Imprint position 1)
const AWAY_COLOR = t.palette[4];  // #AE3030 — Houston away team (semantic loss anchor)

// SVG
const svg = d3.select("#container")
  .append("svg")
  .attr("width", width)
  .attr("height", height);

const g = svg.append("g")
  .attr("transform", `translate(${margin.left},${margin.top})`);

// Scales
const x = d3.scaleLinear().domain([0, 48]).range([0, iw]);
const y = d3.scaleLinear().domain([0, 1]).range([ih, 0]);
const midY = y(0.5);

// Area fills (Math.min/max trick splits fill at the 50% baseline)
const homeArea = d3.area()
  .x(d => x(d.t))
  .y0(midY)
  .y1(d => Math.min(y(d.p), midY))  // fills above 50% only
  .curve(d3.curveMonotoneX);

const awayArea = d3.area()
  .x(d => x(d.t))
  .y0(midY)
  .y1(d => Math.max(y(d.p), midY))  // fills below 50% only
  .curve(d3.curveMonotoneX);

// Win probability line
const lineGen = d3.line()
  .x(d => x(d.t))
  .y(d => y(d.p))
  .curve(d3.curveMonotoneX);

// Draw areas first (behind line)
g.append("path").datum(gameData)
  .attr("fill", HOME_COLOR).attr("fill-opacity", 0.22)
  .attr("d", homeArea);

g.append("path").datum(gameData)
  .attr("fill", AWAY_COLOR).attr("fill-opacity", 0.22)
  .attr("d", awayArea);

// Subtle horizontal grid lines at 25% and 75%
[0.25, 0.75].forEach(pct => {
  g.append("line")
    .attr("x1", 0).attr("x2", iw)
    .attr("y1", y(pct)).attr("y2", y(pct))
    .attr("stroke", t.grid).attr("stroke-width", 0.8);
});

// Quarter boundary vertical lines (dashed)
[12, 24, 36].forEach(qt => {
  g.append("line")
    .attr("x1", x(qt)).attr("x2", x(qt))
    .attr("y1", 0).attr("y2", ih)
    .attr("stroke", t.grid)
    .attr("stroke-width", 1)
    .attr("stroke-dasharray", "6,4");
});

// 50% reference line (prominent dashed)
g.append("line")
  .attr("x1", 0).attr("x2", iw)
  .attr("y1", midY).attr("y2", midY)
  .attr("stroke", t.inkSoft)
  .attr("stroke-width", 1.5)
  .attr("stroke-dasharray", "8,4");

// Quarter period labels near top of chart area
const quarterCenters = [6, 18, 30, 42];
const quarterNames   = ["Q1", "Q2", "Q3", "Q4"];
quarterCenters.forEach((mid, i) => {
  g.append("text")
    .attr("x", x(mid)).attr("y", 18)
    .attr("text-anchor", "middle")
    .attr("fill", t.inkSoft)
    .style("font-size", "13px")
    .style("font-weight", "500")
    .text(quarterNames[i]);
});

// Win probability line (drawn on top of area fills)
g.append("path").datum(gameData)
  .attr("fill", "none")
  .attr("stroke", t.ink)
  .attr("stroke-width", 2.5)
  .attr("d", lineGen);

// X-axis
const xAxis = g.append("g")
  .attr("transform", `translate(0,${ih})`)
  .call(d3.axisBottom(x)
    .tickValues([0, 12, 24, 36, 48])
    .tickFormat(d => `${d}m`));

// Y-axis
const yAxis = g.append("g")
  .call(d3.axisLeft(y)
    .tickValues([0, 0.25, 0.5, 0.75, 1.0])
    .tickFormat(d => `${Math.round(d * 100)}%`));

// Style both axes
for (const ax of [xAxis, yAxis]) {
  ax.selectAll("text").attr("fill", t.inkSoft).style("font-size", "14px");
  ax.selectAll(".tick line").attr("stroke", t.grid);
  ax.select(".domain").attr("stroke", t.inkSoft);
}

// "50%" label beside the reference line (right edge of chart area)
g.append("text")
  .attr("x", iw + 6).attr("y", midY + 5)
  .attr("fill", t.inkSoft)
  .style("font-size", "12px")
  .text("50%");

// Team name labels in the right margin
svg.append("text")
  .attr("x", margin.left + iw + 10)
  .attr("y", margin.top + midY - 38)
  .attr("fill", HOME_COLOR)
  .style("font-size", "14px")
  .style("font-weight", "600")
  .text("Portland");

svg.append("text")
  .attr("x", margin.left + iw + 10)
  .attr("y", margin.top + midY + 58)
  .attr("fill", AWAY_COLOR)
  .style("font-size", "14px")
  .style("font-weight", "600")
  .text("Houston");

// Key event annotation markers and labels
keyEvents.forEach(ev => {
  const cx = x(ev.t);
  const cy = y(ev.p);
  const color = ev.above ? HOME_COLOR : AWAY_COLOR;

  g.append("circle")
    .attr("cx", cx).attr("cy", cy).attr("r", 6)
    .attr("fill", color)
    .attr("stroke", t.ink)
    .attr("stroke-width", 1.5);

  g.append("text")
    .attr("x", cx)
    .attr("y", ev.above ? cy - 13 : cy + 24)
    .attr("text-anchor", "middle")
    .attr("fill", t.inkSoft)
    .style("font-size", "12px")
    .text(ev.label);
});

// Final score annotation (upper-right corner)
svg.append("text")
  .attr("x", margin.left + iw)
  .attr("y", margin.top - 14)
  .attr("text-anchor", "end")
  .attr("fill", t.ink)
  .style("font-size", "14px")
  .style("font-weight", "600")
  .text("Final: Portland 112 – Houston 108");

// Axis labels
svg.append("text")
  .attr("x", margin.left + iw / 2)
  .attr("y", height - 8)
  .attr("text-anchor", "middle")
  .attr("fill", t.inkSoft)
  .style("font-size", "14px")
  .text("Game Time (minutes)");

svg.append("text")
  .attr("transform", "rotate(-90)")
  .attr("x", -(margin.top + ih / 2))
  .attr("y", 18)
  .attr("text-anchor", "middle")
  .attr("fill", t.inkSoft)
  .style("font-size", "14px")
  .text("Win Probability (Home Team)");

// Title
const title = "line-win-probability · javascript · d3 · anyplot.ai";
const titleFontSize = title.length > 67 ? Math.round(22 * 67 / title.length) : 22;

svg.append("text")
  .attr("x", width / 2)
  .attr("y", 50)
  .attr("text-anchor", "middle")
  .attr("fill", t.ink)
  .style("font-size", `${titleFontSize}px`)
  .style("font-weight", "600")
  .text(title);
Runnable source as JSON, for any HTTP client: https://api.anyplot.ai/specs/line-win-probability/d3/code. Any spec id and library id listed in llms-full.txt fit the same URL shape; every URL below is complete and callable.
{
  "spec_id": "line-win-probability",
  "language": "javascript",
  "library": "d3",
  "page": "https://anyplot.ai/line-win-probability/javascript/d3",
  "hub": "https://anyplot.ai/line-win-probability",
  "code_json": "https://api.anyplot.ai/specs/line-win-probability/d3/code",
  "spec_json": "https://api.anyplot.ai/specs/line-win-probability",
  "render_light_png": "https://storage.googleapis.com/anyplot-images/plots/line-win-probability/javascript/d3/plot-light.png",
  "render_dark_png": "https://storage.googleapis.com/anyplot-images/plots/line-win-probability/javascript/d3/plot-dark.png",
  "interactive_light_html": "https://storage.googleapis.com/anyplot-images/plots/line-win-probability/javascript/d3/plot-light.html",
  "interactive_dark_html": "https://storage.googleapis.com/anyplot-images/plots/line-win-probability/javascript/d3/plot-dark.html",
  "quality_score": 94.0,
  "license": "MIT",
  "guide": "https://anyplot.ai/llms.txt"
}
Part of Win Probability Chart on anyplot.ai.