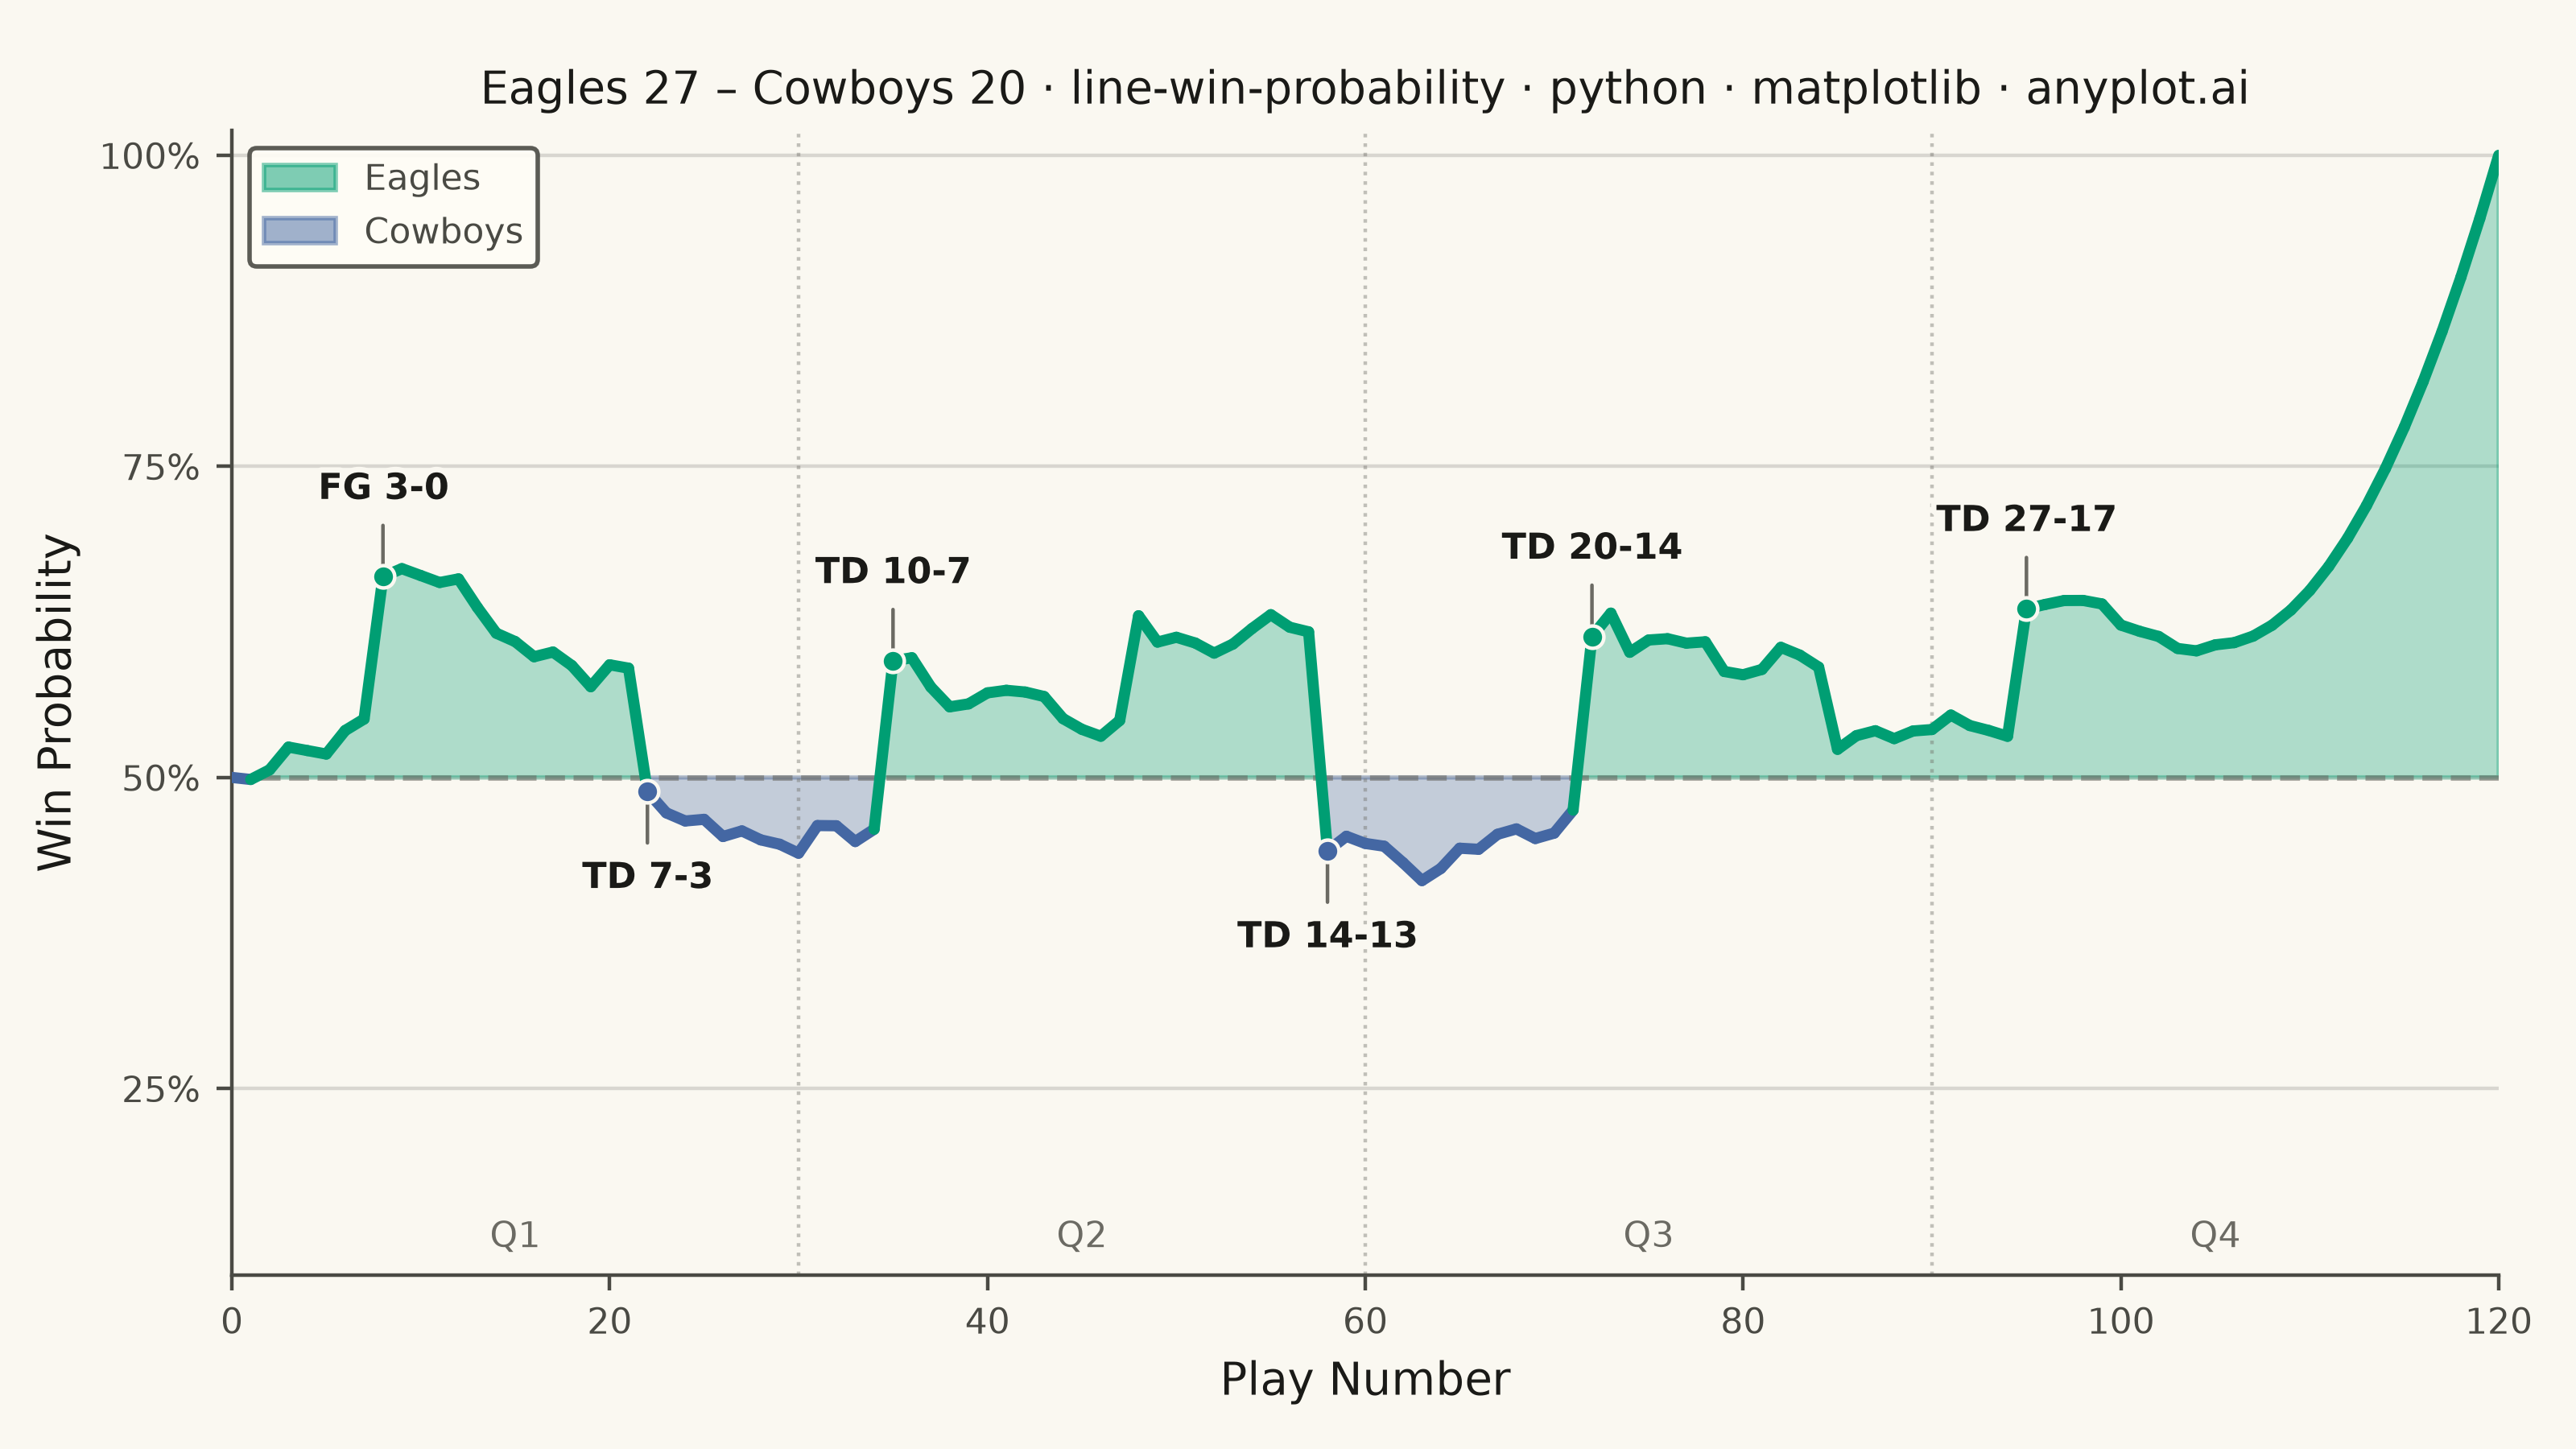
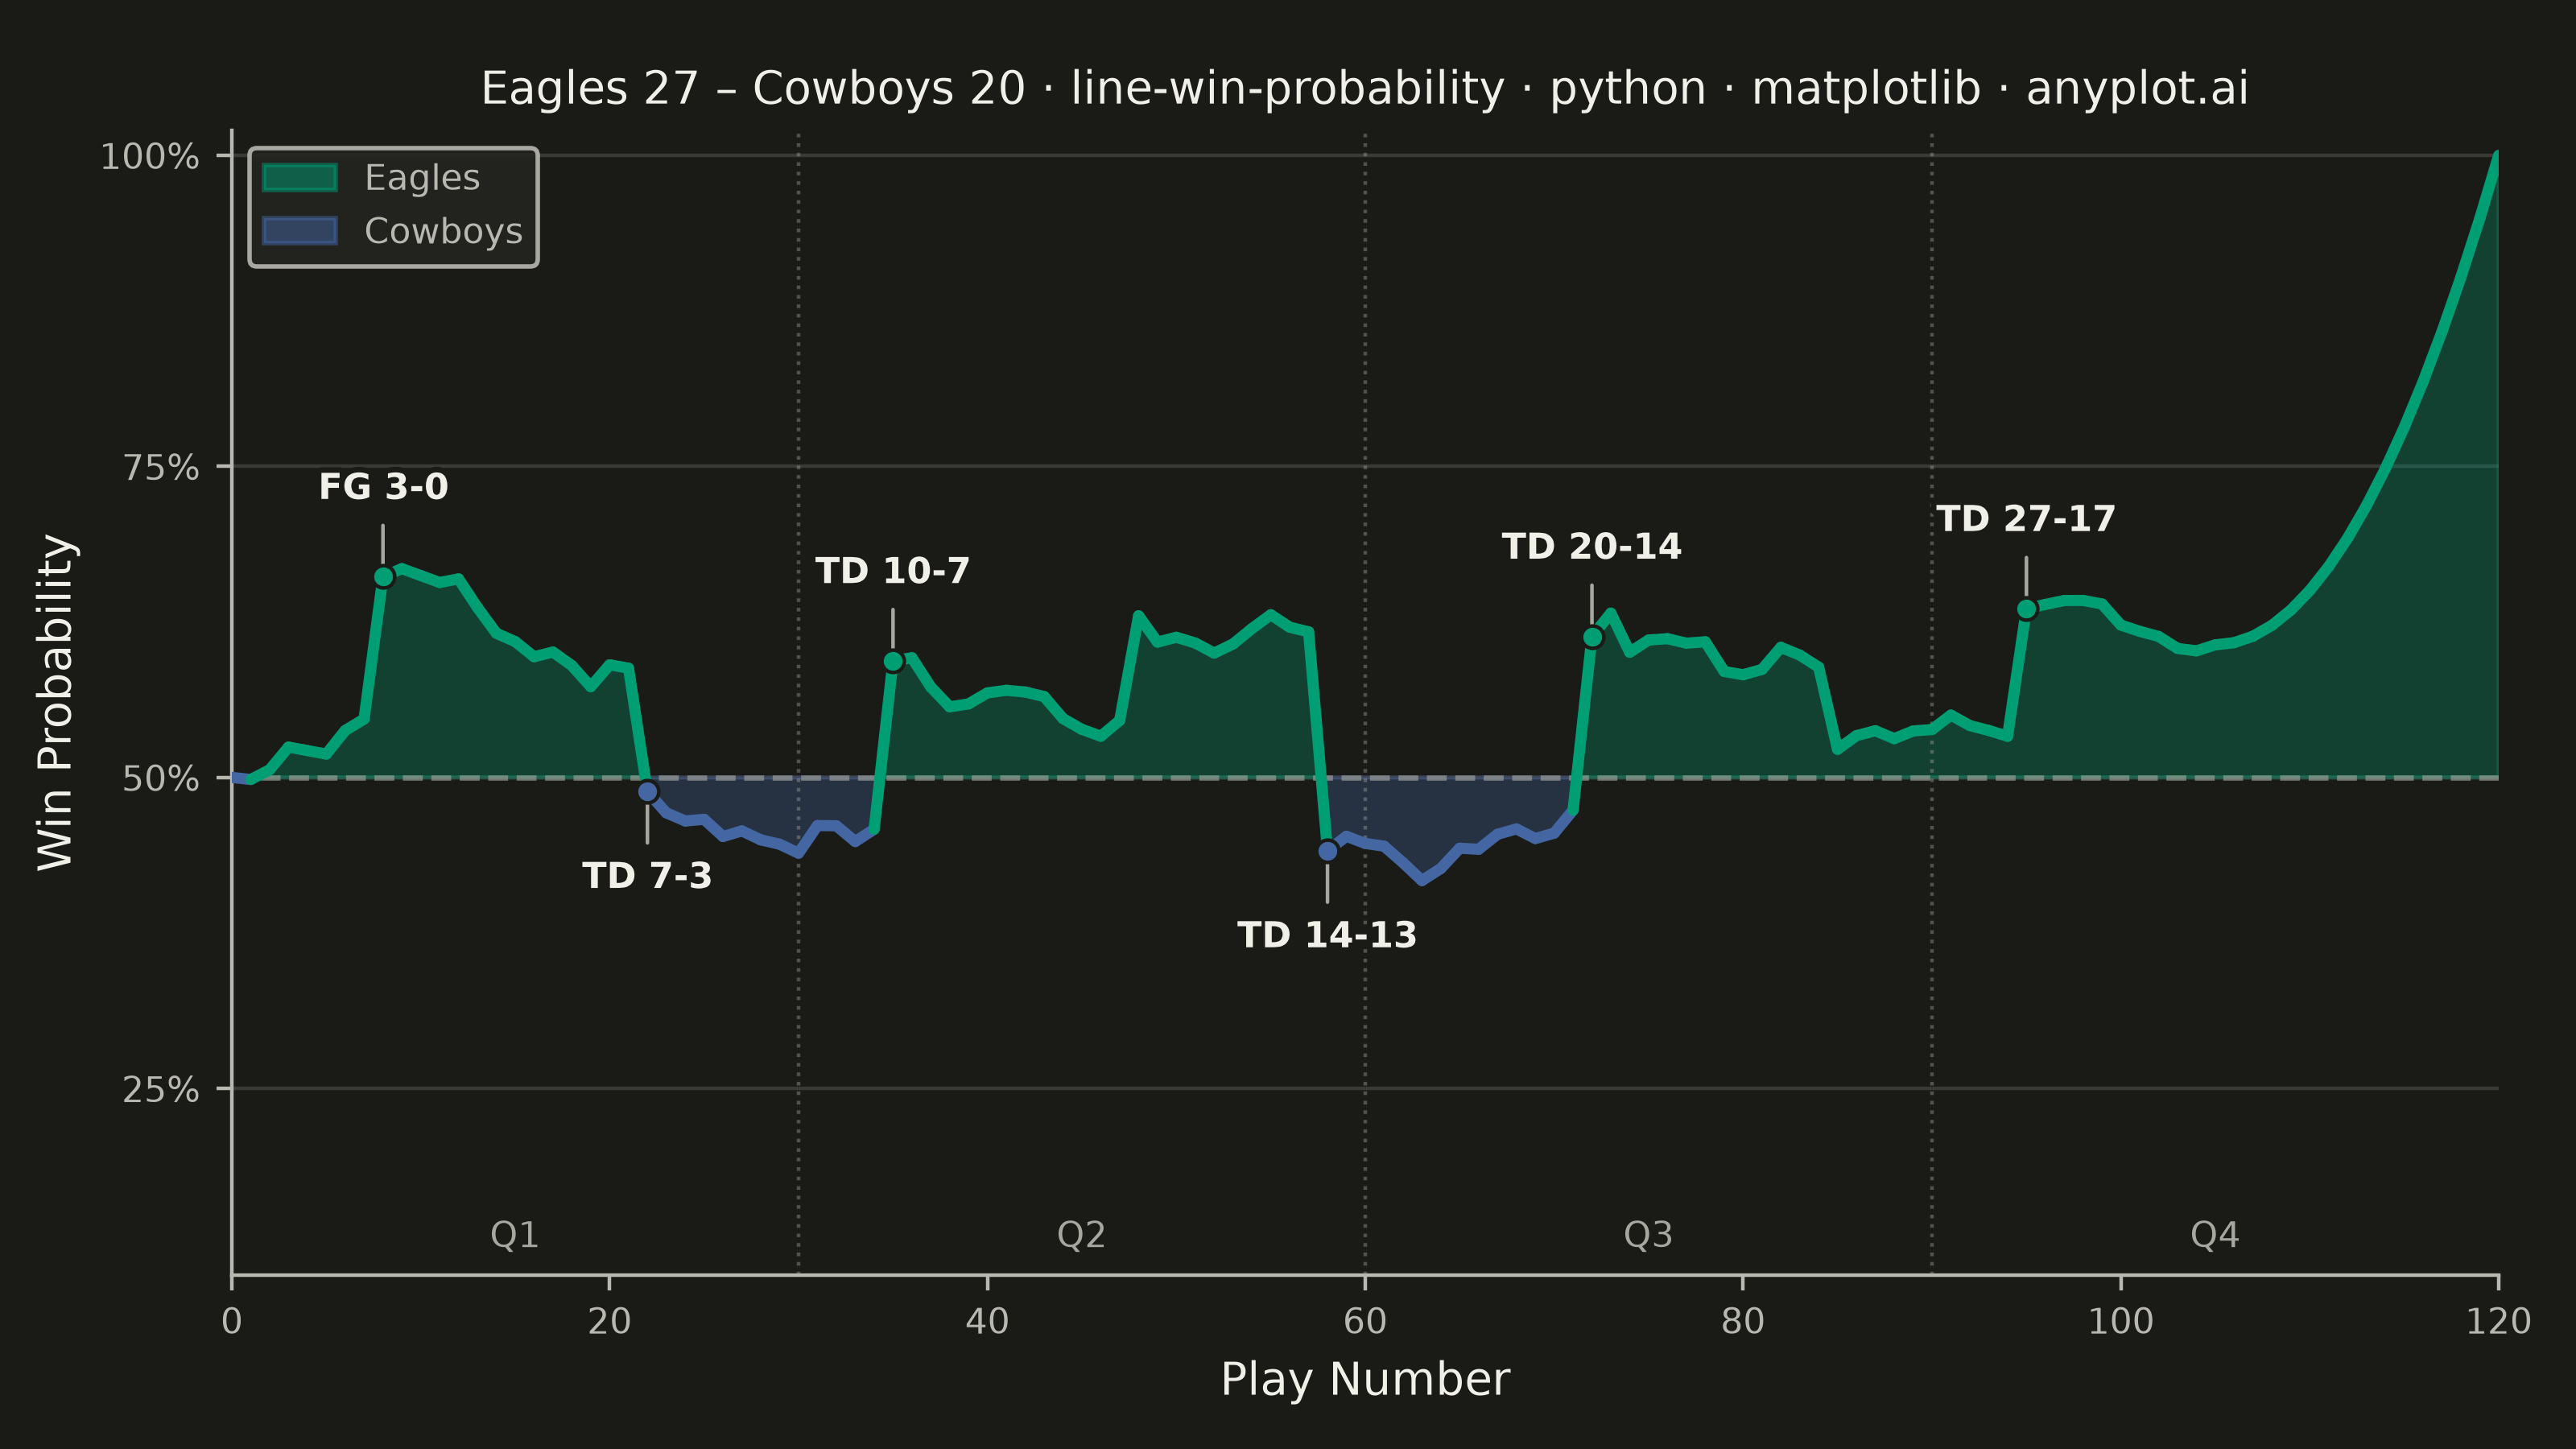
A win probability chart shows how each team's likelihood of winning evolves over the course of a game. The line starts near 50% and fluctuates based on scoring events, ultimately reaching 100% or 0% at game end. The area above and below the 50% baseline is filled with team colors to convey momentum at a glance. This visualization is widely used across major sports for post-game analysis and live broadcasting.
""" anyplot.ai
line-win-probability: Win Probability Chart
Library: matplotlib 3.11.0 | Python 3.13.14
Quality: 88/100 | Updated: 2026-06-21
"""

import os as _os
import sys


# Remove this script's directory from sys.path so this file (matplotlib.py) does
# not shadow the matplotlib package when invoked from inside this directory.
_this_dir = _os.path.dirname(_os.path.abspath(__file__))
sys.path = [p for p in sys.path if _os.path.abspath(p) != _this_dir]
del _this_dir

import os

import matplotlib.patches as mpatches
import matplotlib.patheffects as pe
import matplotlib.pyplot as plt
import matplotlib.ticker as mticker
import numpy as np
from matplotlib.collections import LineCollection


# Theme tokens — Imprint palette, theme-adaptive chrome
THEME = os.getenv("ANYPLOT_THEME", "light")
PAGE_BG = "#FAF8F1" if THEME == "light" else "#1A1A17"
ELEVATED_BG = "#FFFDF6" if THEME == "light" else "#242420"
INK = "#1A1A17" if THEME == "light" else "#F0EFE8"
INK_SOFT = "#4A4A44" if THEME == "light" else "#B8B7B0"
INK_MUTED = "#6B6A63" if THEME == "light" else "#A8A79F"

# Imprint palette — semantic mapping: Eagles → brand green, Cowboys → blue
EAGLES_COLOR = "#009E73"  # Imprint position 1 — home team
COWBOYS_COLOR = "#4467A3"  # Imprint position 3 — away team

# Data — simulated NFL game: Eagles vs Cowboys
np.random.seed(42)

n_plays = 120
plays = np.arange(n_plays + 1)
win_prob = np.full(n_plays + 1, 0.50)

scoring_events = [
    (8, 0.12, "PHI Field Goal (3-0)"),
    (22, -0.10, "DAL Touchdown (7-3)"),
    (35, 0.15, "PHI Touchdown (10-7)"),
    (48, 0.08, "PHI Field Goal (13-7)"),
    (58, -0.18, "DAL Touchdown (14-13)"),
    (72, 0.14, "PHI Touchdown (20-14)"),
    (85, -0.06, "DAL Field Goal (20-17)"),
    (95, 0.12, "PHI Touchdown (27-17)"),
    (110, -0.05, "DAL Field Goal (27-20)"),
]

prob = 0.50
noise = np.random.normal(0, 0.012, n_plays + 1)
event_indices = {e[0]: (e[1], e[2]) for e in scoring_events}

for i in range(1, n_plays + 1):
    if i in event_indices:
        prob += event_indices[i][0]
    prob += noise[i]
    prob = np.clip(prob, 0.02, 0.98)
    win_prob[i] = prob

# Force convergence to Eagles win
for i in range(105, n_plays + 1):
    t = (i - 105) / (n_plays - 105)
    win_prob[i] = win_prob[105] * (1 - t**2) + 1.0 * t**2

quarter_boundaries = [0, 30, 60, 90, n_plays]
quarter_labels = ["Q1", "Q2", "Q3", "Q4"]

# Plot
fig, ax = plt.subplots(figsize=(8, 4.5), dpi=400, facecolor=PAGE_BG)
ax.set_facecolor(PAGE_BG)

# Fill above/below 50% — balanced alphas so neither team's fill dominates visually
ax.fill_between(plays, win_prob, 0.5, where=(win_prob >= 0.5), color=EAGLES_COLOR, alpha=0.30, interpolate=True)
ax.fill_between(plays, win_prob, 0.5, where=(win_prob < 0.5), color=COWBOYS_COLOR, alpha=0.30, interpolate=True)

# Win probability line via LineCollection — idiomatic and efficient
points = np.array([plays, win_prob]).T.reshape(-1, 1, 2)
segments = np.concatenate([points[:-1], points[1:]], axis=1)
midpoints = (win_prob[:-1] + win_prob[1:]) / 2
seg_colors = [EAGLES_COLOR if m >= 0.5 else COWBOYS_COLOR for m in midpoints]
lc = LineCollection(segments, colors=seg_colors, linewidths=2.5, zorder=3, capstyle="round")
ax.add_collection(lc)

# 50% baseline
ax.axhline(y=0.5, color=INK_MUTED, linewidth=1.2, linestyle="--", alpha=0.6, zorder=2)

# Quarter dividers and labels
for qb in quarter_boundaries[1:-1]:
    ax.axvline(x=qb, color=INK_MUTED, linewidth=0.8, linestyle=":", alpha=0.4)

for i, label in enumerate(quarter_labels):
    mid = (quarter_boundaries[i] + quarter_boundaries[i + 1]) / 2
    ax.text(mid, 0.13, label, ha="center", va="center", fontsize=8, color=INK_MUTED, fontweight="medium")

# Annotate key scoring events
annotation_events = [
    (8, "FG 3-0"),
    (22, "TD 7-3"),
    (35, "TD 10-7"),
    (58, "TD 14-13"),
    (72, "TD 20-14"),
    (95, "TD 27-17"),
]

for play_idx, label in annotation_events:
    wp = win_prob[play_idx]
    offset_y = 0.07 if wp >= 0.5 else -0.07
    txt = ax.annotate(
        label,
        xy=(play_idx, wp),
        xytext=(play_idx, wp + offset_y),
        fontsize=8,
        fontweight="bold",
        ha="center",
        va="center",
        color=INK,
        arrowprops={"arrowstyle": "-", "color": INK_MUTED, "linewidth": 0.8},
        zorder=4,
    )
    txt.set_path_effects([pe.withStroke(linewidth=2.5, foreground=PAGE_BG)])

# Scoring event dots on the curve
for play_idx, _ in annotation_events:
    color = EAGLES_COLOR if win_prob[play_idx] >= 0.5 else COWBOYS_COLOR
    ax.plot(
        play_idx,
        win_prob[play_idx],
        "o",
        color=color,
        markersize=5,
        zorder=5,
        markeredgecolor=PAGE_BG,
        markeredgewidth=0.8,
    )

# Axes
ax.set_xlim(0, n_plays)
ax.set_ylim(0.10, 1.02)
ax.set_yticks([0.25, 0.5, 0.75, 1.0])
ax.yaxis.set_major_formatter(mticker.FuncFormatter(lambda x, _: f"{x:.0%}"))

# Grid — subtle y-axis only
ax.yaxis.grid(True, alpha=0.15, linewidth=0.8, color=INK)
ax.set_axisbelow(True)

# Labels and scaled title
title = "Eagles 27 – Cowboys 20 · line-win-probability · python · matplotlib · anyplot.ai"
title_fontsize = max(8, round(12 * 67 / len(title)))
ax.set_xlabel("Play Number", fontsize=10, color=INK)
ax.set_ylabel("Win Probability", fontsize=10, color=INK)
ax.set_title(title, fontsize=title_fontsize, fontweight="medium", color=INK)
ax.tick_params(axis="both", labelsize=8, colors=INK_SOFT, labelcolor=INK_SOFT)

# Spines
ax.spines["top"].set_visible(False)
ax.spines["right"].set_visible(False)
for s in ("left", "bottom"):
    ax.spines[s].set_color(INK_SOFT)

# Legend
eagles_patch = mpatches.Patch(color=EAGLES_COLOR, alpha=0.5, label="Eagles")
cowboys_patch = mpatches.Patch(color=COWBOYS_COLOR, alpha=0.5, label="Cowboys")
leg = ax.legend(handles=[eagles_patch, cowboys_patch], fontsize=8, loc="upper left", framealpha=0.9, edgecolor=INK_SOFT)
if leg:
    leg.get_frame().set_facecolor(ELEVATED_BG)
    leg.get_frame().set_edgecolor(INK_SOFT)
    plt.setp(leg.get_texts(), color=INK_SOFT)

fig.subplots_adjust(left=0.09, right=0.97, top=0.91, bottom=0.12)

# Save — no bbox_inches="tight" (would trim canvas from 3200×1800)
plt.savefig(f"plot-{THEME}.png", dpi=400, facecolor=PAGE_BG)
Runnable source as JSON, for any HTTP client: https://api.anyplot.ai/specs/line-win-probability/matplotlib/code. Any spec id and library id listed in llms-full.txt fit the same URL shape; every URL below is complete and callable.
{
  "spec_id": "line-win-probability",
  "language": "python",
  "library": "matplotlib",
  "page": "https://anyplot.ai/line-win-probability/python/matplotlib",
  "hub": "https://anyplot.ai/line-win-probability",
  "code_json": "https://api.anyplot.ai/specs/line-win-probability/matplotlib/code",
  "spec_json": "https://api.anyplot.ai/specs/line-win-probability",
  "render_light_png": "https://storage.googleapis.com/anyplot-images/plots/line-win-probability/python/matplotlib/plot-light.png",
  "render_dark_png": "https://storage.googleapis.com/anyplot-images/plots/line-win-probability/python/matplotlib/plot-dark.png",
  "quality_score": 88.0,
  "license": "MIT",
  "guide": "https://anyplot.ai/llms.txt"
}
Part of Win Probability Chart on anyplot.ai.