The same plot in 14 other libraries — JavaScript: Chart.js, D3.js, Highcharts, MUI X Charts; Python: Altair, Bokeh, lets-plot, Matplotlib, Plotly, plotnine, Pygal, Seaborn; R: ggplot2; Julia: Makie.jl. Compare all 15 side by side: Win Probability Chart in Python, R, Julia and JavaScript.
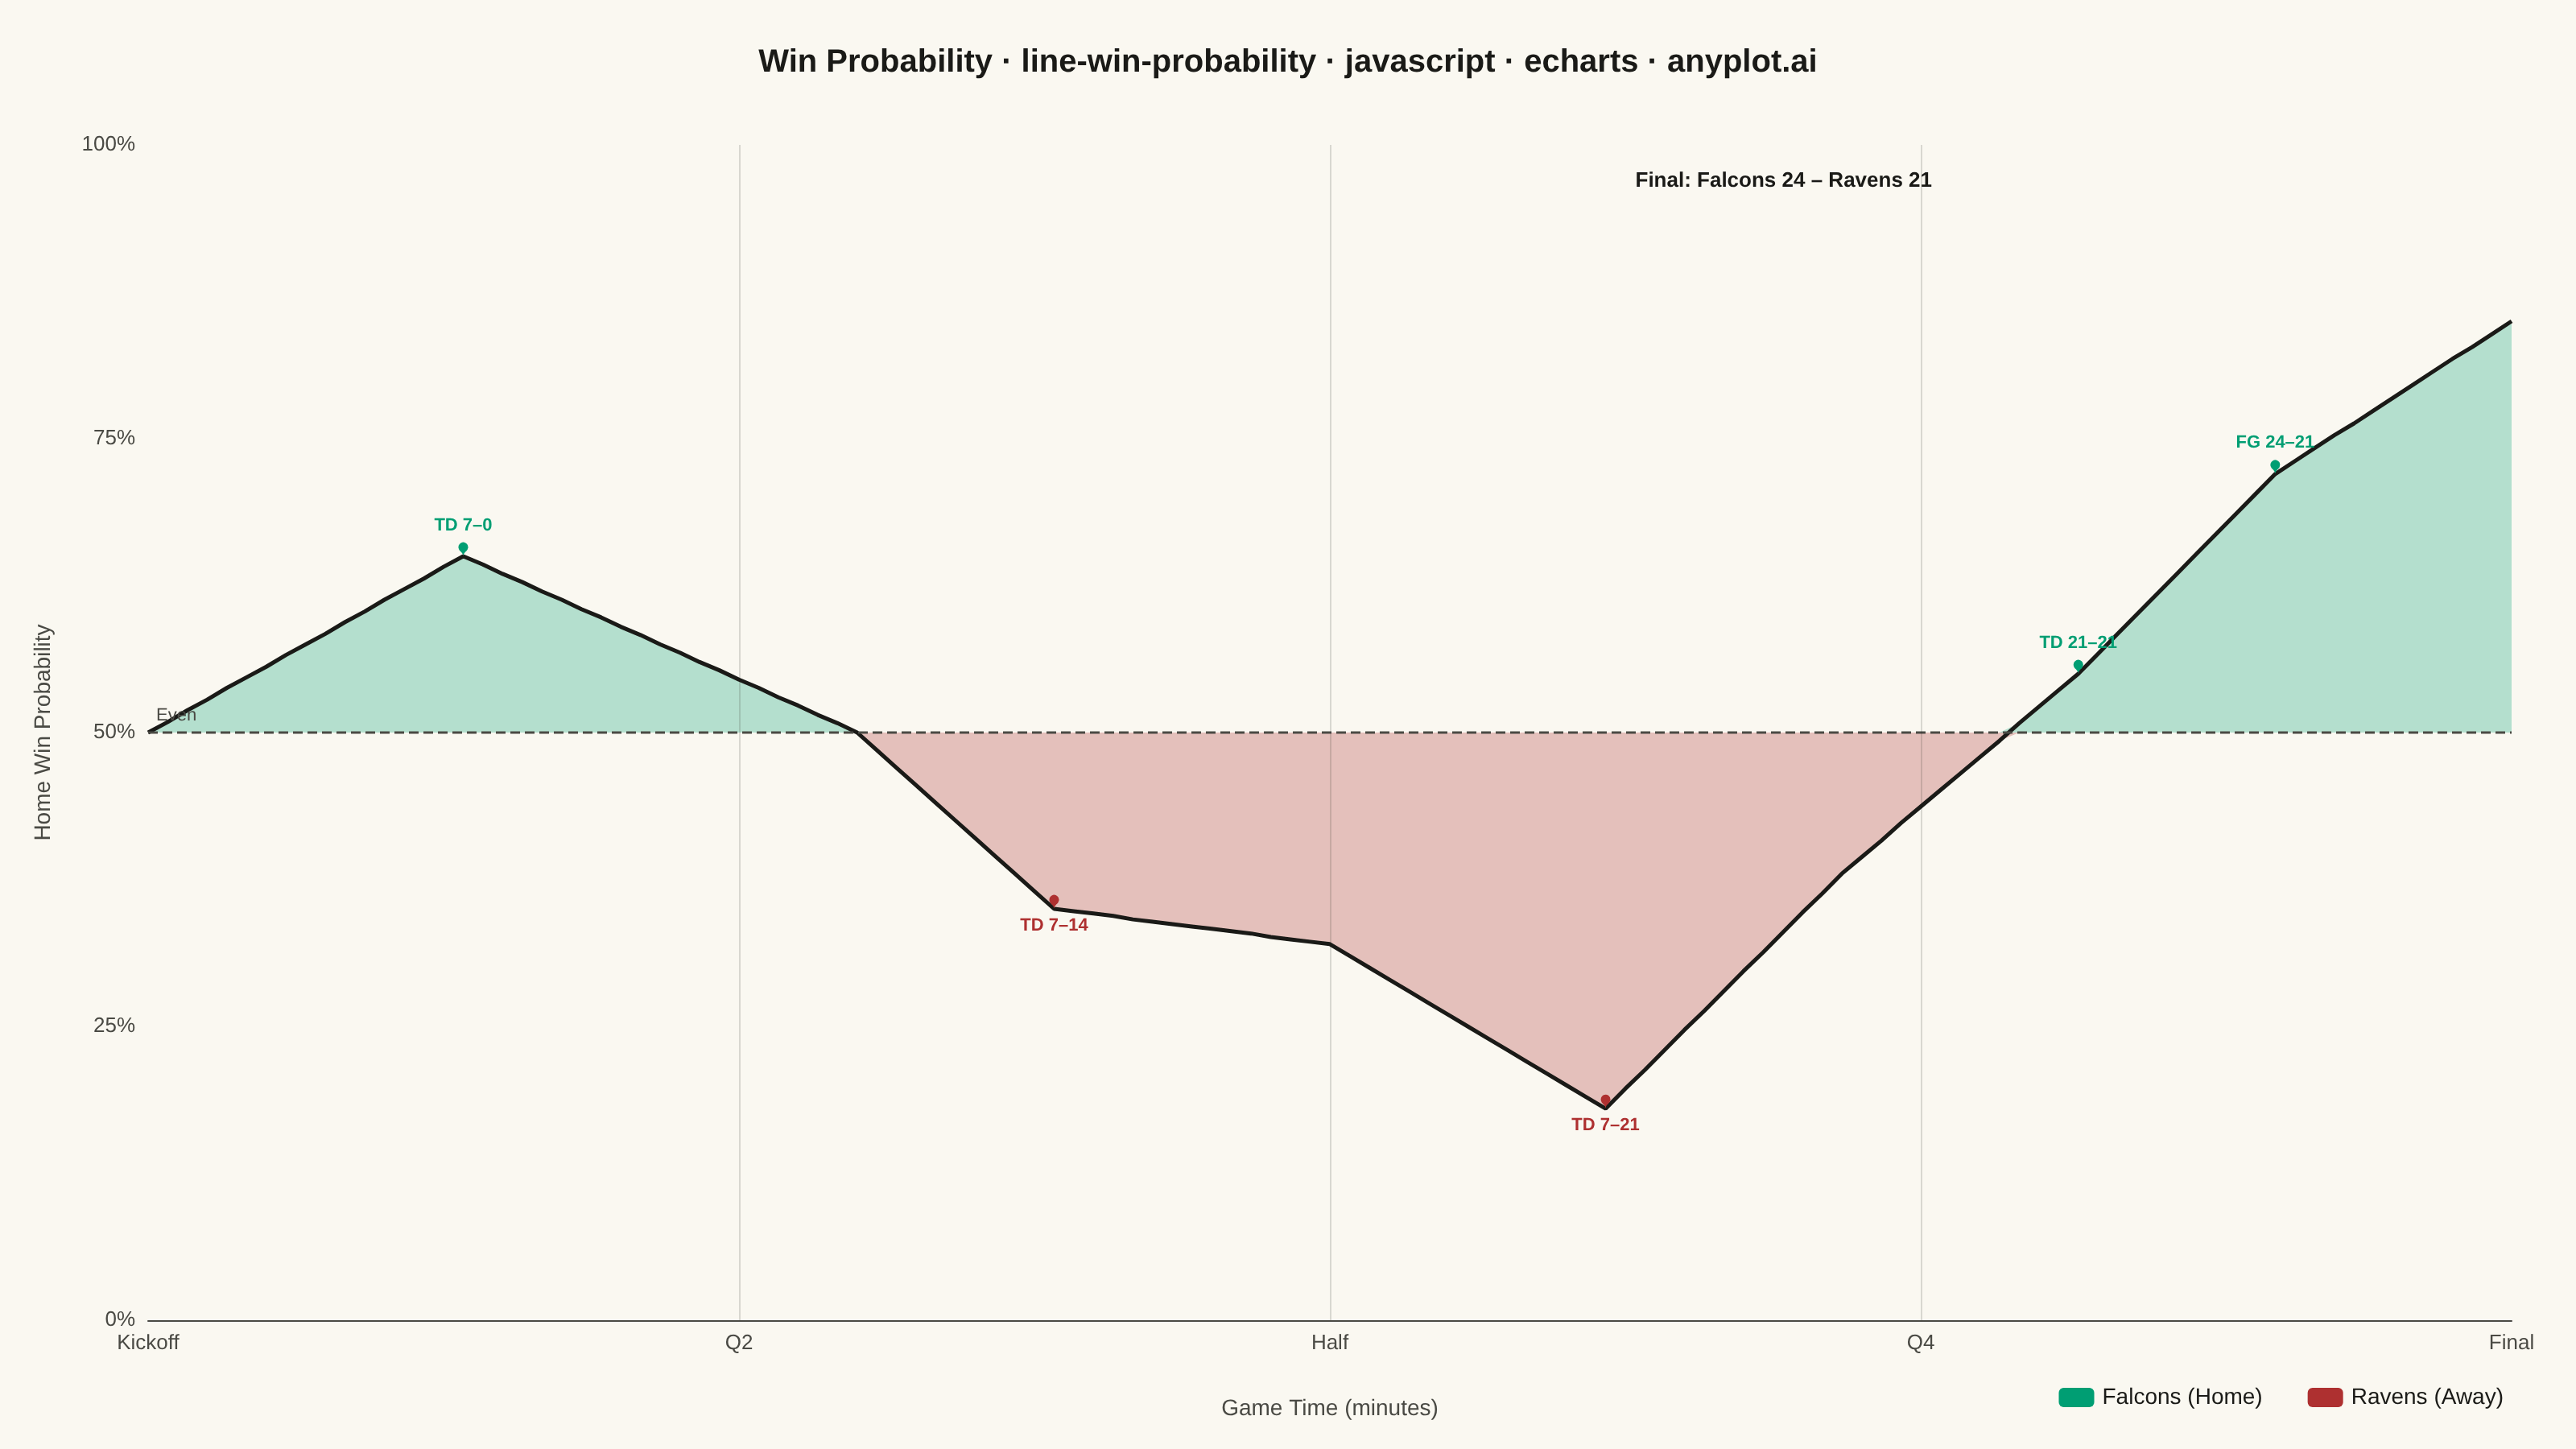
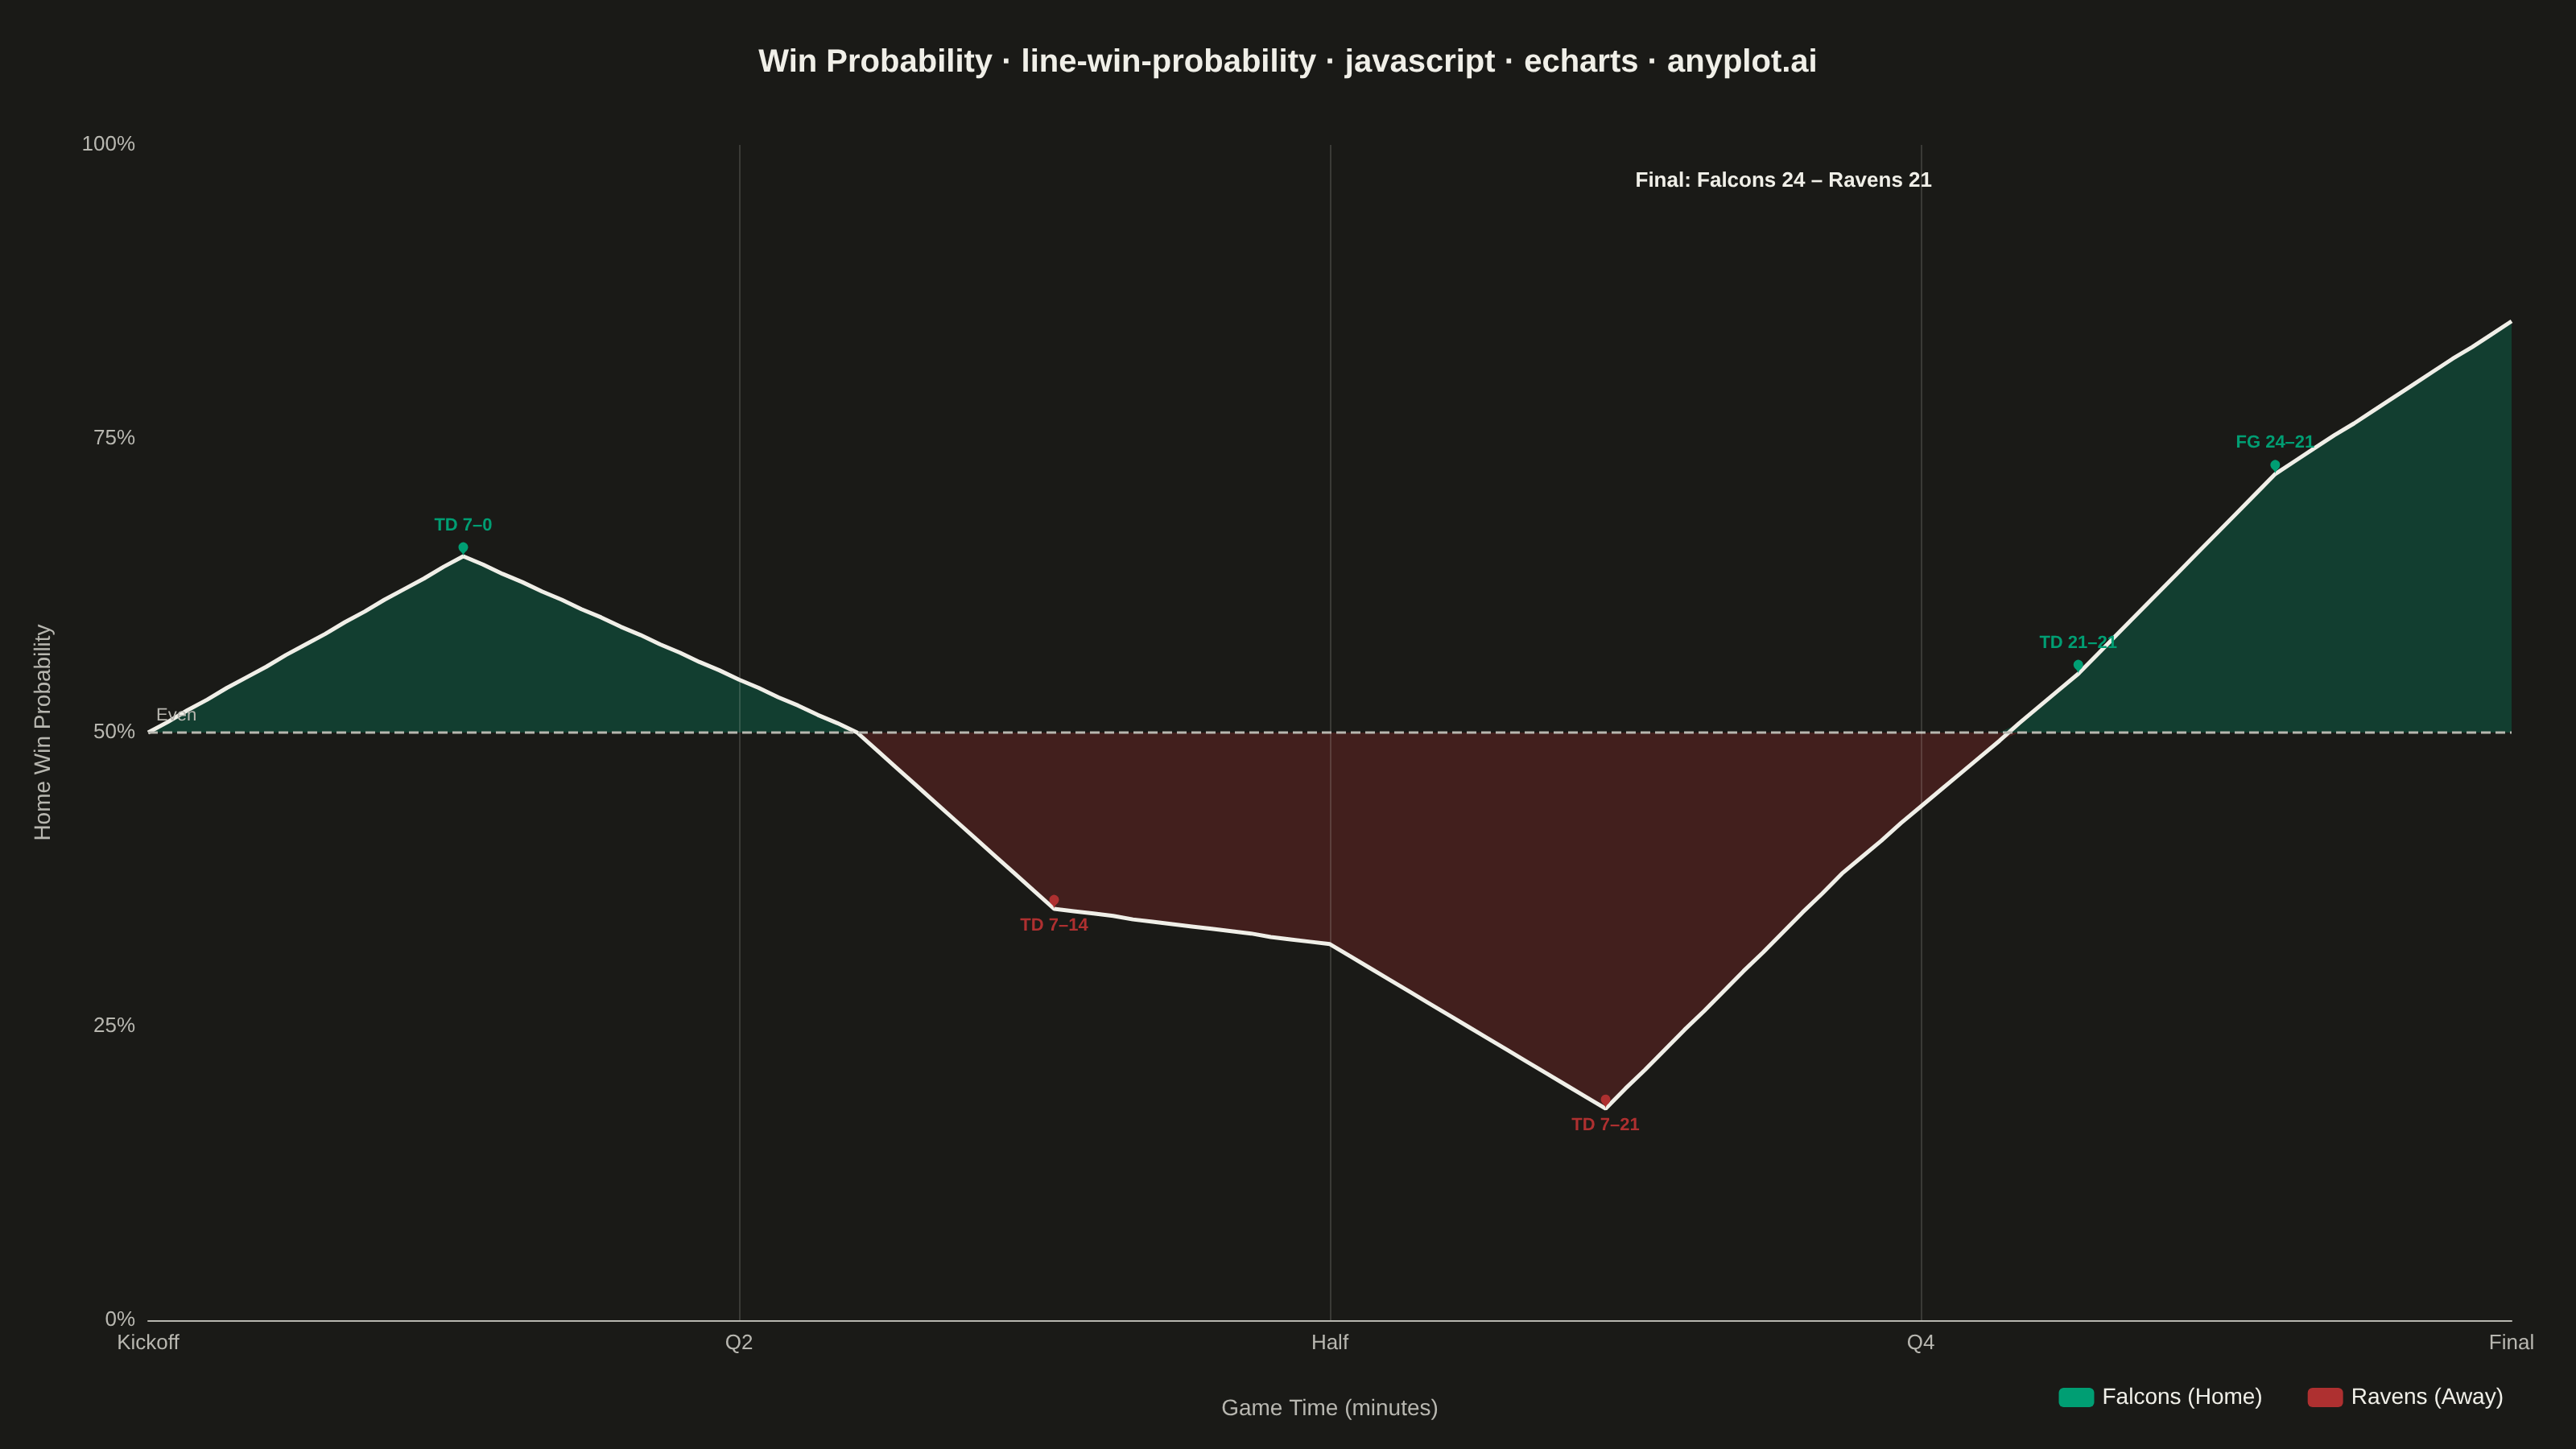
A win probability chart shows how each team's likelihood of winning evolves over the course of a game. The line starts near 50% and fluctuates based on scoring events, ultimately reaching 100% or 0% at game end. The area above and below the 50% baseline is filled with team colors to convey momentum at a glance. This visualization is widely used across major sports for post-game analysis and live broadcasting.
// anyplot.ai
// line-win-probability: Win Probability Chart
// Library: echarts 5.5.1 | JavaScript 22.22.3
// Quality: 90/100 | Created: 2026-06-21

const t = window.ANYPLOT_TOKENS;

// NFL comeback — Atlanta Falcons (home) vs Baltimore Ravens (away)
// Home-team win probability by game minute, derived from in-game model
const keyPoints = [
  [0, 50], [8, 65], [18, 50], [23, 35],
  [30, 32], [37, 18], [43, 38], [49, 55], [54, 72], [60, 85],
];

// Linear interpolation between key turning points (~2 pts per minute)
const times = [], probs = [];
for (let i = 0; i < keyPoints.length - 1; i++) {
  const [x0, y0] = keyPoints[i], [x1, y1] = keyPoints[i + 1];
  const steps = Math.max(4, Math.round((x1 - x0) * 2));
  for (let s = 0; s < steps; s++) {
    const f = s / steps;
    times.push(+(x0 + (x1 - x0) * f).toFixed(2));
    probs.push(+(y0 + (y1 - y0) * f).toFixed(1));
  }
}
times.push(60); probs.push(85);

// Clamped arrays: area above 50% (home) and below 50% (away)
const lineData     = times.map((m, i) => [m, probs[i]]);
const homeAreaData = times.map((m, i) => [m, Math.max(probs[i], 50)]);
const awayAreaData = times.map((m, i) => [m, Math.min(probs[i], 50)]);

// Title with proportional font scaling
const titleText = "Win Probability · line-win-probability · javascript · echarts · anyplot.ai";
const titleFs = Math.max(14, Math.round(22 * Math.min(1, 67 / titleText.length)));

const chart = echarts.init(document.getElementById("container"));

chart.setOption({
  animation: false,
  backgroundColor: "transparent",
  color: t.palette,

  title: {
    text: titleText,
    left: "center",
    top: 24,
    textStyle: { color: t.ink, fontSize: titleFs, fontWeight: "600" },
  },

  legend: {
    data: [
      { name: "Falcons (Home)", icon: "roundRect" },
      { name: "Ravens (Away)",  icon: "roundRect" },
    ],
    right: 40,
    bottom: 20,
    textStyle: { color: t.ink, fontSize: 14 },
    itemWidth: 22,
    itemHeight: 12,
    itemGap: 28,
  },

  grid: { left: 92, right: 40, top: 90, bottom: 80 },

  xAxis: {
    type: "value",
    name: "Game Time (minutes)",
    nameLocation: "middle",
    nameGap: 48,
    nameTextStyle: { color: t.inkSoft, fontSize: 14 },
    min: 0, max: 60,
    interval: 15,
    axisLabel: {
      color: t.inkSoft, fontSize: 13,
      formatter: v => ({ 0: "Kickoff", 15: "Q2", 30: "Half", 45: "Q4", 60: "Final" }[v] ?? ""),
    },
    axisLine: { lineStyle: { color: t.inkSoft } },
    axisTick: { show: false },
    splitLine: { show: false },
  },

  yAxis: {
    type: "value",
    name: "Home Win Probability",
    nameLocation: "middle",
    nameGap: 58,
    nameTextStyle: { color: t.inkSoft, fontSize: 14 },
    min: 0, max: 100,
    interval: 25,
    axisLabel: { color: t.inkSoft, fontSize: 13, formatter: "{value}%" },
    axisLine: { show: false },
    axisTick: { show: false },
    splitLine: { show: false },
  },

  series: [
    // Away team fill — below 50% (Ravens)
    {
      name: "Ravens (Away)",
      type: "line",
      data: awayAreaData,
      symbol: "none",
      lineStyle: { width: 0 },
      itemStyle: { color: t.palette[4] },
      areaStyle: { color: t.palette[4], opacity: 0.28, origin: 50 },
      z: 1, silent: true,
    },
    // Home team fill — above 50% (Falcons)
    {
      name: "Falcons (Home)",
      type: "line",
      data: homeAreaData,
      symbol: "none",
      lineStyle: { width: 0 },
      itemStyle: { color: t.palette[0] },
      areaStyle: { color: t.palette[0], opacity: 0.28, origin: 50 },
      z: 1, silent: true,
    },
    // Main win-probability line with annotations
    {
      type: "line",
      data: lineData,
      symbol: "none",
      lineStyle: { width: 2.5, color: t.ink },
      z: 3,
      markLine: {
        silent: true,
        symbol: "none",
        data: [
          // 50% reference
          {
            yAxis: 50,
            lineStyle: { color: t.inkSoft, type: "dashed", width: 1.5 },
            label: {
              show: true, position: "insideStartTop",
              formatter: "Even", color: t.inkSoft, fontSize: 11,
            },
          },
          // Quarter dividers
          { xAxis: 15, lineStyle: { color: t.grid, type: "solid", width: 1 }, label: { show: false } },
          { xAxis: 30, lineStyle: { color: t.grid, type: "solid", width: 1 }, label: { show: false } },
          { xAxis: 45, lineStyle: { color: t.grid, type: "solid", width: 1 }, label: { show: false } },
        ],
      },
      markPoint: {
        silent: true,
        symbolSize: 10,
        data: [
          {
            coord: [8, 65],
            itemStyle: { color: t.palette[0] },
            label: { show: true, formatter: "TD 7–0",   color: t.palette[0], fontSize: 11, fontWeight: "700", position: "top" },
          },
          {
            coord: [23, 35],
            itemStyle: { color: t.palette[4] },
            label: { show: true, formatter: "TD 7–14",  color: t.palette[4], fontSize: 11, fontWeight: "700", position: "bottom" },
          },
          {
            coord: [37, 18],
            itemStyle: { color: t.palette[4] },
            label: { show: true, formatter: "TD 7–21",  color: t.palette[4], fontSize: 11, fontWeight: "700", position: "bottom" },
          },
          {
            coord: [49, 55],
            itemStyle: { color: t.palette[0] },
            label: { show: true, formatter: "TD 21–21", color: t.palette[0], fontSize: 11, fontWeight: "700", position: "top" },
          },
          {
            coord: [54, 72],
            itemStyle: { color: t.palette[0] },
            label: { show: true, formatter: "FG 24–21", color: t.palette[0], fontSize: 11, fontWeight: "700", position: "top" },
          },
        ],
      },
    },
  ],

  graphic: [
    {
      type: "text",
      z: 5,
      style: {
        text: "Final: Falcons 24 – Ravens 21",
        fill: t.ink,
        fontSize: 13,
        fontWeight: "600",
        x: 1200,
        y: 106,
        textAlign: "right",
      },
    },
  ],
});
Runnable source as JSON, for any HTTP client: https://api.anyplot.ai/specs/line-win-probability/echarts/code. Any spec id and library id listed in llms-full.txt fit the same URL shape; every URL below is complete and callable.
{
  "spec_id": "line-win-probability",
  "language": "javascript",
  "library": "echarts",
  "page": "https://anyplot.ai/line-win-probability/javascript/echarts",
  "hub": "https://anyplot.ai/line-win-probability",
  "code_json": "https://api.anyplot.ai/specs/line-win-probability/echarts/code",
  "spec_json": "https://api.anyplot.ai/specs/line-win-probability",
  "render_light_png": "https://storage.googleapis.com/anyplot-images/plots/line-win-probability/javascript/echarts/plot-light.png",
  "render_dark_png": "https://storage.googleapis.com/anyplot-images/plots/line-win-probability/javascript/echarts/plot-dark.png",
  "interactive_light_html": "https://storage.googleapis.com/anyplot-images/plots/line-win-probability/javascript/echarts/plot-light.html",
  "interactive_dark_html": "https://storage.googleapis.com/anyplot-images/plots/line-win-probability/javascript/echarts/plot-dark.html",
  "quality_score": 90.0,
  "license": "MIT",
  "guide": "https://anyplot.ai/llms.txt"
}
Part of Win Probability Chart on anyplot.ai.