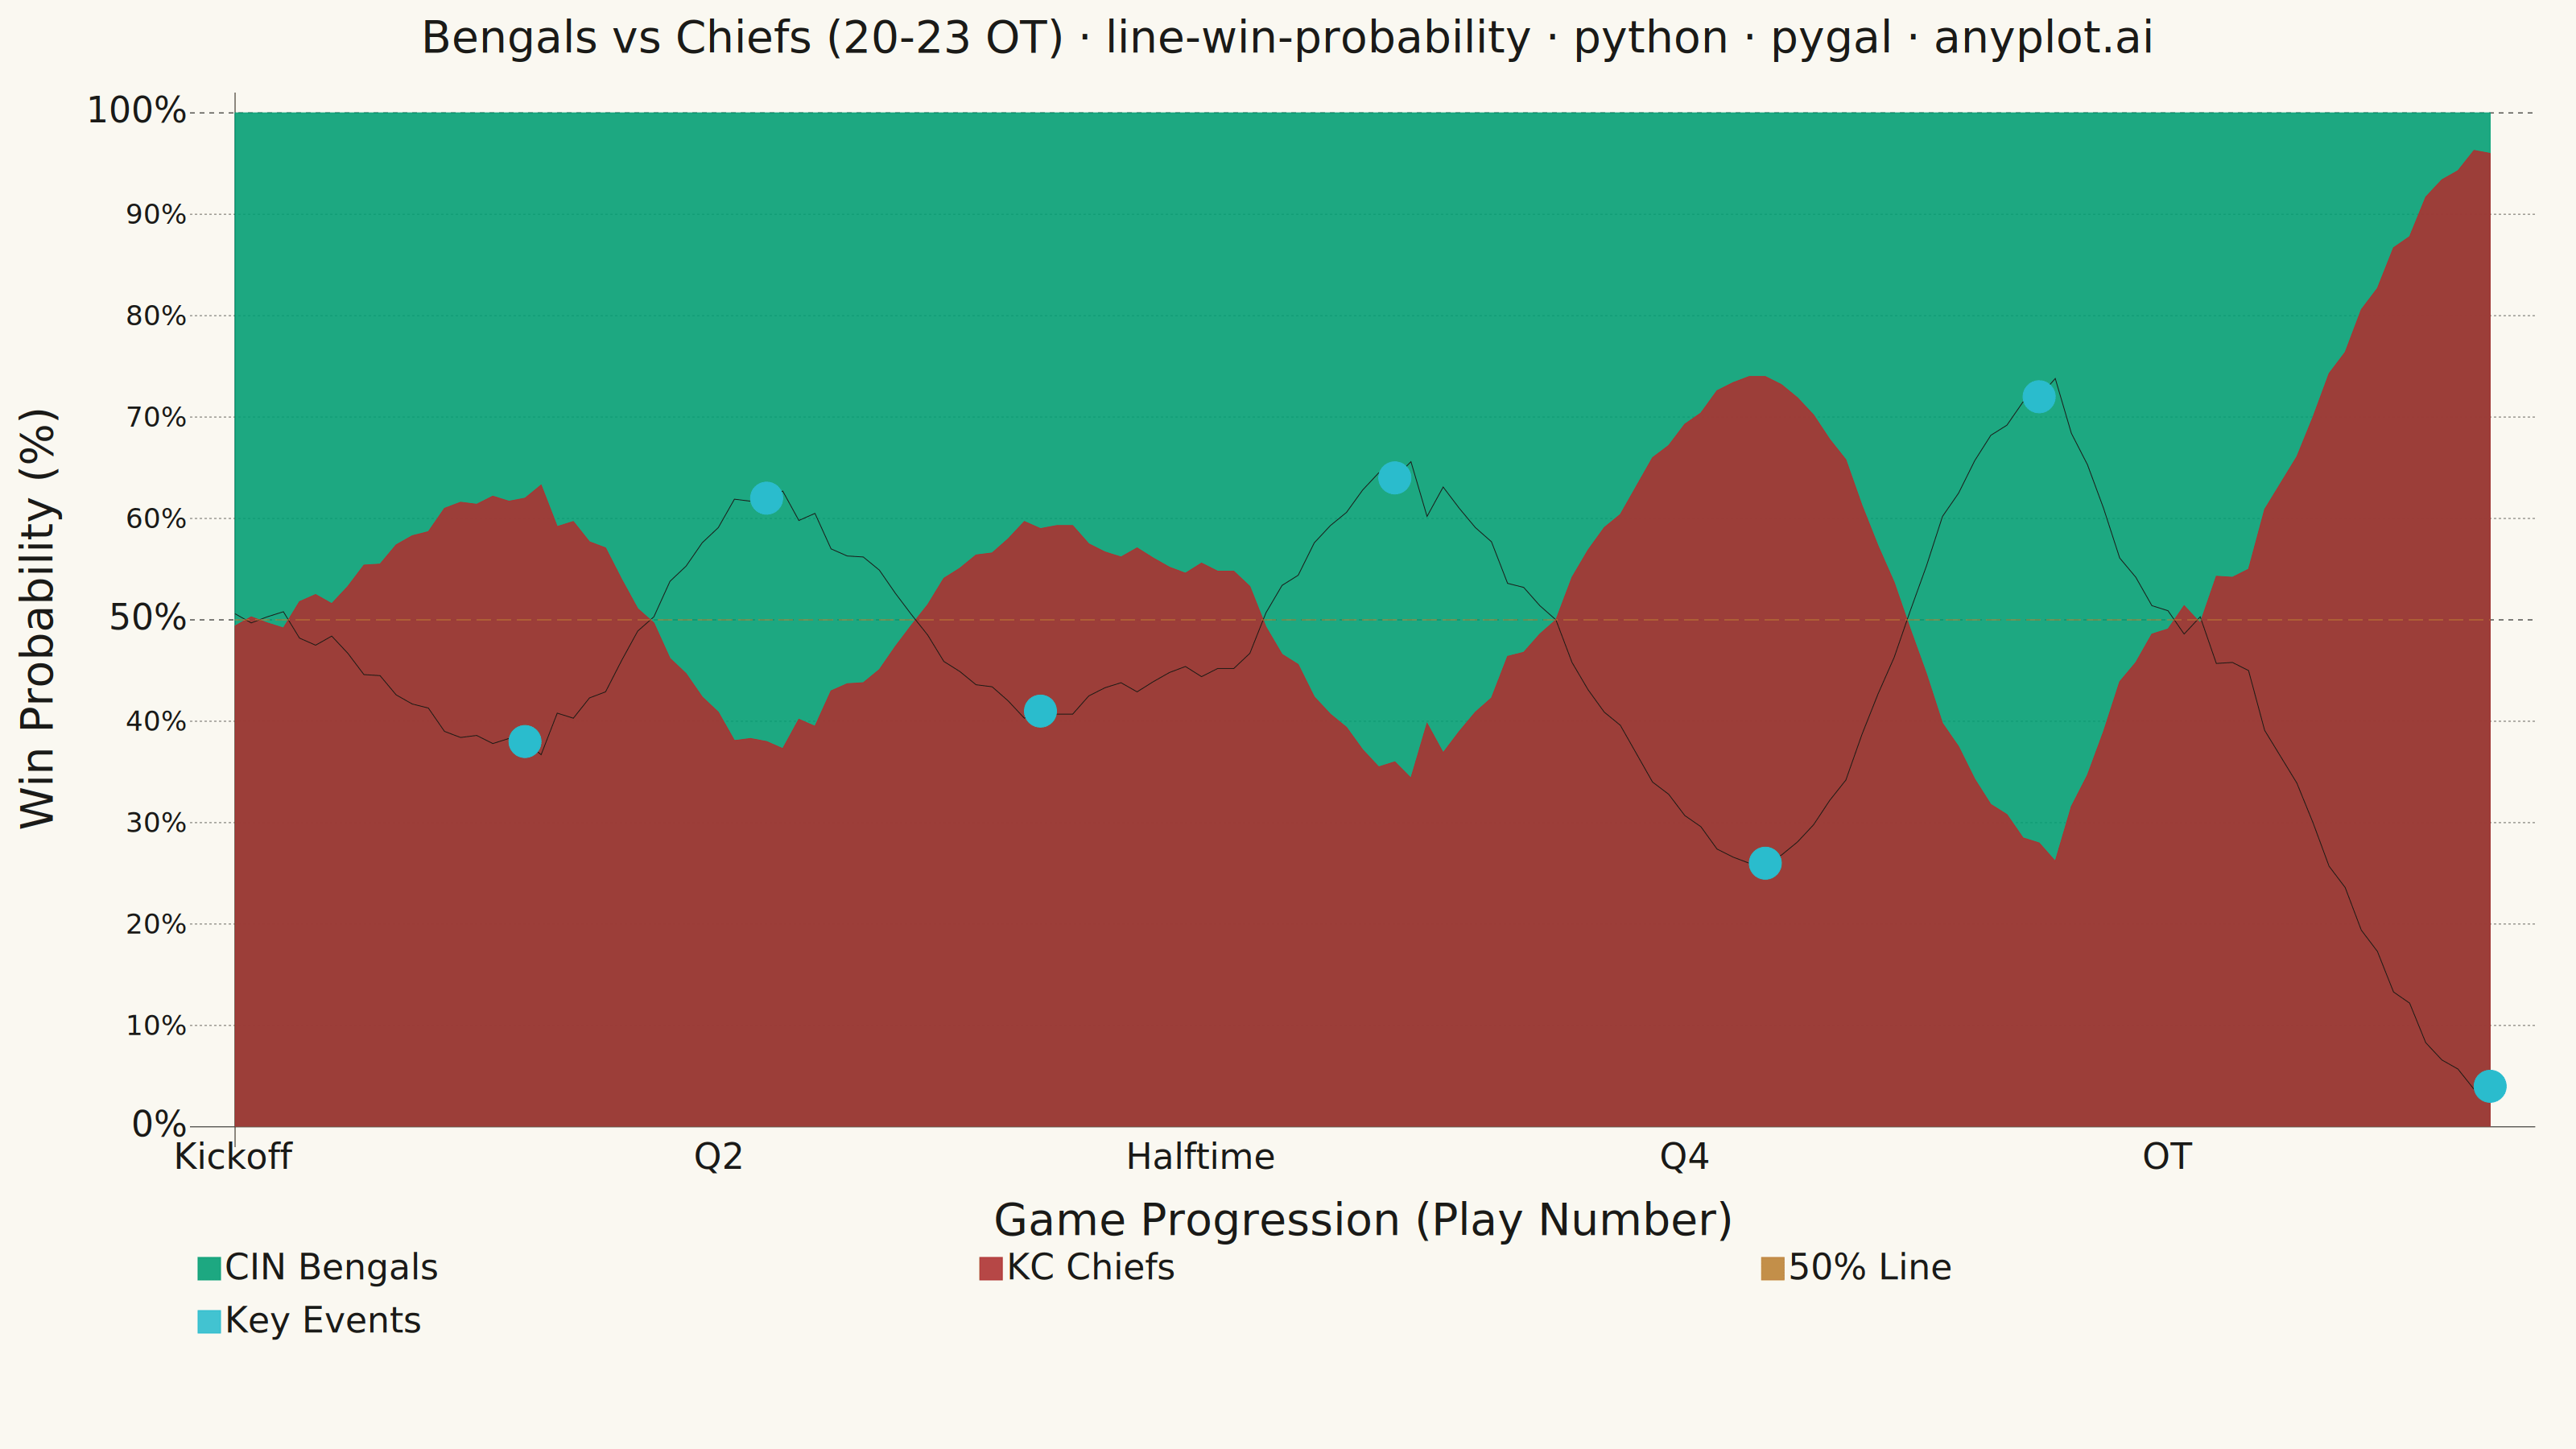
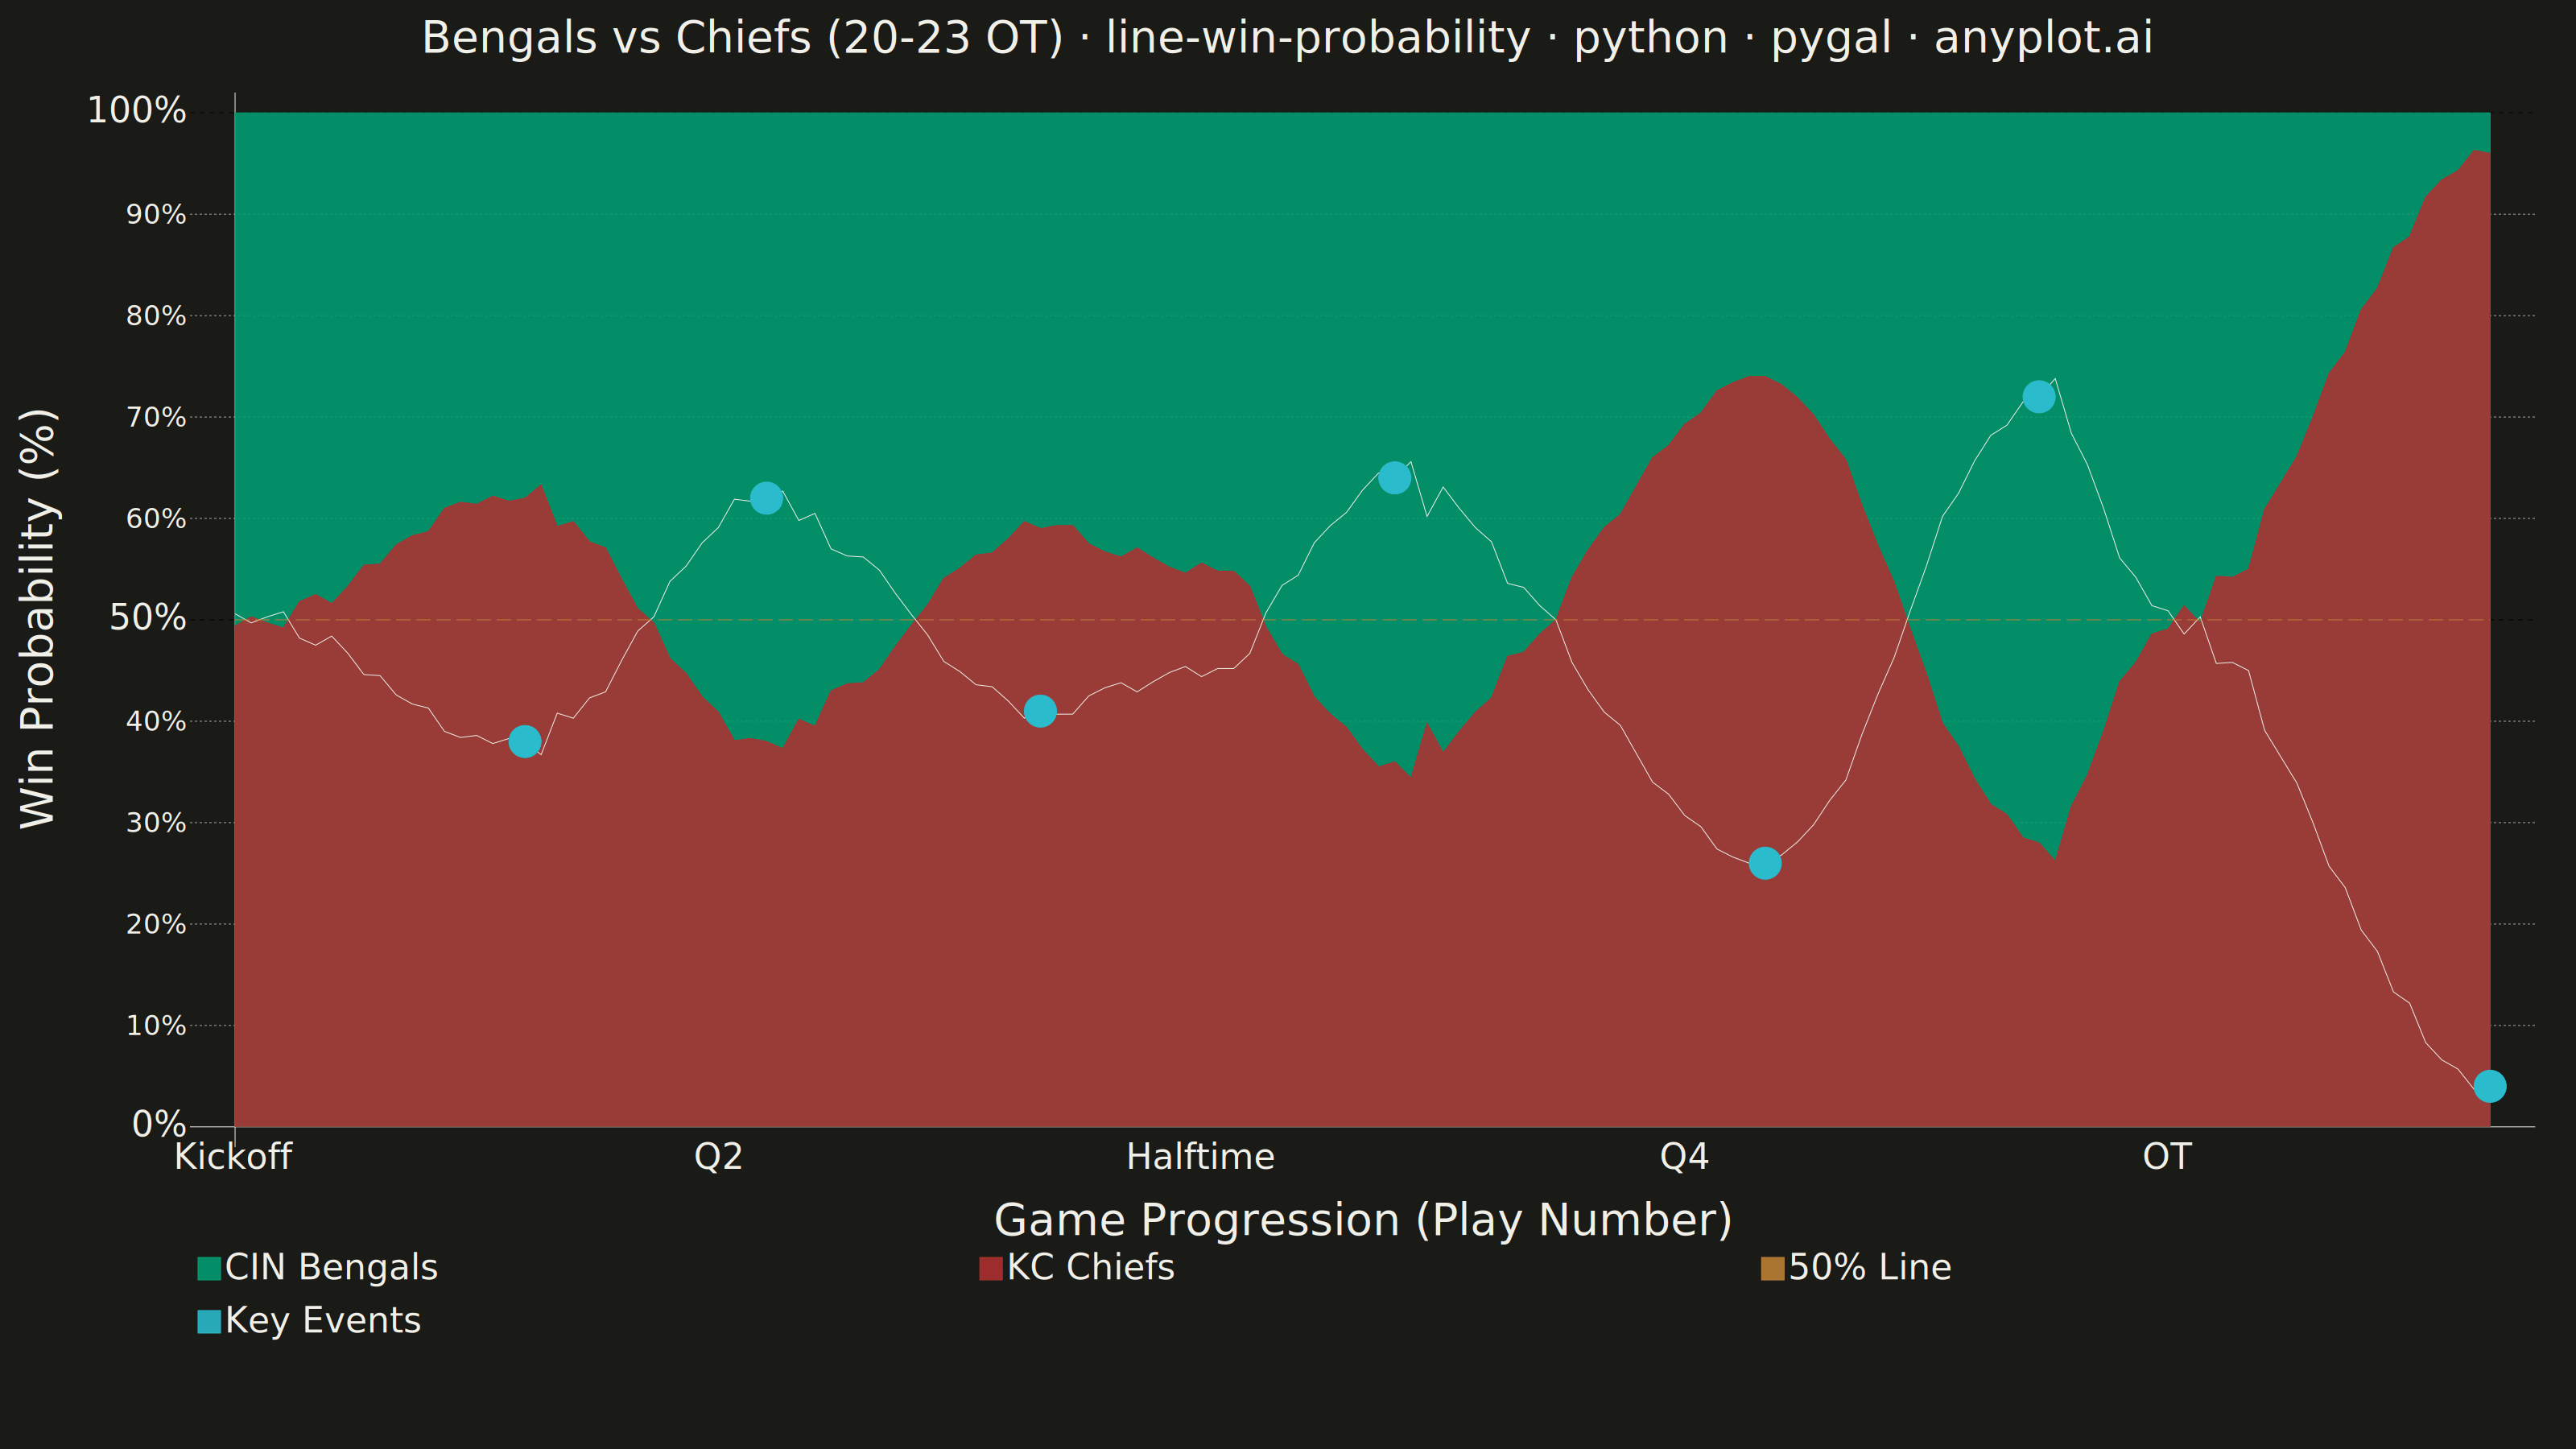
A win probability chart shows how each team's likelihood of winning evolves over the course of a game. The line starts near 50% and fluctuates based on scoring events, ultimately reaching 100% or 0% at game end. The area above and below the 50% baseline is filled with team colors to convey momentum at a glance. This visualization is widely used across major sports for post-game analysis and live broadcasting.
""" anyplot.ai
line-win-probability: Win Probability Chart
Library: pygal 3.1.3 | Python 3.13.14
Quality: 84/100 | Updated: 2026-06-21
"""

import os

import numpy as np
import pygal
from pygal.style import Style


# Theme tokens — Imprint palette
THEME = os.getenv("ANYPLOT_THEME", "light")
PAGE_BG = "#FAF8F1" if THEME == "light" else "#1A1A17"
INK = "#1A1A17" if THEME == "light" else "#F0EFE8"
INK_MUTED = "#6B6A63" if THEME == "light" else "#A8A79F"
# Win prob line: warm near-white in light gives contrast over dark-red Chiefs fill
LINE_COLOR = "#FFFDF6" if THEME == "light" else INK

# Semantic team color assignment from Imprint palette
HOME_COLOR = "#009E73"  # CIN Bengals (home) — Imprint position 1, brand green
AWAY_COLOR = "#AE3030"  # KC Chiefs (away) — Imprint matte red, semantic opponent

# Data — 2022 AFC Championship: CIN Bengals vs KC Chiefs (KC wins 23-20 OT)
np.random.seed(42)

plays = 140  # regulation (0–120) + OT (120–140)

# Key waypoints: (play_number, bengals_win_probability)
waypoints = [
    (0, 0.50),
    (18, 0.38),  # KC FG 3-0
    (33, 0.62),  # CIN TD 7-3
    (50, 0.41),  # KC TD 13-7
    (60, 0.45),  # Halftime
    (72, 0.64),  # CIN TD 14-13
    (95, 0.26),  # KC TD 20-14
    (112, 0.72),  # CIN TD 20-20 tie
    (120, 0.50),  # OT coin flip
    (140, 0.04),  # KC FG wins 23-20
]

scoring_events = {
    18: "KC FG 3-0",
    33: "CIN TD 7-3",
    50: "KC TD 13-7",
    72: "CIN TD 14-13",
    95: "KC TD 20-14",
    112: "CIN TD 20-20",
    140: "KC FG 23-20",
}

# Smooth S-curve interpolation between waypoints
bengals_wp = np.zeros(plays + 1)
for i in range(len(waypoints) - 1):
    p1, v1 = waypoints[i]
    p2, v2 = waypoints[i + 1]
    n_seg = p2 - p1
    t = np.linspace(0, 1, n_seg, endpoint=False)
    interp = v1 + (v2 - v1) * (3 * t**2 - 2 * t**3)
    noise = np.random.normal(0, 0.012, n_seg) * (1 - 0.6 * t)
    bengals_wp[p1:p2] = np.clip(interp + noise, 0.02, 0.98)
bengals_wp[plays] = 0.04

# Snap exact values at scoring events
for play, _ in scoring_events.items():
    for p, v in waypoints:
        if p == play:
            bengals_wp[play] = v

bengals_wp_pct = [round(float(p) * 100, 1) for p in bengals_wp]
# Chiefs win probability = complement; fills red from bottom up over green background
chiefs_wp_pct = [round(100.0 - p, 1) for p in bengals_wp_pct]

# Title length-scaled font size (pygal default 66 for ~67-char baseline)
title = "Bengals vs Chiefs (20-23 OT) · line-win-probability · python · pygal · anyplot.ai"
title_font_size = max(44, round(66 * 67 / len(title)))

custom_style = Style(
    background=PAGE_BG,
    plot_background=PAGE_BG,
    foreground=INK,
    foreground_strong=INK,
    foreground_subtle=INK_MUTED,
    # Series order: Bengals green, Chiefs red, win-prob line (high-contrast neutral), baseline ochre, events cyan
    colors=(HOME_COLOR, AWAY_COLOR, LINE_COLOR, "#BD8233", "#2ABCCD", "#C475FD"),
    font_family="DejaVu Sans, Helvetica, Arial, sans-serif",
    title_font_family="DejaVu Sans, Helvetica, Arial, sans-serif",
    title_font_size=title_font_size,
    label_font_size=46,
    major_label_font_size=40,
    value_font_size=36,
    legend_font_size=44,
    legend_font_family="DejaVu Sans, Helvetica, Arial, sans-serif",
    label_font_family="DejaVu Sans, Helvetica, Arial, sans-serif",
    major_label_font_family="DejaVu Sans, Helvetica, Arial, sans-serif",
    value_font_family="DejaVu Sans, Helvetica, Arial, sans-serif",
    opacity=0.88,
    opacity_hover=0.95,
    guide_stroke_color=INK_MUTED,
    guide_stroke_dasharray="3,3",
    stroke_opacity=1.0,
    stroke_opacity_hover=1.0,
    tooltip_font_size=36,
    tooltip_font_family="DejaVu Sans, Helvetica, Arial, sans-serif",
    tooltip_border_radius=8,
)

chart = pygal.Line(
    width=3200,
    height=1800,
    title=title,
    x_title="Game Progression (Play Number)",
    y_title="Win Probability (%)",
    style=custom_style,
    fill=False,
    show_dots=False,
    stroke_style={"width": 3},
    show_y_guides=True,
    show_x_guides=False,
    show_legend=True,
    legend_at_bottom=True,
    legend_box_size=28,
    value_formatter=lambda x: f"{x:.0f}%",
    range=(0, 100),
    min_scale=5,
    max_scale=10,
    margin_bottom=200,
    margin_left=80,
    margin_right=90,
    margin_top=50,
    spacing=10,
    tooltip_border_radius=8,
    tooltip_fancy_mode=True,
    x_label_rotation=45,
    show_minor_x_labels=False,
)

# Series 1: Bengals home background — fills entire 0-100% in green (#009E73, first Imprint color)
chart.add("CIN Bengals", [100.0] * (plays + 1), fill=True, show_dots=False, stroke_style={"width": 0})

# Series 2: Chiefs away overlay — fills 0-to-chiefs_wp in red, layered over green below
# Both halves now vary dynamically: more red when Chiefs lead, more green when Bengals lead
chart.add("KC Chiefs", chiefs_wp_pct, fill=True, show_dots=False, stroke_style={"width": 0})

# Series 3: Win probability line — INK (theme-adaptive), contrasts against both fills
# Hidden from legend (None title); stroke_style width overrides chart default
chart.add(None, bengals_wp_pct, fill=False, show_dots=False, stroke_style={"width": 7})

# Series 4: 50% baseline reference
chart.add("50% Line", [50.0] * (plays + 1), fill=False, show_dots=False, stroke_style={"width": 8, "dasharray": "18,7"})

# Series 5: Scoring event markers — dots at event plays with tooltip labels
event_series = [None] * (plays + 1)
for idx, label in scoring_events.items():
    event_series[idx] = {"value": bengals_wp_pct[idx], "label": label}
chart.add("Key Events", event_series, fill=False, show_dots=True, dots_size=20, stroke=False)

# X-axis: period markers combined with scoring event labels for static PNG annotation
# Drop Q2/Q4 to avoid crowding with nearby scoring events at plays 33 and 95
label_map = {
    0: "Kickoff",
    18: "KC FG 3-0",
    33: "CIN TD 7-3",
    50: "KC TD 13-7",
    60: "Halftime",
    72: "CIN TD 14-13",
    95: "KC TD 20-14",
    112: "CIN TD 20-20",
    140: "KC FG 23-20",
}
chart.x_labels = [label_map.get(i, "") for i in range(plays + 1)]
chart.x_labels_major = [label_map[k] for k in sorted(label_map.keys())]
chart.truncate_label = -1

# Save
chart.render_to_file(f"plot-{THEME}.html")
chart.render_to_png(f"plot-{THEME}.png")
Runnable source as JSON, for any HTTP client: https://api.anyplot.ai/specs/line-win-probability/pygal/code. Any spec id and library id listed in llms-full.txt fit the same URL shape; every URL below is complete and callable.
{
  "spec_id": "line-win-probability",
  "language": "python",
  "library": "pygal",
  "page": "https://anyplot.ai/line-win-probability/python/pygal",
  "hub": "https://anyplot.ai/line-win-probability",
  "code_json": "https://api.anyplot.ai/specs/line-win-probability/pygal/code",
  "spec_json": "https://api.anyplot.ai/specs/line-win-probability",
  "render_light_png": "https://storage.googleapis.com/anyplot-images/plots/line-win-probability/python/pygal/plot-light.png",
  "render_dark_png": "https://storage.googleapis.com/anyplot-images/plots/line-win-probability/python/pygal/plot-dark.png",
  "interactive_light_html": "https://storage.googleapis.com/anyplot-images/plots/line-win-probability/python/pygal/plot-light.html",
  "interactive_dark_html": "https://storage.googleapis.com/anyplot-images/plots/line-win-probability/python/pygal/plot-dark.html",
  "quality_score": 84.0,
  "license": "MIT",
  "guide": "https://anyplot.ai/llms.txt"
}
Part of Win Probability Chart on anyplot.ai.