The same plot in 14 other libraries — JavaScript: Chart.js, D3.js, Apache ECharts, Highcharts; Python: Altair, Bokeh, lets-plot, Matplotlib, Plotly, plotnine, Pygal, Seaborn; R: ggplot2; Julia: Makie.jl. Compare all 15 side by side: Win Probability Chart in Python, R, Julia and JavaScript.
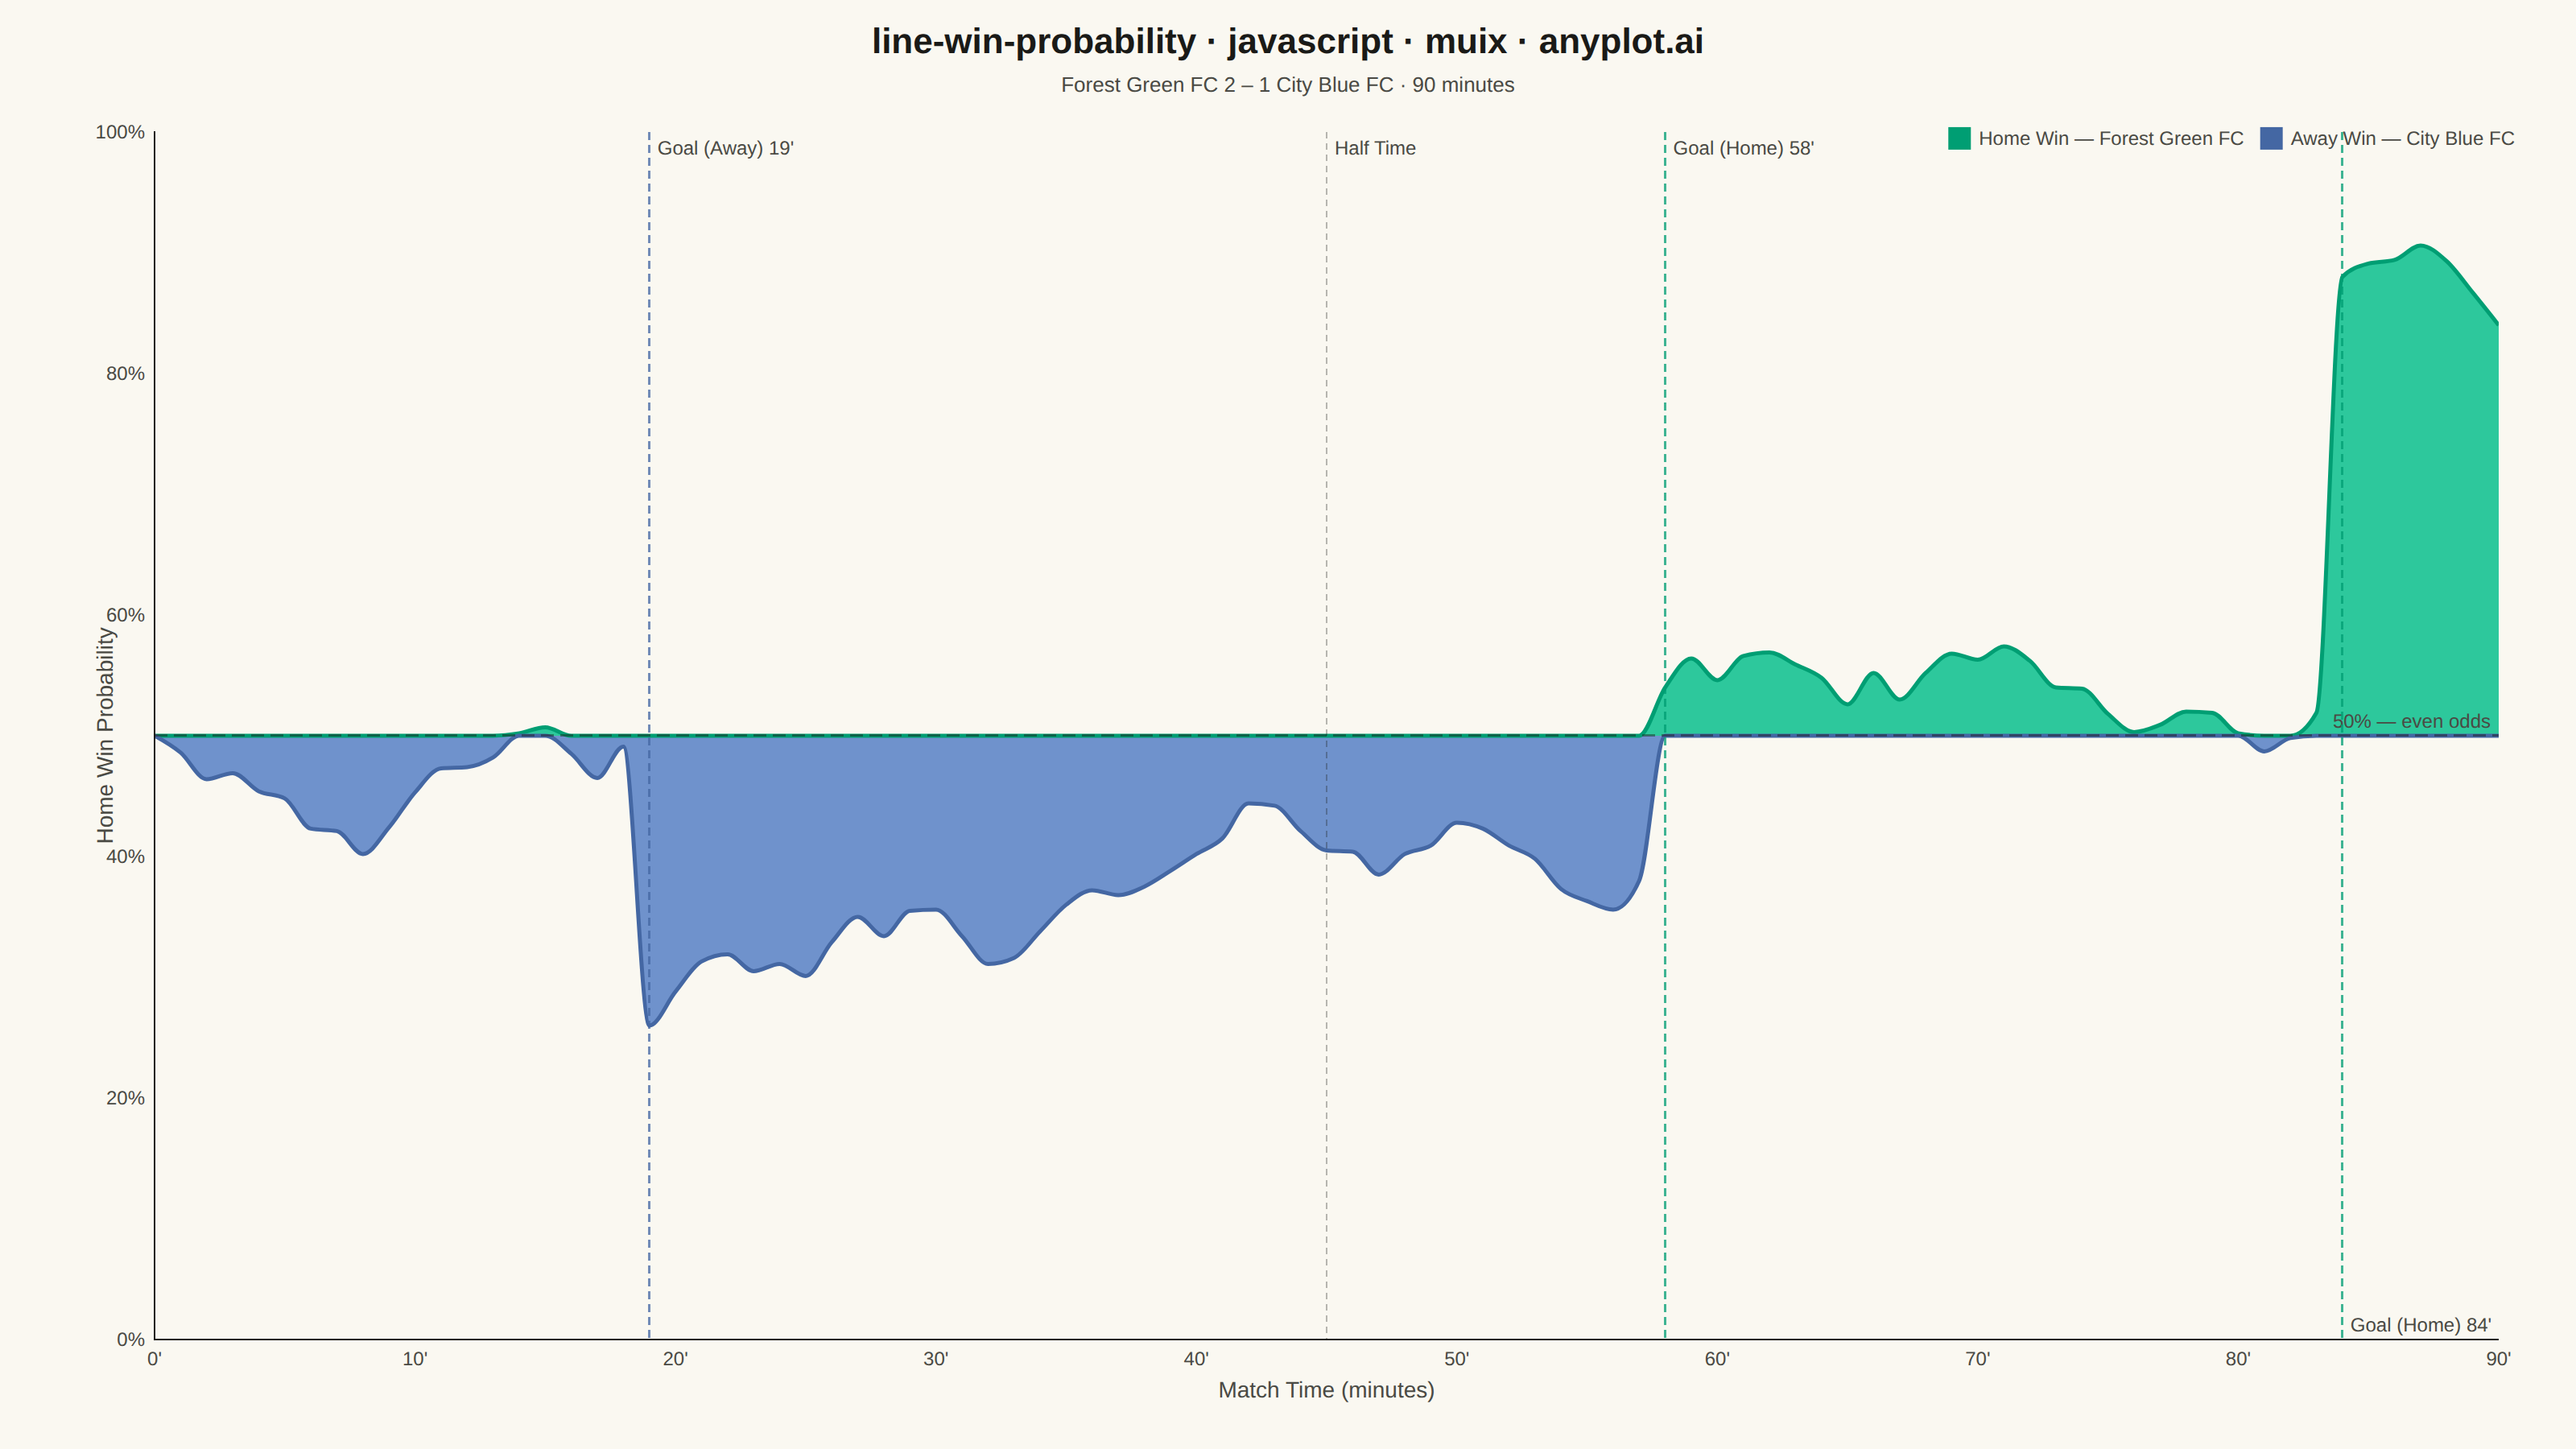
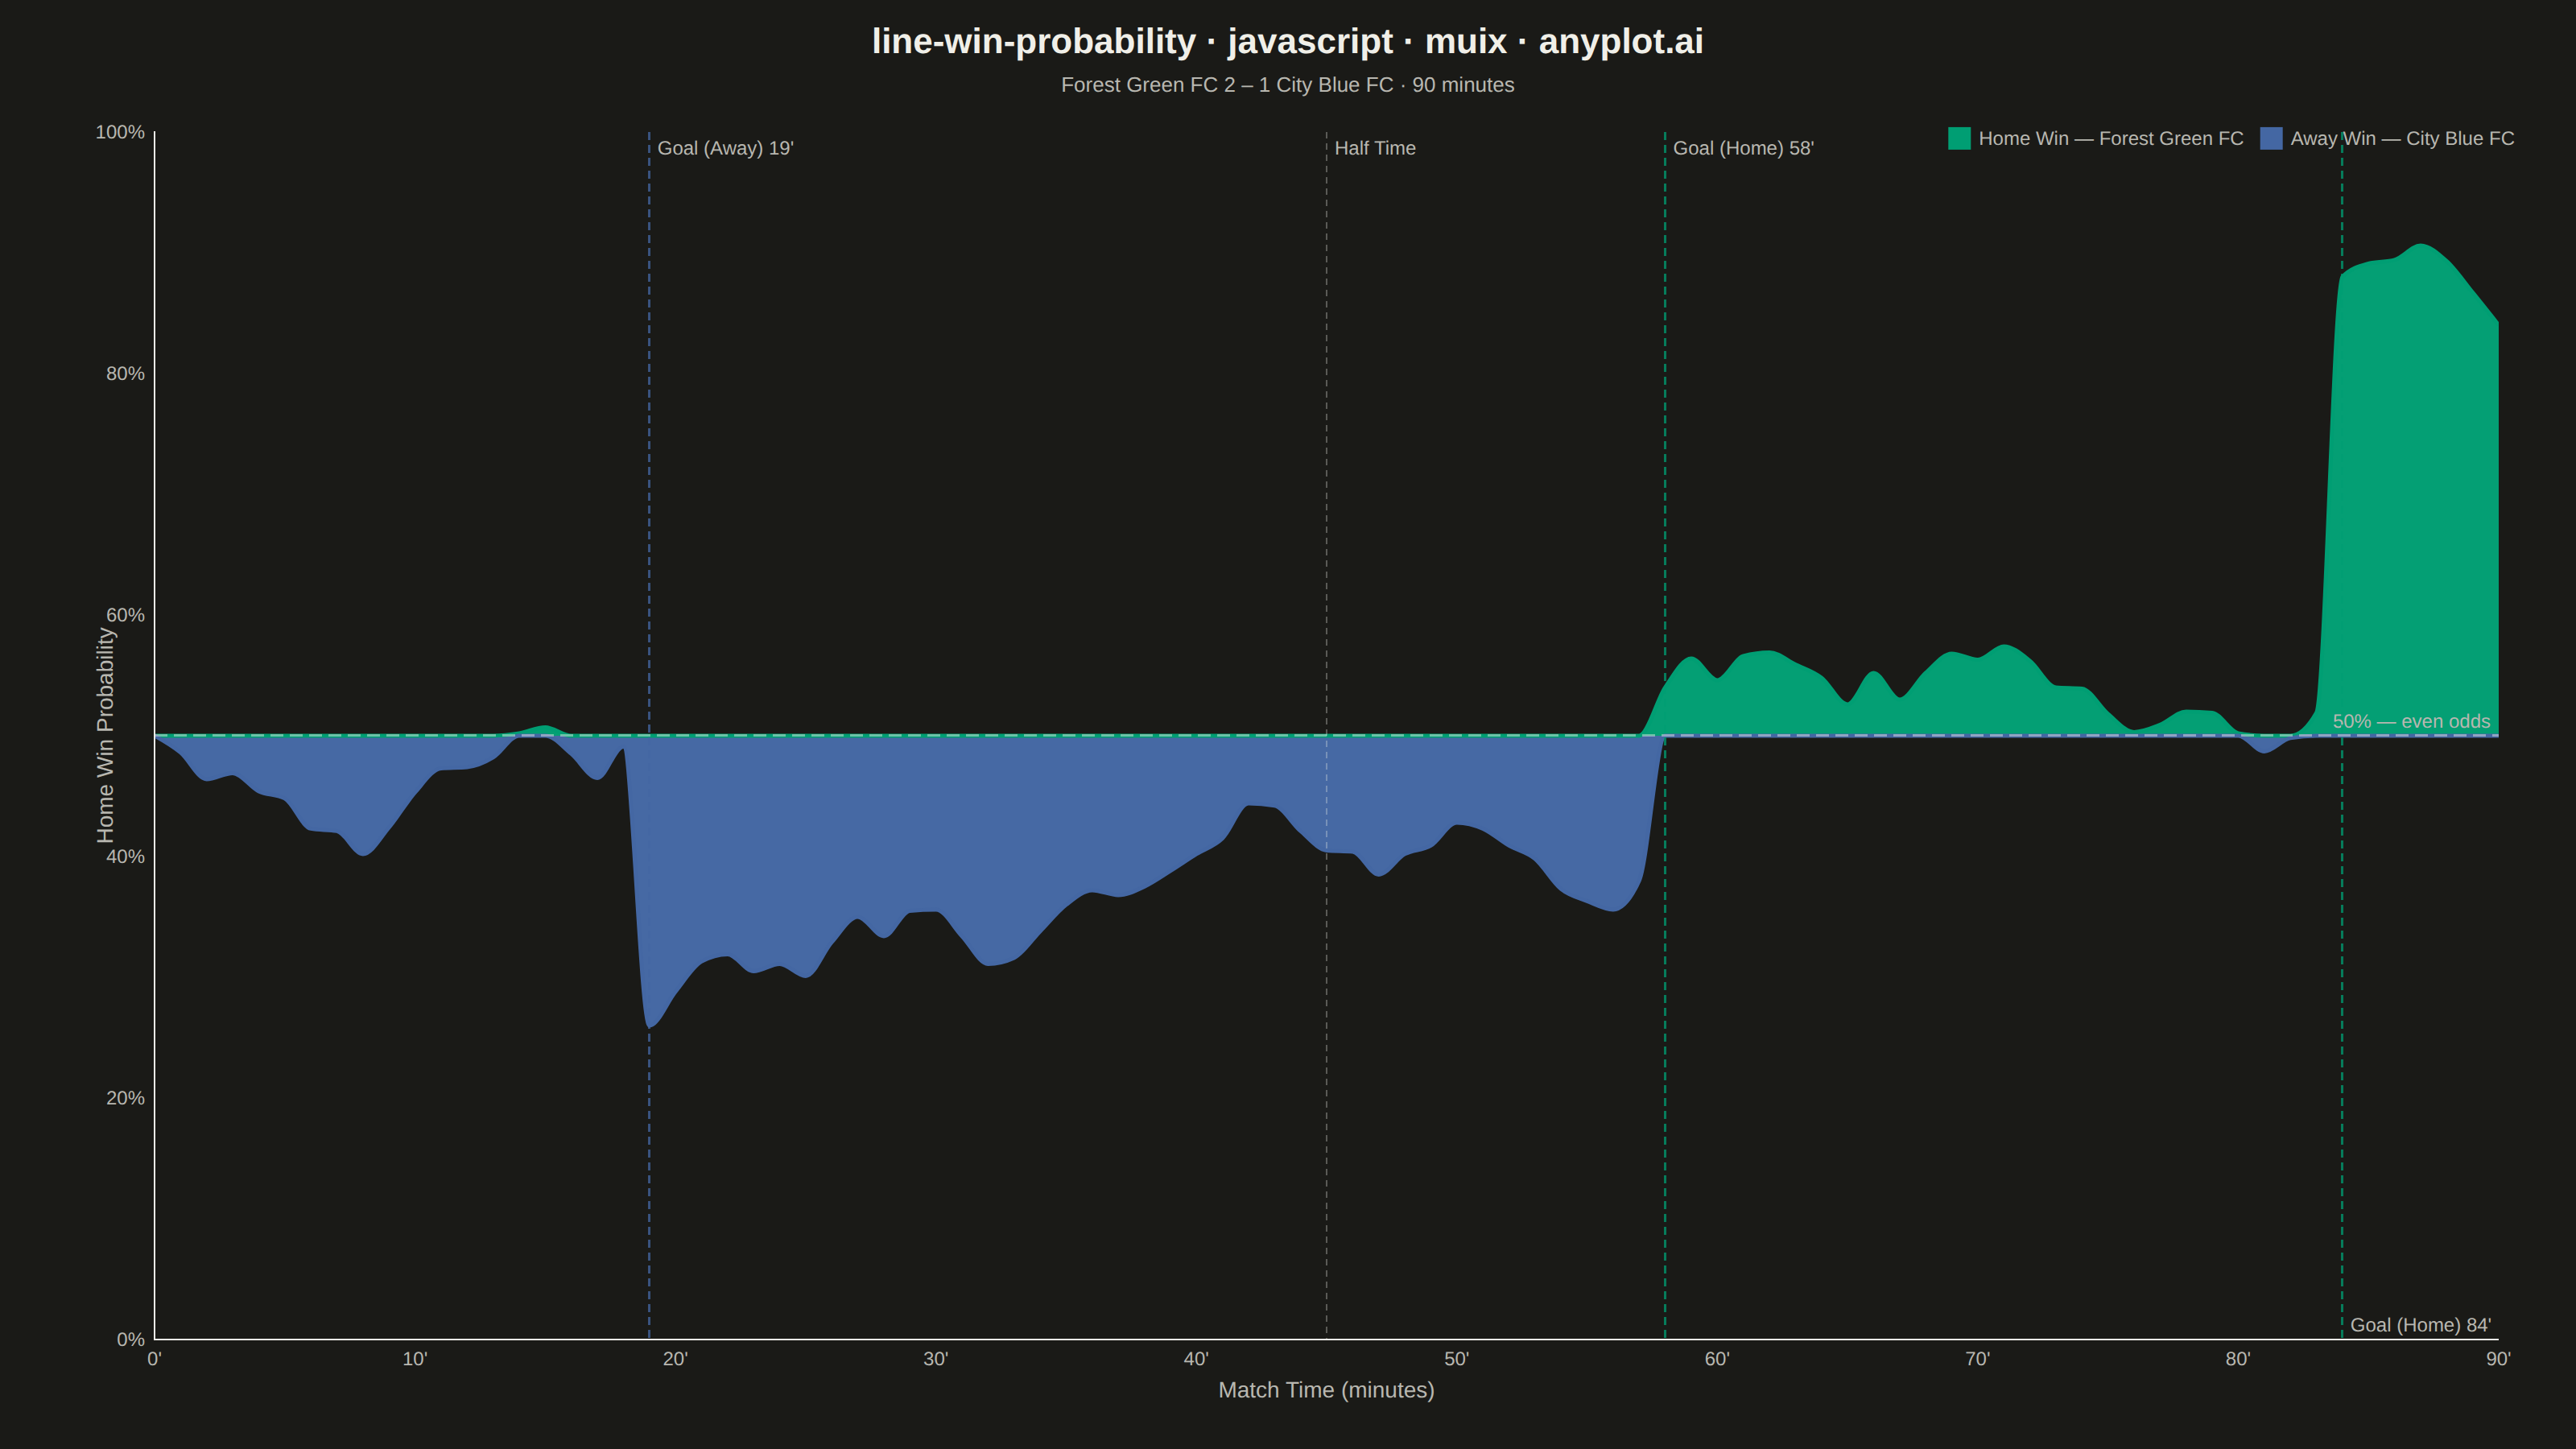
A win probability chart shows how each team's likelihood of winning evolves over the course of a game. The line starts near 50% and fluctuates based on scoring events, ultimately reaching 100% or 0% at game end. The area above and below the 50% baseline is filled with team colors to convey momentum at a glance. This visualization is widely used across major sports for post-game analysis and live broadcasting.
// anyplot.ai
// line-win-probability: Win Probability Chart
// Library: muix 7.29.1 | JavaScript 22.22.3
// Quality: 92/100 | Created: 2026-06-21
//# anyplot-orientation: landscape
// anyplot.ai
// line-win-probability: Win Probability Chart
// Library: MUI X Charts | React | Node 22
// License: @mui/x-charts — MIT (community). Pro/Premium are out of scope.
// Quality: pending | Created: 2026-06-21

import { LineChart } from "@mui/x-charts/LineChart";
import { ChartsReferenceLine } from "@mui/x-charts/ChartsReferenceLine";
import Box from "@mui/material/Box";
import Typography from "@mui/material/Typography";

const t = window.ANYPLOT_TOKENS;

// Deterministic LCG — no Math.random(), fully reproducible
function lcg(seed: number): () => number {
  let s = seed | 0;
  return () => {
    s = (Math.imul(1664525, s) + 1013904223) | 0;
    return (s >>> 0) / 0x100000000;
  };
}

function clamp(v: number, lo: number, hi: number): number {
  return Math.max(lo, Math.min(hi, v));
}

const rand = lcg(42);
const TOTAL_MINUTES = 90;

const AWAY_GOAL = 19;
const HALF_TIME = 45;
const HOME_GOAL_EQ = 58;
const HOME_GOAL_WIN = 84;

// Forest Green FC (home) vs City Blue FC (away) — away scores early, home fights back
const minutes: number[] = Array.from({ length: TOTAL_MINUTES + 1 }, (_, i) => i);

let wp = 0.50;
const winProb: number[] = [0.50];

for (let i = 1; i <= TOTAL_MINUTES; i++) {
  if (i === AWAY_GOAL) {
    wp = 0.26;
  } else if (i === HOME_GOAL_EQ) {
    wp = 0.54;
  } else if (i === HOME_GOAL_WIN) {
    wp = 0.88;
  } else {
    const noise = (rand() - 0.5) * 0.055;
    const revert = (0.5 - wp) * 0.018;
    wp = clamp(wp + noise + revert, 0.05, 0.95);
    if (i > AWAY_GOAL && i < HOME_GOAL_EQ) {
      wp = clamp(wp, 0.11, 0.50);
    } else if (i > HOME_GOAL_EQ && i < HOME_GOAL_WIN) {
      wp = clamp(wp, 0.42, 0.67);
    } else if (i > HOME_GOAL_WIN) {
      wp = clamp(wp, 0.81, 0.97);
    }
  }
  winProb.push(Math.round(wp * 1000) / 1000);
}

// Spec fill semantics: fill area above 50% with home color, below 50% with away color.
// baseline=0.5 makes each series fill only the band between the probability line and
// the 50% baseline — home green fills upward from 50% when home leads, away blue
// fills downward from 50% when away leads.
const homeArea: number[] = winProb.map(v => Math.max(v, 0.5));
const awayArea: number[] = winProb.map(v => Math.min(v, 0.5));

const HOME_COLOR = t.palette[0]; // #009E73 brand green
const AWAY_COLOR = t.palette[2]; // #4467A3 Imprint blue — semantic match for "City Blue FC"

const TITLE = "line-win-probability · javascript · muix · anyplot.ai";
const SUBTITLE = "Forest Green FC 2 – 1 City Blue FC · 90 minutes";
const TITLE_HEIGHT = 70;

export default function Chart() {
  const { width, height } = window.ANYPLOT_SIZE;
  const chartHeight = height - TITLE_HEIGHT;

  return (
    <Box
      sx={{
        width,
        height,
        display: "flex",
        flexDirection: "column",
        bgcolor: t.pageBg,
      }}
    >
      <Box sx={{ textAlign: "center", pt: 1.5 }}>
        <Typography
          sx={{ fontSize: 22, fontWeight: 600, color: t.ink, lineHeight: 1.3 }}
        >
          {TITLE}
        </Typography>
        <Typography sx={{ fontSize: 13, color: t.inkSoft, mt: 0.25 }}>
          {SUBTITLE}
        </Typography>
      </Box>

      <LineChart
        width={width}
        height={chartHeight}
        skipAnimation
        xAxis={[
          {
            data: minutes,
            label: "Match Time (minutes)",
            min: 0,
            max: 90,
            tickNumber: 7,
            valueFormatter: (v: number) => `${v}'`,
            labelStyle: { fontSize: 14, fill: t.inkSoft },
            tickLabelStyle: { fontSize: 12, fill: t.inkSoft },
            disableTicks: true,
          },
        ]}
        yAxis={[
          {
            min: 0,
            max: 1,
            tickNumber: 5,
            valueFormatter: (v: number) => `${Math.round(v * 100)}%`,
            label: "Home Win Probability",
            labelStyle: { fontSize: 14, fill: t.inkSoft },
            tickLabelStyle: { fontSize: 12, fill: t.inkSoft },
            disableTicks: true,
          },
        ]}
        series={[
          {
            id: "home",
            data: homeArea,
            label: "Home Win — Forest Green FC",
            area: true,
            baseline: 0.5,
            showMark: false,
            color: HOME_COLOR,
          },
          {
            id: "away",
            data: awayArea,
            label: "Away Win — City Blue FC",
            area: true,
            baseline: 0.5,
            showMark: false,
            color: AWAY_COLOR,
          },
        ]}
        margin={{ top: 16, bottom: 64, left: 96, right: 48 }}
        sx={{
          bgcolor: "transparent",
          "& .MuiAreaElement-series-home": { fillOpacity: 0.82 },
          "& .MuiAreaElement-series-away": { fillOpacity: 0.82 },
          // Home line traces max(wp, 0.5): probability cursor when home leads
          "& .MuiLineElement-series-home": { strokeWidth: 2.5 },
          // Away line traces min(wp, 0.5): probability cursor when away leads
          "& .MuiLineElement-series-away": { strokeWidth: 2.5 },
        }}
        slotProps={{
          legend: {
            position: { vertical: "top", horizontal: "right" },
            padding: { top: 8, right: 28 },
            itemMarkWidth: 14,
            itemMarkHeight: 14,
            labelStyle: { fontSize: 12, fill: t.inkSoft },
          },
        }}
      >
        {/* 50% neutral baseline */}
        <ChartsReferenceLine
          y={0.5}
          label="50% — even odds"
          labelAlign="end"
          lineStyle={{
            stroke: t.ink,
            strokeWidth: 1.5,
            strokeDasharray: "8 4",
            opacity: 0.45,
          }}
          labelStyle={{ fontSize: 12, fill: t.inkSoft }}
        />

        {/* Away goal — probability falls */}
        <ChartsReferenceLine
          x={AWAY_GOAL}
          label={`Goal (Away) ${AWAY_GOAL}'`}
          labelAlign="start"
          lineStyle={{
            stroke: AWAY_COLOR,
            strokeWidth: 1.5,
            strokeDasharray: "5 3",
            opacity: 0.75,
          }}
          labelStyle={{ fontSize: 12, fill: t.inkSoft }}
        />

        {/* Half time */}
        <ChartsReferenceLine
          x={HALF_TIME}
          label="Half Time"
          labelAlign="start"
          lineStyle={{
            stroke: t.ink,
            strokeWidth: 1,
            strokeDasharray: "4 3",
            opacity: 0.3,
          }}
          labelStyle={{ fontSize: 12, fill: t.inkSoft }}
        />

        {/* Home equaliser */}
        <ChartsReferenceLine
          x={HOME_GOAL_EQ}
          label={`Goal (Home) ${HOME_GOAL_EQ}'`}
          labelAlign="start"
          lineStyle={{
            stroke: HOME_COLOR,
            strokeWidth: 1.5,
            strokeDasharray: "5 3",
            opacity: 0.75,
          }}
          labelStyle={{ fontSize: 12, fill: t.inkSoft }}
        />

        {/* Home winner */}
        <ChartsReferenceLine
          x={HOME_GOAL_WIN}
          label={`Goal (Home) ${HOME_GOAL_WIN}'`}
          labelAlign="end"
          lineStyle={{
            stroke: HOME_COLOR,
            strokeWidth: 1.5,
            strokeDasharray: "5 3",
            opacity: 0.75,
          }}
          labelStyle={{ fontSize: 12, fill: t.inkSoft }}
        />
      </LineChart>
    </Box>
  );
}
Runnable source as JSON, for any HTTP client: https://api.anyplot.ai/specs/line-win-probability/muix/code. Any spec id and library id listed in llms-full.txt fit the same URL shape; every URL below is complete and callable.
{
  "spec_id": "line-win-probability",
  "language": "javascript",
  "library": "muix",
  "page": "https://anyplot.ai/line-win-probability/javascript/muix",
  "hub": "https://anyplot.ai/line-win-probability",
  "code_json": "https://api.anyplot.ai/specs/line-win-probability/muix/code",
  "spec_json": "https://api.anyplot.ai/specs/line-win-probability",
  "render_light_png": "https://storage.googleapis.com/anyplot-images/plots/line-win-probability/javascript/muix/plot-light.png",
  "render_dark_png": "https://storage.googleapis.com/anyplot-images/plots/line-win-probability/javascript/muix/plot-dark.png",
  "interactive_light_html": "https://storage.googleapis.com/anyplot-images/plots/line-win-probability/javascript/muix/plot-light.html",
  "interactive_dark_html": "https://storage.googleapis.com/anyplot-images/plots/line-win-probability/javascript/muix/plot-dark.html",
  "quality_score": 92.0,
  "license": "MIT",
  "guide": "https://anyplot.ai/llms.txt"
}
Part of Win Probability Chart on anyplot.ai.