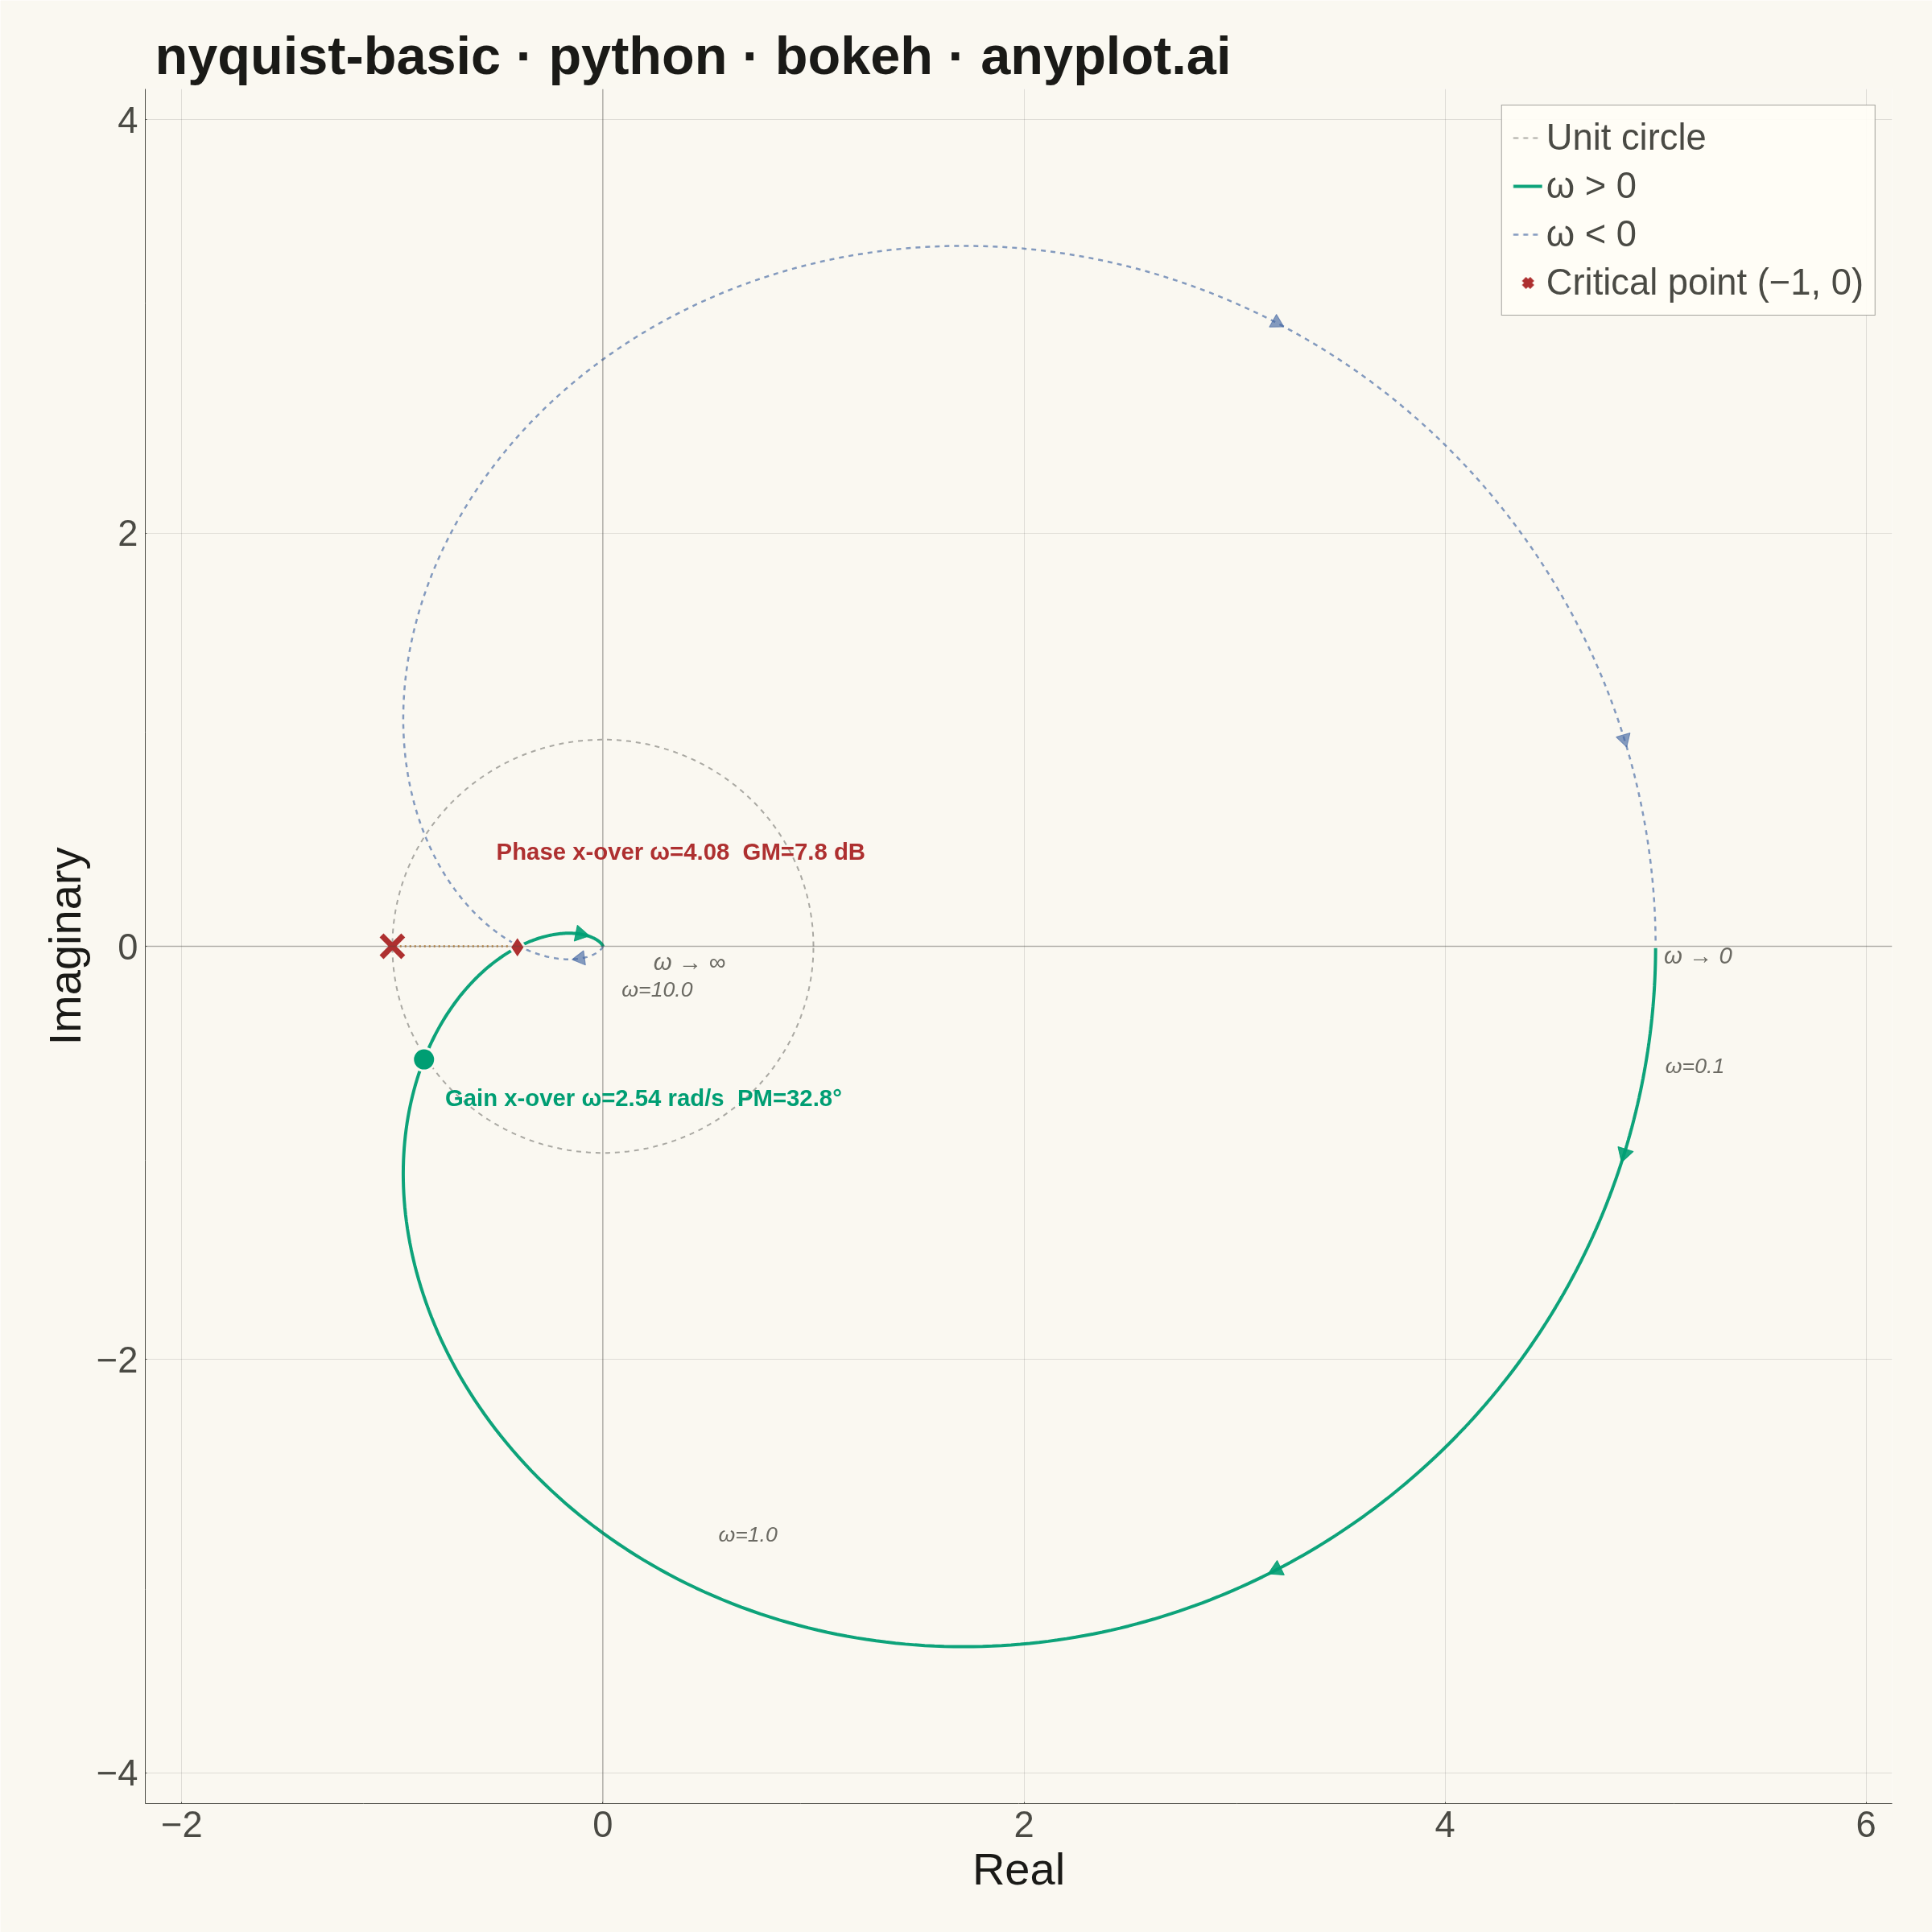
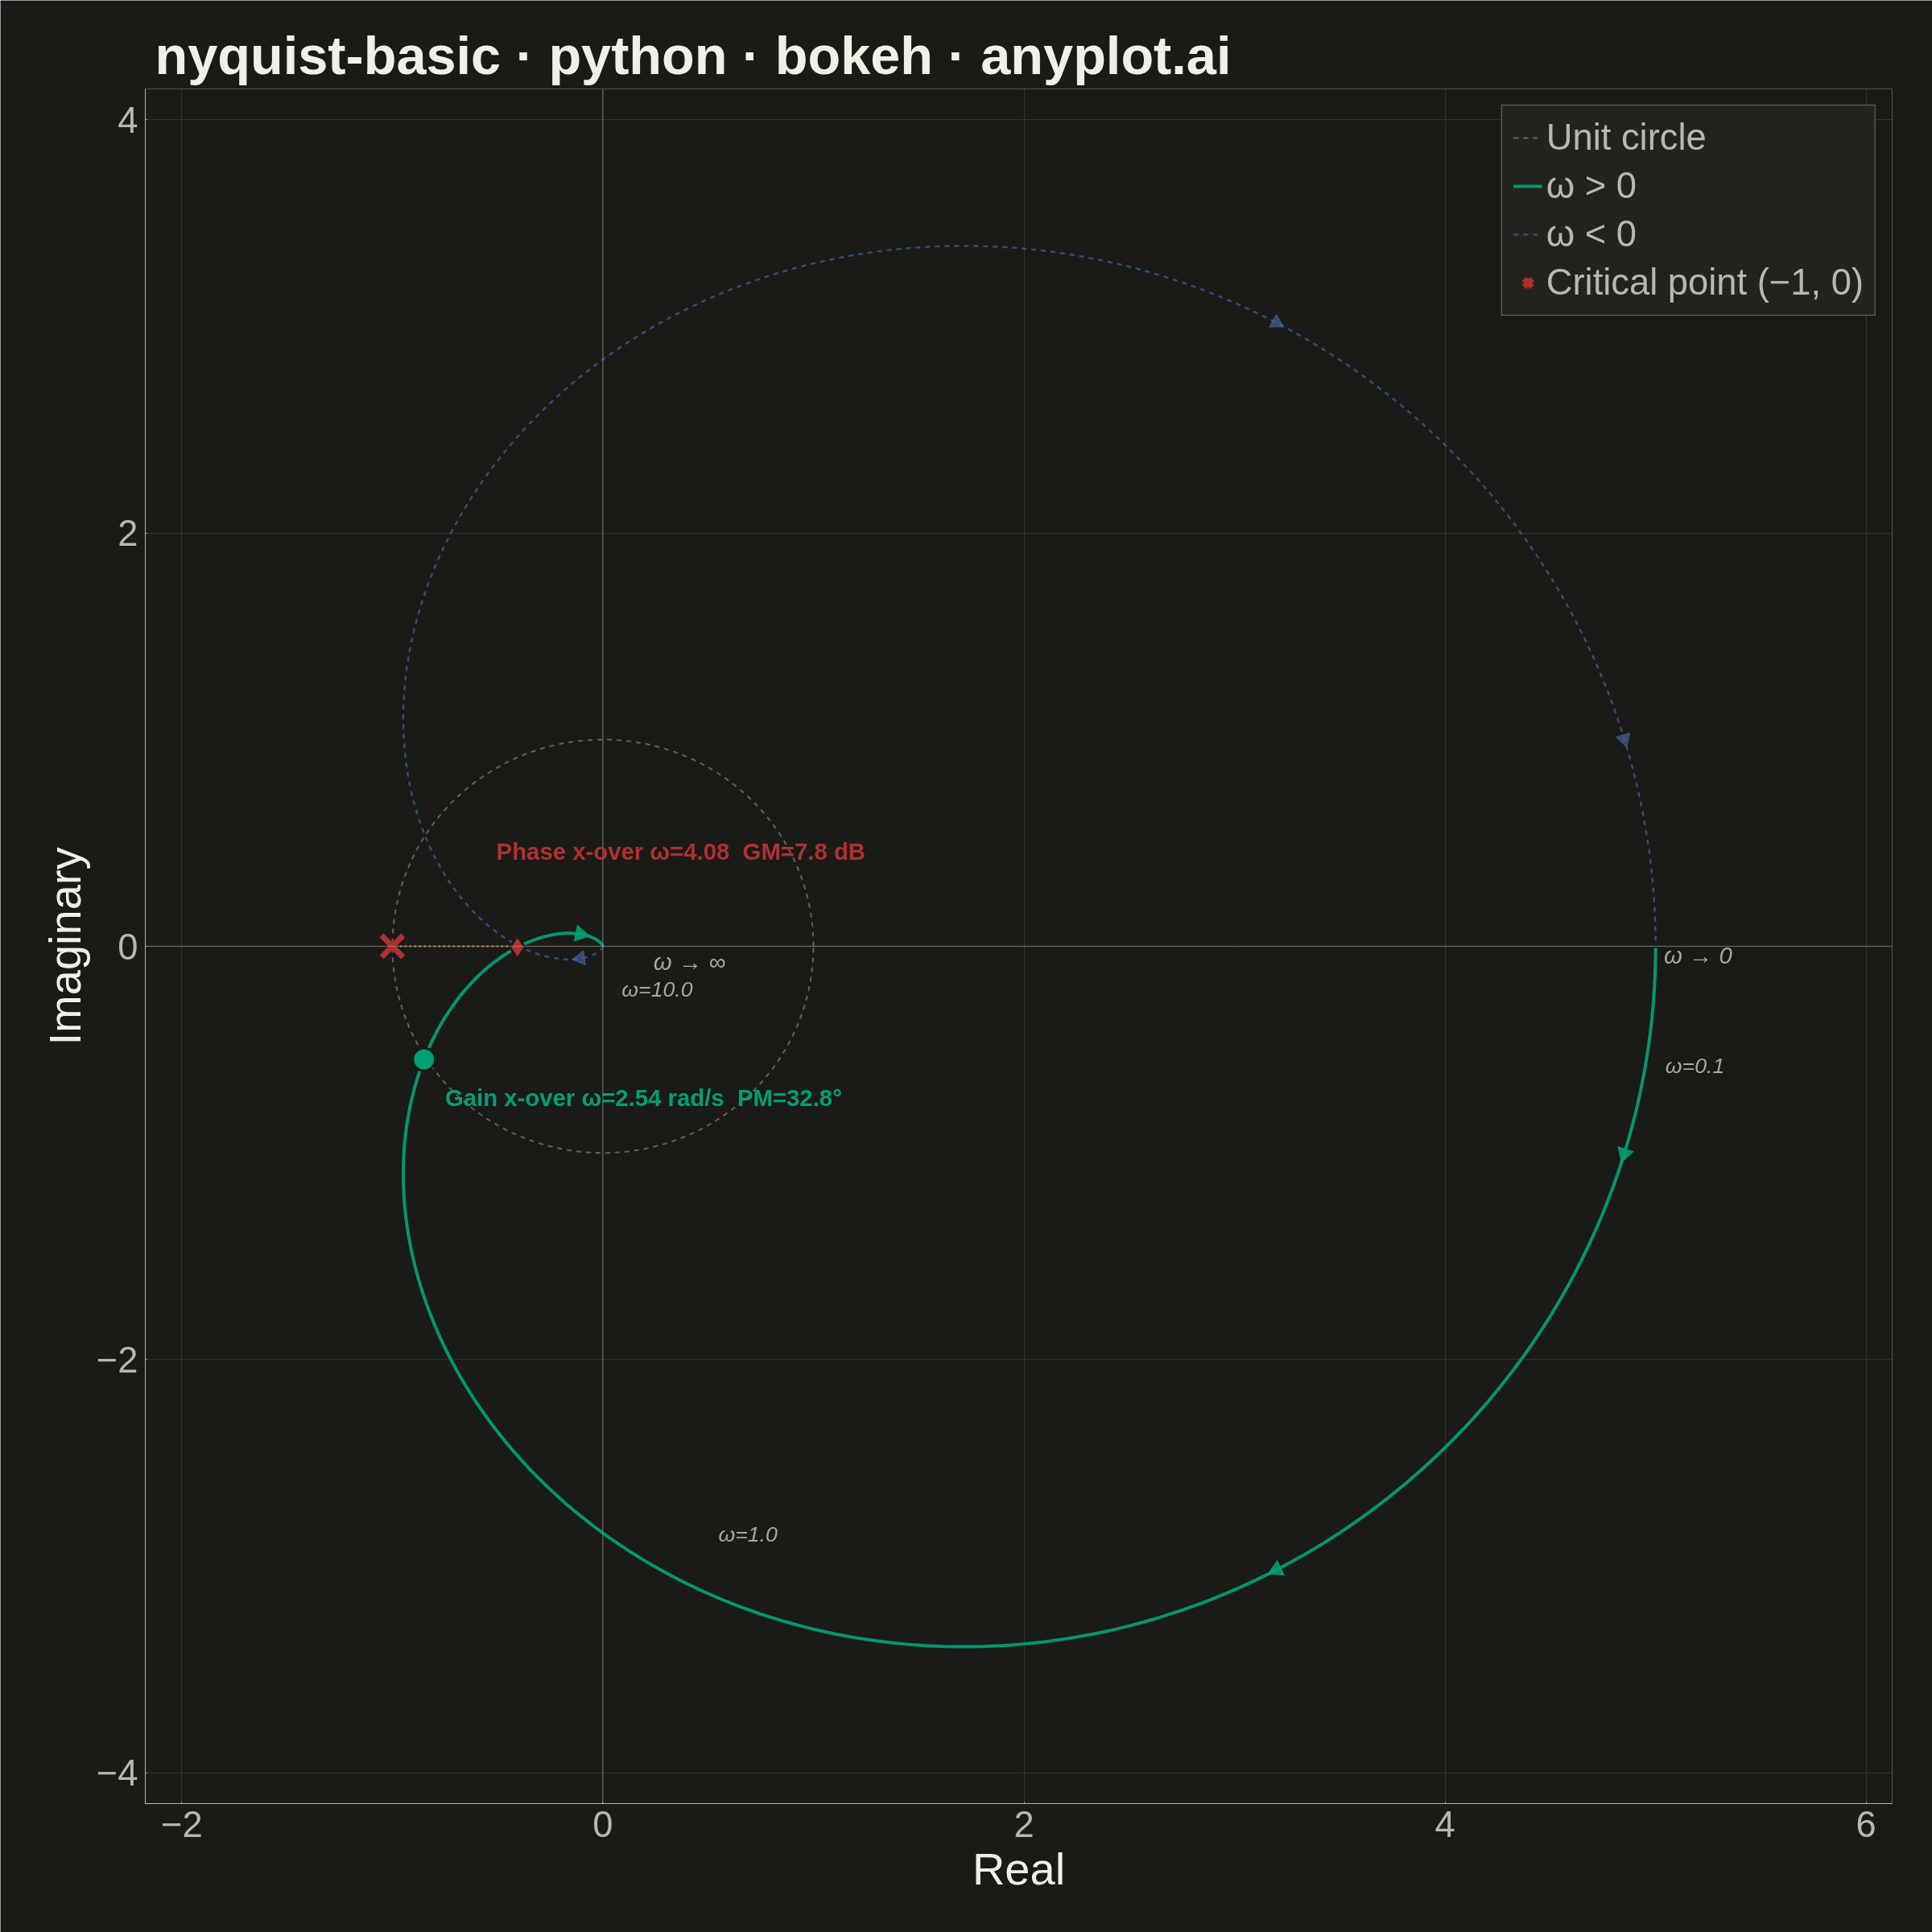
A Nyquist plot maps a system's open-loop frequency response onto the complex plane by plotting the imaginary part against the real part of the transfer function as frequency varies from zero to infinity. It is the primary tool for applying the Nyquist stability criterion to determine whether a closed-loop control system is stable. The plot visually reveals gain and phase margins and is widely used in classical control theory and electronic circuit design.
""" anyplot.ai
nyquist-basic: Nyquist Plot for Control Systems
Library: bokeh 3.9.1 | Python 3.13.13
Quality: 88/100 | Updated: 2026-06-17
"""

# Remove the script's own directory from sys.path so that `import bokeh` resolves
# to the installed package rather than this file (which shares the name "bokeh.py").
import os as _os
import sys as _sys


_here = _os.path.dirname(_os.path.abspath(__file__))
_sys.path = [p for p in _sys.path if not p or _os.path.abspath(p) != _here]
del _sys, _os, _here

import os
import time
from pathlib import Path

import numpy as np
from bokeh.io import output_file, save
from bokeh.models import ColumnDataSource, HoverTool, Label, Range1d, Span
from bokeh.plotting import figure
from selenium import webdriver
from selenium.webdriver.chrome.options import Options


THEME = os.getenv("ANYPLOT_THEME", "light")

# Theme-adaptive chrome tokens (Imprint palette)
PAGE_BG = "#FAF8F1" if THEME == "light" else "#1A1A17"
ELEVATED_BG = "#FFFDF6" if THEME == "light" else "#242420"
INK = "#1A1A17" if THEME == "light" else "#F0EFE8"
INK_SOFT = "#4A4A44" if THEME == "light" else "#B8B7B0"
INK_MUTED = "#6B6A63" if THEME == "light" else "#A8A79F"

# Imprint categorical palette — canonical order, theme-independent
IMPRINT = ["#009E73", "#C475FD", "#4467A3", "#BD8233", "#AE3030", "#2ABCCD", "#954477", "#99B314"]

COLOR_POS = IMPRINT[0]  # brand green — positive frequency arc (first series)
COLOR_NEG = IMPRINT[2]  # blue — negative frequency mirror arc
COLOR_CRITICAL = IMPRINT[4]  # matte red — critical point (-1, 0), semantic danger anchor
COLOR_GM_LINE = IMPRINT[3]  # ochre — gain margin reference segment

# ── Data ─────────────────────────────────────────────────────────────────────
# Transfer function: G(s) = 50 / ((s+1)(s+2)(s+5)) — third-order stable system
poles = np.array([-1.0, -2.0, -5.0])
gain_k = 50.0

freq = np.concatenate(
    [np.logspace(-3, -1, 100), np.logspace(-1, 0.5, 300), np.logspace(0.5, 1.5, 200), np.logspace(1.5, 3, 100)]
)

jw = 1j * freq
G = gain_k / np.prod(np.array([jw - p for p in poles]), axis=0)
real_part = G.real
imag_part = G.imag

# Conjugate-symmetric mirror for negative frequencies
real_mirror = real_part[::-1]
imag_mirror = -imag_part[::-1]

magnitude = np.abs(G)
phase_deg = np.degrees(np.arctan2(imag_part, real_part))

# Gain crossover: |G(jω)| = 1
gain_cross_idx = None
for i in range(len(magnitude) - 1):
    if (magnitude[i] - 1) * (magnitude[i + 1] - 1) < 0:
        gain_cross_idx = i
        break

# Phase crossover: Im(G) = 0 with Re(G) < 0
phase_cross_idx = None
for i in range(1, len(imag_part) - 1):
    if imag_part[i] * imag_part[i + 1] < 0 and real_part[i] < 0:
        phase_cross_idx = i
        break

gain_margin_db = None
phase_margin_deg = None
if phase_cross_idx is not None:
    gain_margin_db = 20 * np.log10(-1.0 / real_part[phase_cross_idx])
if gain_cross_idx is not None:
    phase_margin_deg = 180 + phase_deg[gain_cross_idx]

source_pos = ColumnDataSource(
    data={"real": real_part, "imag": imag_part, "freq": freq, "mag": magnitude, "phase": phase_deg}
)
source_neg = ColumnDataSource(data={"real": real_mirror, "imag": imag_mirror})

theta = np.linspace(0, 2 * np.pi, 200)
unit_x = np.cos(theta).tolist()
unit_y = np.sin(theta).tolist()

# ── Canvas ────────────────────────────────────────────────────────────────────
# Square 2400×2400: spec requires 1:1 aspect ratio so the unit circle is circular.
# Equal x/y data extents (same span) on a square canvas gives 1:1 pixel scaling
# without match_aspect=True (which causes Bokeh to shrink the rendered height).
W, H = 2400, 2400

x_lo_raw = min(real_part.min(), -1.5) * 1.2
x_hi_raw = max(real_part.max(), 1.0) * 1.15
y_ext = max(abs(imag_part).max(), 1.2) * 1.2

# Force equal data extents so 1 unit on x == 1 unit on y (circle appears circular)
span = max(x_hi_raw - x_lo_raw, 2 * y_ext) * 1.02
x_center = (x_lo_raw + x_hi_raw) / 2
x_lo = x_center - span / 2
x_hi = x_center + span / 2
y_lo = -span / 2
y_hi = span / 2

p = figure(
    width=W,
    height=H,
    title="nyquist-basic · python · bokeh · anyplot.ai",
    x_axis_label="Real",
    y_axis_label="Imaginary",
    x_range=Range1d(x_lo, x_hi),
    y_range=Range1d(y_lo, y_hi),
    toolbar_location=None,  # prevents toolbar from adding height to the PNG
    min_border_bottom=160,
    min_border_left=180,
    min_border_top=110,
    min_border_right=50,
)

# ── Reference elements ────────────────────────────────────────────────────────
p.line(
    unit_x, unit_y, line_color=INK_SOFT, line_width=2, line_dash="dashed", line_alpha=0.45, legend_label="Unit circle"
)

p.add_layout(Span(location=0, dimension="width", line_color=INK_SOFT, line_width=1.5, line_alpha=0.35))
p.add_layout(Span(location=0, dimension="height", line_color=INK_SOFT, line_width=1.5, line_alpha=0.35))

if phase_cross_idx is not None:
    p.line(
        [real_part[phase_cross_idx], -1.0],
        [0.0, 0.0],
        line_color=COLOR_GM_LINE,
        line_width=3,
        line_dash="dotted",
        line_alpha=0.75,
    )

# ── Nyquist curves ────────────────────────────────────────────────────────────
line_pos = p.line(
    x="real", y="imag", source=source_pos, line_color=COLOR_POS, line_width=4, line_alpha=0.95, legend_label="ω > 0"
)
p.line(
    x="real",
    y="imag",
    source=source_neg,
    line_color=COLOR_NEG,
    line_width=2.5,
    line_dash="dashed",
    line_alpha=0.65,
    legend_label="ω < 0",
)

# ── Critical point (-1, 0) ────────────────────────────────────────────────────
p.scatter([-1], [0], size=38, marker="x", color=COLOR_CRITICAL, line_width=7, legend_label="Critical point (−1, 0)")

# ── Direction arrows — positive frequency arc ─────────────────────────────────
for idx in [len(freq) // 6, len(freq) // 3, len(freq) * 2 // 3]:
    if idx < len(freq) - 5:
        dx = real_part[idx + 5] - real_part[idx]
        dy = imag_part[idx + 5] - imag_part[idx]
        p.scatter(
            [real_part[idx]],
            [imag_part[idx]],
            size=20,
            marker="triangle",
            color=COLOR_POS,
            angle=[np.arctan2(dy, dx) - np.pi / 2],
            alpha=0.9,
        )

# ── Direction arrows — negative frequency mirror arc ──────────────────────────
for idx in [len(freq) // 6, len(freq) // 3, len(freq) * 2 // 3]:
    ridx = len(freq) - 1 - idx
    if ridx > 5 and ridx + 5 < len(real_mirror):
        dx = real_mirror[ridx + 5] - real_mirror[ridx]
        dy = imag_mirror[ridx + 5] - imag_mirror[ridx]
        if abs(dx) + abs(dy) > 1e-8:
            p.scatter(
                [real_mirror[ridx]],
                [imag_mirror[ridx]],
                size=18,
                marker="triangle",
                color=COLOR_NEG,
                angle=[np.arctan2(dy, dx) - np.pi / 2],
                alpha=0.65,
            )

# ── Crossover annotations ─────────────────────────────────────────────────────
if gain_cross_idx is not None:
    gc_freq = freq[gain_cross_idx]
    p.scatter(
        [real_part[gain_cross_idx]],
        [imag_part[gain_cross_idx]],
        size=28,
        marker="circle",
        color=COLOR_POS,
        line_color=PAGE_BG,
        line_width=3,
    )
    pm_text = f"  PM={phase_margin_deg:.1f}°" if phase_margin_deg is not None else ""
    p.add_layout(
        Label(
            x=real_part[gain_cross_idx] + 0.10,
            y=imag_part[gain_cross_idx] - 0.25,
            text=f"Gain x-over ω={gc_freq:.2f} rad/s{pm_text}",
            text_font_size="22pt",
            text_color=COLOR_POS,
            text_font_style="bold",
        )
    )

if phase_cross_idx is not None:
    pc_freq = freq[phase_cross_idx]
    p.scatter(
        [real_part[phase_cross_idx]],
        [imag_part[phase_cross_idx]],
        size=28,
        marker="diamond",
        color=COLOR_CRITICAL,
        line_color=PAGE_BG,
        line_width=3,
    )
    gm_text = f"  GM={gain_margin_db:.1f} dB" if gain_margin_db is not None else ""
    p.add_layout(
        Label(
            x=real_part[phase_cross_idx] - 0.10,
            y=imag_part[phase_cross_idx] + 0.40,
            text=f"Phase x-over ω={pc_freq:.2f}{gm_text}",
            text_font_size="22pt",
            text_color=COLOR_CRITICAL,
            text_font_style="bold",
        )
    )

p.add_layout(
    Label(
        x=real_part[0] + 0.04,
        y=imag_part[0] - 0.10,
        text="ω → 0",
        text_font_size="22pt",
        text_color=INK_MUTED,
        text_font_style="italic",
    )
)
p.add_layout(
    Label(
        x=real_part[-1] + 0.24,
        y=imag_part[-1] - 0.14,
        text="ω → ∞",
        text_font_size="22pt",
        text_color=INK_MUTED,
        text_font_style="italic",
    )
)

# Selected frequency labels at key points on the outer locus
for kf, off_x, off_y in [(0.1, 0.15, 0.20), (1.0, 0.15, 0.18), (10.0, 0.12, -0.30)]:
    idx = int(np.argmin(np.abs(freq - kf)))
    p.add_layout(
        Label(
            x=real_part[idx] + off_x,
            y=imag_part[idx] + off_y,
            text=f"ω={kf}",
            text_font_size="20pt",
            text_color=INK_MUTED,
            text_font_style="italic",
        )
    )

# ── Hover tool ────────────────────────────────────────────────────────────────
p.add_tools(
    HoverTool(
        renderers=[line_pos],
        tooltips=[
            ("ω", "@freq{0.000} rad/s"),
            ("G(jω)", "@real{0.000} + @imag{0.000}j"),
            ("|G(jω)|", "@mag{0.000}"),
            ("Phase", "@phase{0.0}°"),
        ],
        point_policy="snap_to_data",
        mode="mouse",
    )
)

# ── Chrome styling ────────────────────────────────────────────────────────────
p.title.text_font_size = "50pt"
p.title.text_color = INK
p.title.offset = 12

p.xaxis.axis_label_text_font_size = "42pt"
p.yaxis.axis_label_text_font_size = "42pt"
p.xaxis.axis_label_text_color = INK
p.yaxis.axis_label_text_color = INK
p.xaxis.axis_label_text_font_style = "normal"
p.yaxis.axis_label_text_font_style = "normal"

p.xaxis.major_label_text_font_size = "34pt"
p.yaxis.major_label_text_font_size = "34pt"
p.xaxis.major_label_text_color = INK_SOFT
p.yaxis.major_label_text_color = INK_SOFT

p.xaxis.axis_line_color = INK_SOFT
p.yaxis.axis_line_color = INK_SOFT
p.xaxis.major_tick_line_color = INK_SOFT
p.yaxis.major_tick_line_color = INK_SOFT
p.xaxis.minor_tick_line_color = None
p.yaxis.minor_tick_line_color = None
p.xaxis.major_tick_out = 0
p.yaxis.major_tick_out = 0

p.xgrid.grid_line_color = INK
p.ygrid.grid_line_color = INK
p.xgrid.grid_line_alpha = 0.12
p.ygrid.grid_line_alpha = 0.12

p.background_fill_color = PAGE_BG
p.border_fill_color = PAGE_BG
p.outline_line_color = None

p.legend.location = "top_right"
p.legend.label_text_font_size = "34pt"
p.legend.label_text_color = INK_SOFT
p.legend.background_fill_color = ELEVATED_BG
p.legend.background_fill_alpha = 0.92
p.legend.border_line_color = INK_SOFT
p.legend.border_line_width = 1.5
p.legend.glyph_width = 36
p.legend.glyph_height = 36
p.legend.spacing = 8
p.legend.padding = 14
p.legend.margin = 20

# ── Save ──────────────────────────────────────────────────────────────────────
output_file(f"plot-{THEME}.html")
save(p)

# Chrome's viewport is typically ~143 px shorter than the OS window due to browser chrome
# overhead even in headless mode. Add a vertical buffer, then crop the screenshot to the
# exact canvas dimensions so the post-render gate sees the right size.
RENDER_H = H + 300

opts = Options()
for arg in (
    "--headless=new",
    "--no-sandbox",
    "--disable-dev-shm-usage",
    "--disable-gpu",
    f"--window-size={W},{RENDER_H}",
    "--hide-scrollbars",
):
    opts.add_argument(arg)

driver = webdriver.Chrome(options=opts)
driver.set_window_size(W, RENDER_H)
driver.get(f"file://{Path(f'plot-{THEME}.html').resolve()}")
time.sleep(3)
raw_path = f"plot-{THEME}_raw.png"
driver.save_screenshot(raw_path)
driver.quit()

# Crop to exact canvas dimensions
from PIL import Image


img = Image.open(raw_path)
img = img.crop((0, 0, W, H))
img.save(f"plot-{THEME}.png")
Path(raw_path).unlink()
Runnable source as JSON, for any HTTP client: https://api.anyplot.ai/specs/nyquist-basic/bokeh/code. Any spec id and library id listed in llms-full.txt fit the same URL shape; every URL below is complete and callable.
{
  "spec_id": "nyquist-basic",
  "language": "python",
  "library": "bokeh",
  "page": "https://anyplot.ai/nyquist-basic/python/bokeh",
  "hub": "https://anyplot.ai/nyquist-basic",
  "code_json": "https://api.anyplot.ai/specs/nyquist-basic/bokeh/code",
  "spec_json": "https://api.anyplot.ai/specs/nyquist-basic",
  "render_light_png": "https://storage.googleapis.com/anyplot-images/plots/nyquist-basic/python/bokeh/plot-light.png",
  "render_dark_png": "https://storage.googleapis.com/anyplot-images/plots/nyquist-basic/python/bokeh/plot-dark.png",
  "interactive_light_html": "https://storage.googleapis.com/anyplot-images/plots/nyquist-basic/python/bokeh/plot-light.html",
  "interactive_dark_html": "https://storage.googleapis.com/anyplot-images/plots/nyquist-basic/python/bokeh/plot-dark.html",
  "quality_score": 88.0,
  "license": "MIT",
  "guide": "https://anyplot.ai/llms.txt"
}
Part of Nyquist Plot for Control Systems on anyplot.ai.