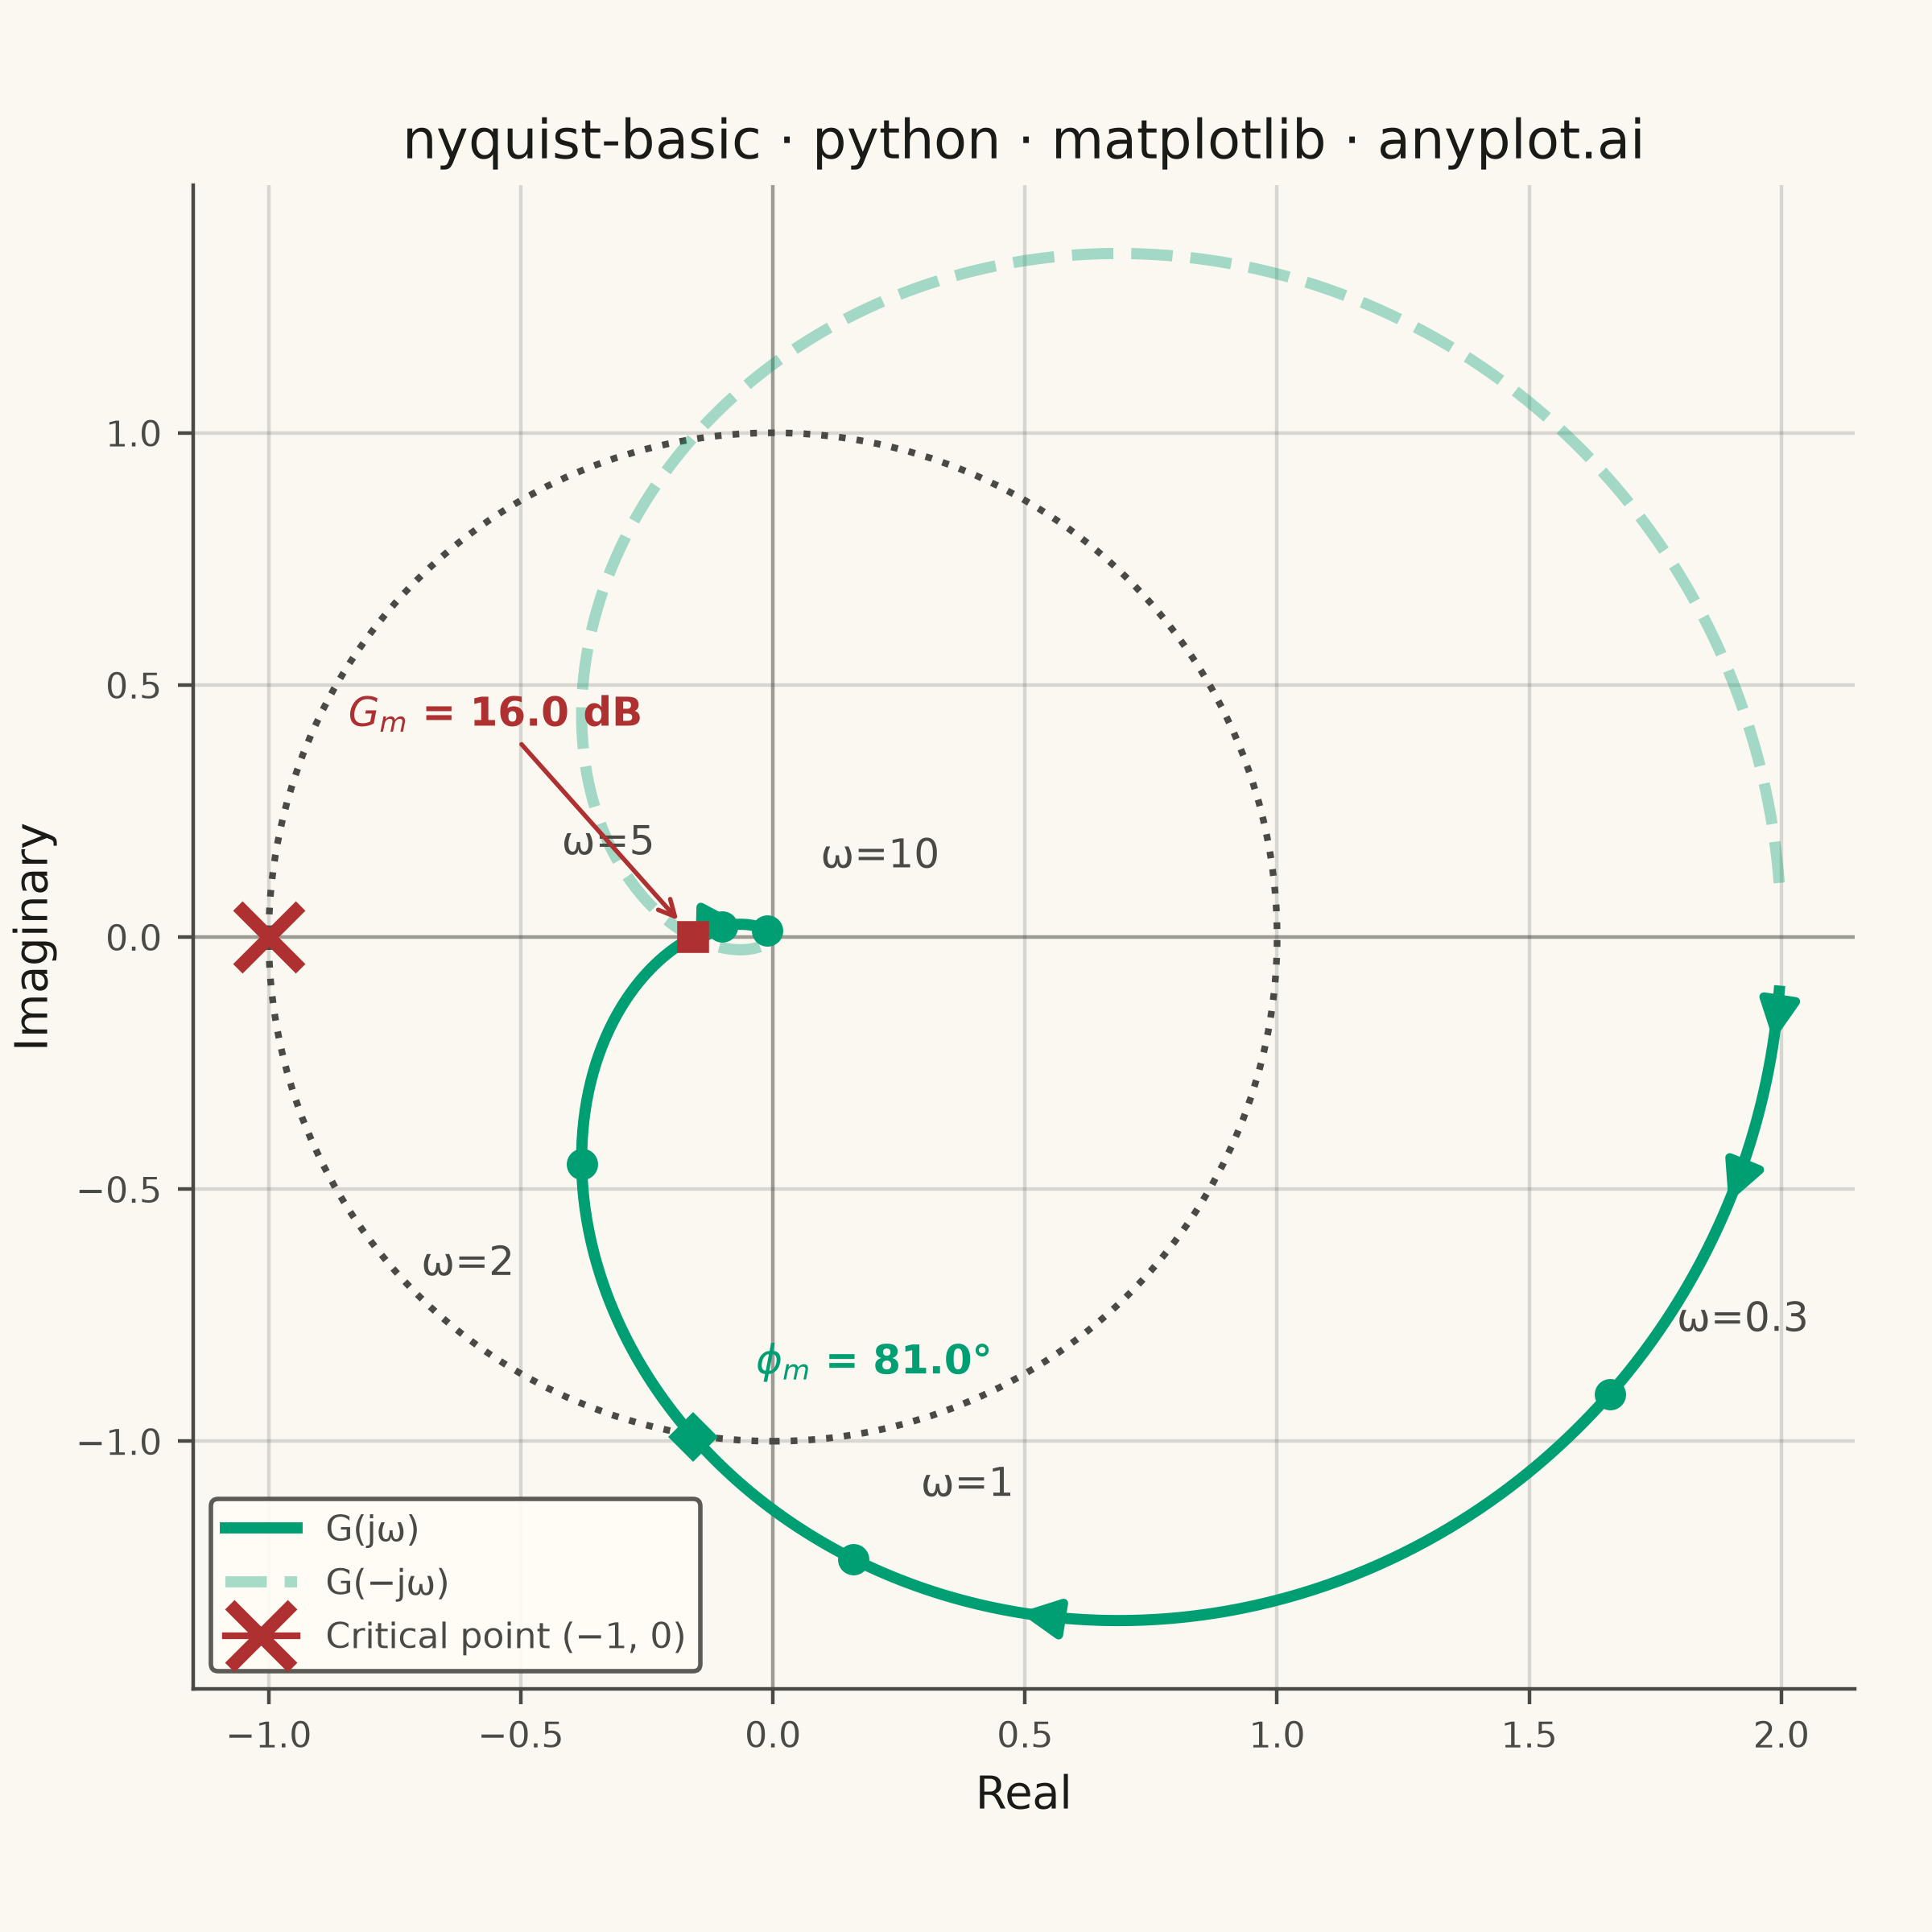
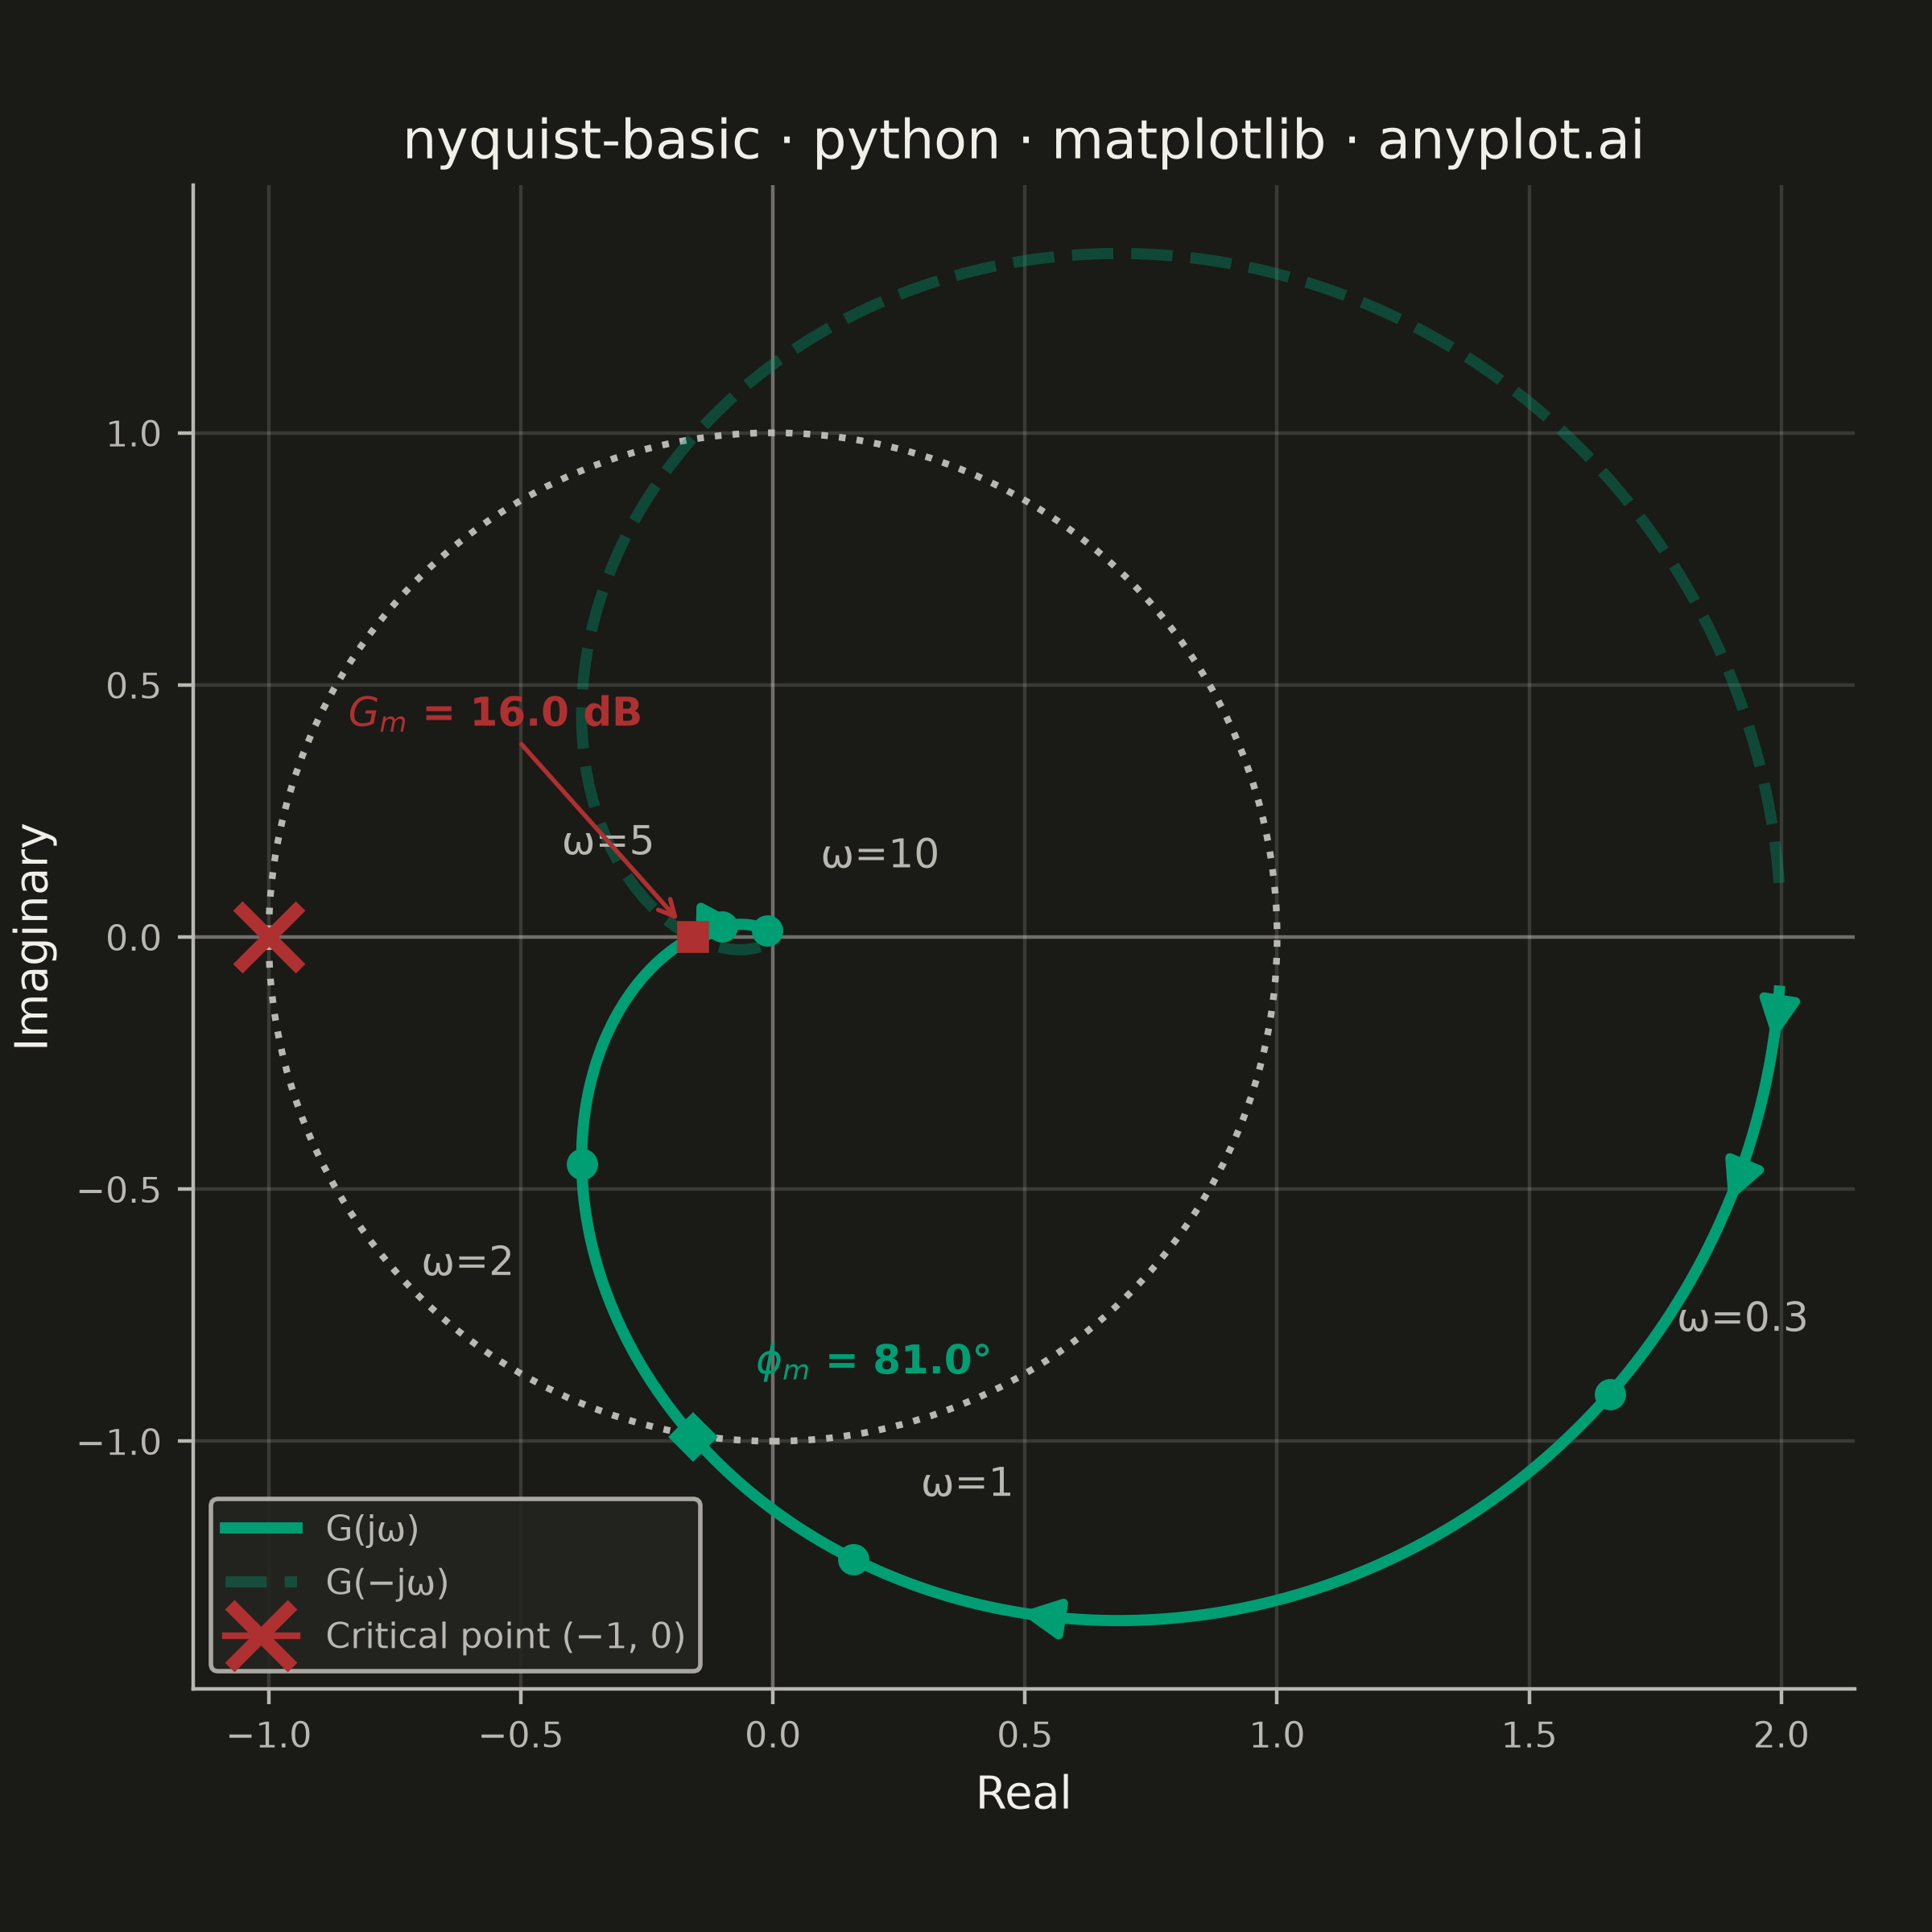
A Nyquist plot maps a system's open-loop frequency response onto the complex plane by plotting the imaginary part against the real part of the transfer function as frequency varies from zero to infinity. It is the primary tool for applying the Nyquist stability criterion to determine whether a closed-loop control system is stable. The plot visually reveals gain and phase margins and is widely used in classical control theory and electronic circuit design.
""" anyplot.ai
nyquist-basic: Nyquist Plot for Control Systems
Library: matplotlib 3.11.0 | Python 3.13.13
Quality: 89/100 | Updated: 2026-06-17
"""

import os
import sys


# Remove script directory from sys.path so it doesn't shadow the installed matplotlib package.
_script_dir = os.path.dirname(os.path.abspath(__file__))
sys.path = [p for p in sys.path if os.path.abspath(p) != _script_dir and p != ""]

import matplotlib.pyplot as plt
import numpy as np
from matplotlib.patches import Circle
from scipy import signal


# Theme tokens
THEME = os.getenv("ANYPLOT_THEME", "light")
PAGE_BG = "#FAF8F1" if THEME == "light" else "#1A1A17"
ELEVATED_BG = "#FFFDF6" if THEME == "light" else "#242420"
INK = "#1A1A17" if THEME == "light" else "#F0EFE8"
INK_SOFT = "#4A4A44" if THEME == "light" else "#B8B7B0"
INK_MUTED = "#6B6A63" if THEME == "light" else "#A8A79F"
BRAND = "#009E73"  # Imprint palette position 1 — ALWAYS first series
CRITICAL_COLOR = "#AE3030"  # Imprint semantic red for critical/error

# Data — cascaded third-order system: G(s) = 2 / (s+1)(0.5s+1)(0.2s+1)
num = [2.0]
den = np.polymul(np.polymul([1, 1], [0.5, 1]), [0.2, 1])
system = signal.TransferFunction(num, den)

omega = np.logspace(-1.5, 2, 800)
_, H = signal.freqresp(system, w=omega)

real = H.real
imag = H.imag

# Stability margins from frequency response
magnitude = np.abs(H)
phase_deg = np.unwrap(np.angle(H)) * 180 / np.pi

# Phase crossover (phase → -180°) → gain margin
wpc_idx = np.argmin(np.abs(phase_deg + 180))
gm_db = 20 * np.log10(1 / magnitude[wpc_idx])

# Gain crossover (|H| → 1) → phase margin
wgc_idx = np.argmin(np.abs(magnitude - 1))
pm_deg = 180 + phase_deg[wgc_idx]

# Plot
fig, ax = plt.subplots(figsize=(6, 6), dpi=400, facecolor=PAGE_BG)
ax.set_facecolor(PAGE_BG)

ax.plot(real, imag, color=BRAND, linewidth=2.5, label="G(jω)", zorder=3)
ax.plot(real, -imag, color=BRAND, linewidth=2.5, alpha=0.35, linestyle="--", label="G(−jω)", zorder=3)

# Direction arrows along the curve
for frac in [0.08, 0.2, 0.4, 0.65]:
    idx = int(frac * len(omega))
    ax.annotate(
        "",
        xy=(real[idx + 1], imag[idx + 1]),
        xytext=(real[idx], imag[idx]),
        arrowprops={"arrowstyle": "-|>", "color": BRAND, "lw": 2.0, "mutation_scale": 18},
        zorder=4,
    )

# Unit circle
unit_circle = Circle((0, 0), 1, fill=False, color=INK_SOFT, linewidth=1.5, linestyle=":", zorder=2)
ax.add_patch(unit_circle)

# Critical point (-1, 0)
ax.plot(
    -1,
    0,
    marker="x",
    color=CRITICAL_COLOR,
    markersize=14,
    markeredgewidth=3.0,
    zorder=5,
    label="Critical point (−1, 0)",
)

# Phase margin: gain crossover on unit circle (|H|=1)
ax.plot(real[wgc_idx], imag[wgc_idx], "D", color=BRAND, markersize=7, zorder=6)
ax.annotate(
    r"$\phi_m$" + f" = {pm_deg:.1f}°",
    xy=(real[wgc_idx], imag[wgc_idx]),
    xytext=(14, 12),
    textcoords="offset points",
    fontsize=9,
    color=BRAND,
    fontweight="bold",
    ha="left",
    va="bottom",
    zorder=6,
)

# Gain margin: phase crossover on negative real axis (phase = -180°)
ax.plot(real[wpc_idx], imag[wpc_idx], "s", color=CRITICAL_COLOR, markersize=6, zorder=6)
ax.annotate(
    r"$G_m$" + f" = {gm_db:.1f} dB",
    xy=(real[wpc_idx], imag[wpc_idx]),
    xytext=(-0.55, 0.40),
    textcoords="data",
    fontsize=9,
    color=CRITICAL_COLOR,
    fontweight="bold",
    ha="center",
    va="bottom",
    zorder=6,
    arrowprops={"arrowstyle": "->", "color": CRITICAL_COLOR, "lw": 1.0, "shrinkA": 0, "shrinkB": 5},
)

# Frequency annotations at key points
freq_annotations = [(0.3, (15, 12)), (1.0, (15, 12)), (2.0, (-15, -18)), (5.0, (-15, 14)), (10.0, (12, 12))]
for freq_val, (ox, oy) in freq_annotations:
    idx = np.argmin(np.abs(omega - freq_val))
    ax.plot(real[idx], imag[idx], "o", color=BRAND, markersize=6, zorder=5)
    ha = "left" if ox > 0 else "right"
    va = "bottom" if oy > 0 else "top"
    ax.annotate(
        f"ω={freq_val:g}",
        xy=(real[idx], imag[idx]),
        xytext=(ox, oy),
        textcoords="offset points",
        fontsize=9,
        color=INK_SOFT,
        fontweight="medium",
        ha=ha,
        va=va,
        zorder=5,
    )

# Style
ax.set_xlabel("Real", fontsize=10, color=INK)
ax.set_ylabel("Imaginary", fontsize=10, color=INK)
title = "nyquist-basic · python · matplotlib · anyplot.ai"
ax.set_title(title, fontsize=12, fontweight="medium", color=INK)
ax.tick_params(axis="both", labelsize=8, colors=INK_SOFT, labelcolor=INK_SOFT)
ax.set_aspect("equal")
ax.axhline(0, color=INK_SOFT, linewidth=0.8, alpha=0.4, zorder=1)
ax.axvline(0, color=INK_SOFT, linewidth=0.8, alpha=0.4, zorder=1)

for s in ("left", "bottom"):
    ax.spines[s].set_color(INK_SOFT)
ax.spines["top"].set_visible(False)
ax.spines["right"].set_visible(False)

ax.grid(True, alpha=0.15, linewidth=0.8, color=INK)

leg = ax.legend(fontsize=8, loc="lower left", framealpha=0.9)
if leg:
    leg.get_frame().set_facecolor(ELEVATED_BG)
    leg.get_frame().set_edgecolor(INK_SOFT)
    plt.setp(leg.get_texts(), color=INK_SOFT)

fig.subplots_adjust(left=0.10, right=0.96, top=0.93, bottom=0.10)

# Save
plt.savefig(os.path.join(_script_dir, f"plot-{THEME}.png"), dpi=400, facecolor=PAGE_BG)
Runnable source as JSON, for any HTTP client: https://api.anyplot.ai/specs/nyquist-basic/matplotlib/code. Any spec id and library id listed in llms-full.txt fit the same URL shape; every URL below is complete and callable.
{
  "spec_id": "nyquist-basic",
  "language": "python",
  "library": "matplotlib",
  "page": "https://anyplot.ai/nyquist-basic/python/matplotlib",
  "hub": "https://anyplot.ai/nyquist-basic",
  "code_json": "https://api.anyplot.ai/specs/nyquist-basic/matplotlib/code",
  "spec_json": "https://api.anyplot.ai/specs/nyquist-basic",
  "render_light_png": "https://storage.googleapis.com/anyplot-images/plots/nyquist-basic/python/matplotlib/plot-light.png",
  "render_dark_png": "https://storage.googleapis.com/anyplot-images/plots/nyquist-basic/python/matplotlib/plot-dark.png",
  "quality_score": 89.0,
  "license": "MIT",
  "guide": "https://anyplot.ai/llms.txt"
}
Part of Nyquist Plot for Control Systems on anyplot.ai.