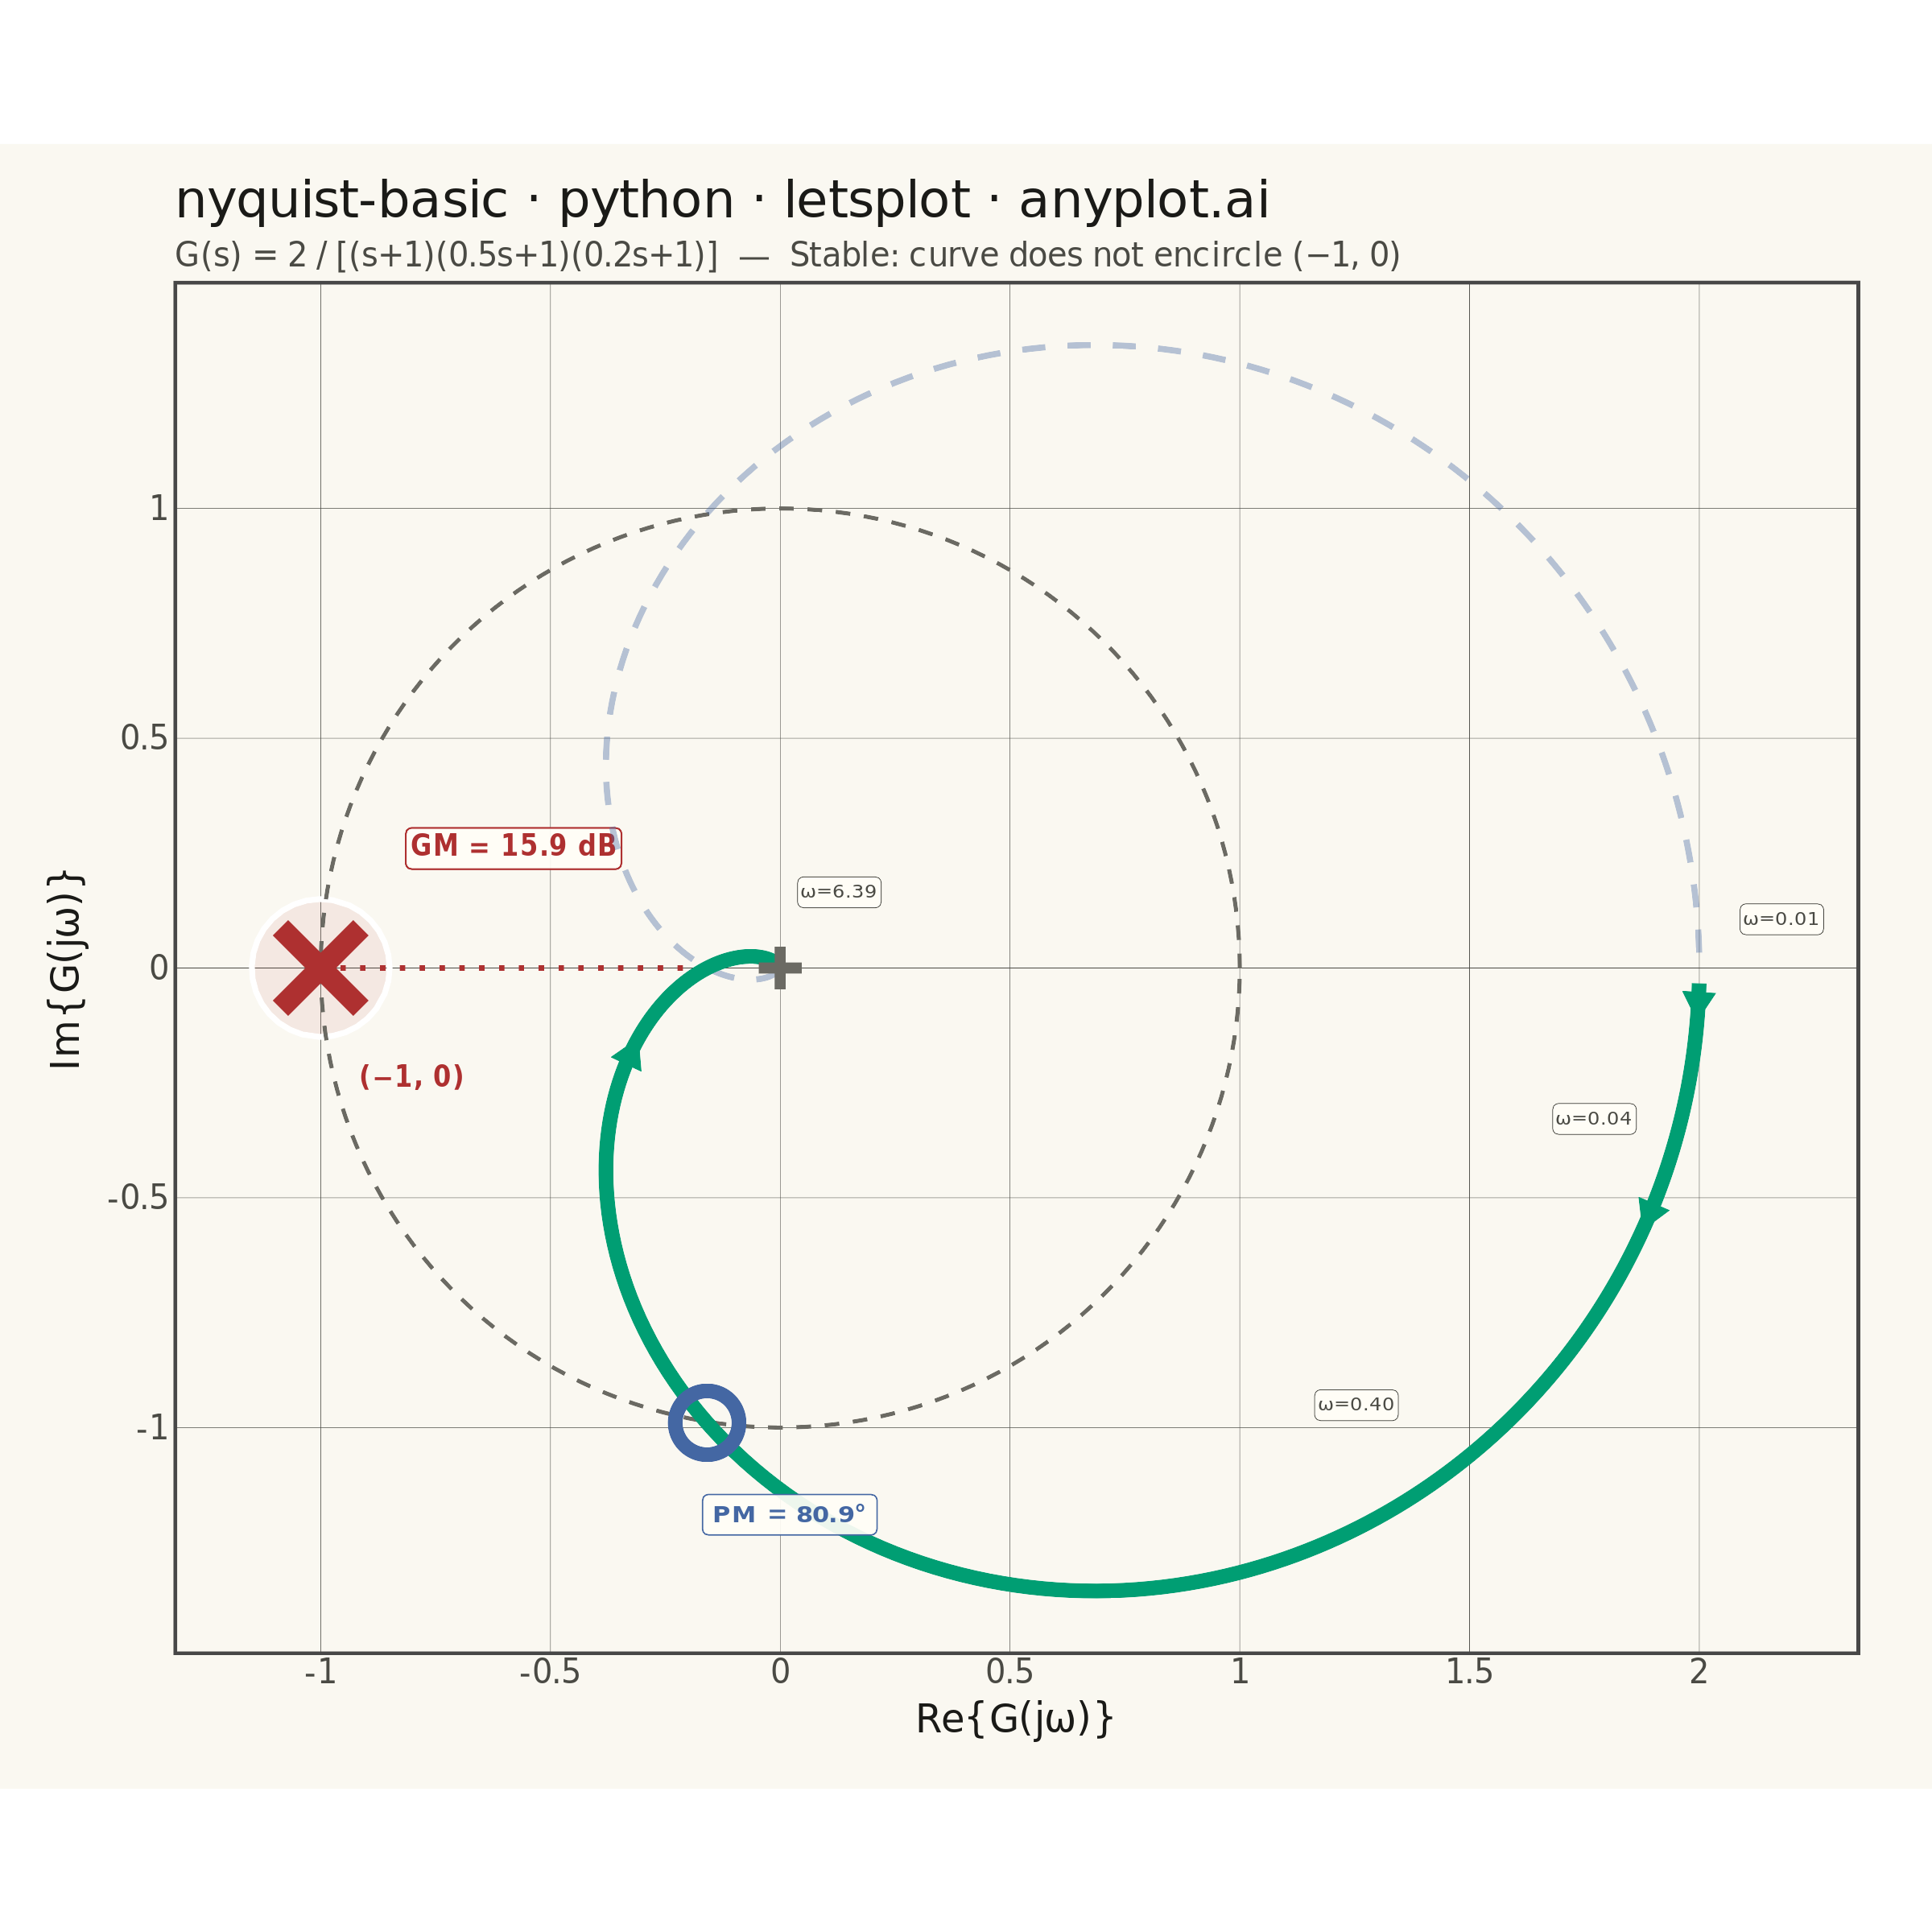
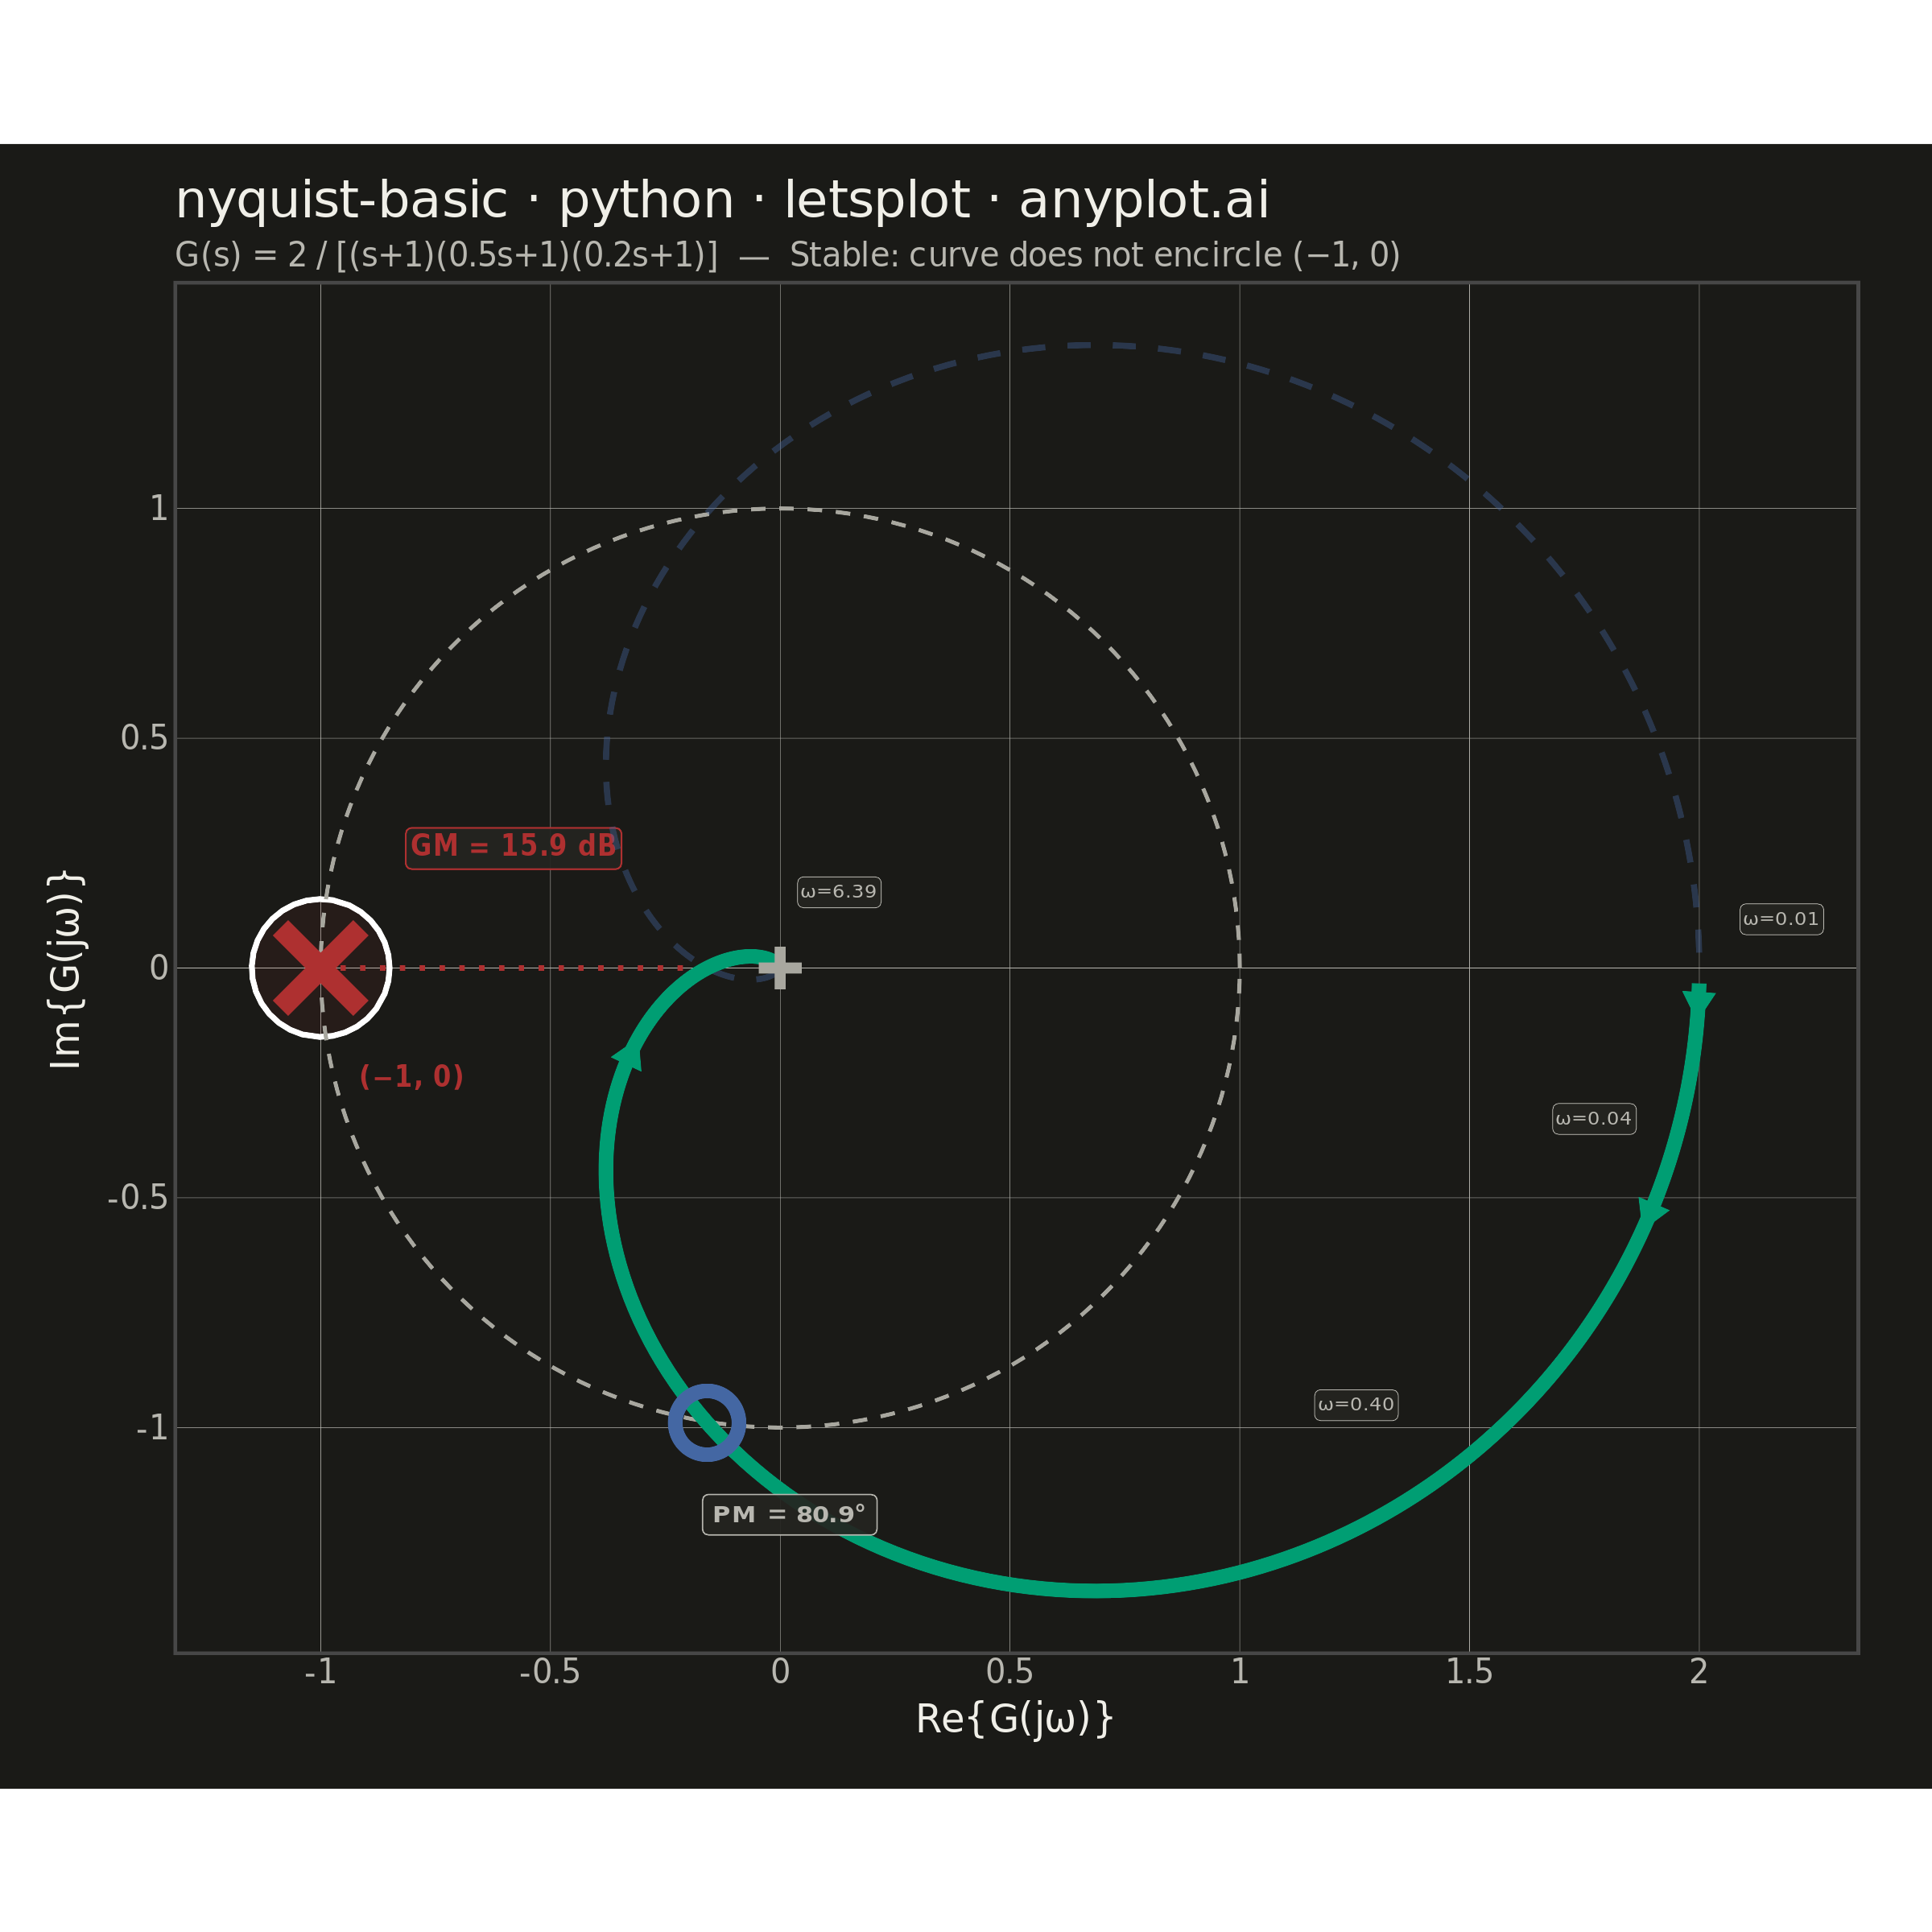
A Nyquist plot maps a system's open-loop frequency response onto the complex plane by plotting the imaginary part against the real part of the transfer function as frequency varies from zero to infinity. It is the primary tool for applying the Nyquist stability criterion to determine whether a closed-loop control system is stable. The plot visually reveals gain and phase margins and is widely used in classical control theory and electronic circuit design.
""" anyplot.ai
nyquist-basic: Nyquist Plot for Control Systems
Library: letsplot 4.10.1 | Python 3.13.14
Quality: 92/100 | Updated: 2026-06-17
"""
# ruff: noqa: F405

import os

import numpy as np
import pandas as pd
from lets_plot import *
from scipy import signal


LetsPlot.setup_html()

# Theme-adaptive chrome — Imprint palette
THEME = os.getenv("ANYPLOT_THEME", "light")
PAGE_BG = "#FAF8F1" if THEME == "light" else "#1A1A17"
ELEVATED_BG = "#FFFDF6" if THEME == "light" else "#242420"
INK = "#1A1A17" if THEME == "light" else "#F0EFE8"
INK_SOFT = "#4A4A44" if THEME == "light" else "#B8B7B0"
INK_MUTED = "#6B6A63" if THEME == "light" else "#A8A79F"

# Imprint categorical palette (hybrid-v3 sort)
IMPRINT_PALETTE = ["#009E73", "#C475FD", "#4467A3", "#BD8233", "#AE3030", "#2ABCCD", "#954477", "#99B314"]

COLOR_MAIN = IMPRINT_PALETTE[0]  # brand green — main Nyquist curve
COLOR_MIRROR = IMPRINT_PALETTE[2]  # blue — negative-frequency mirror
COLOR_CRITICAL = IMPRINT_PALETTE[4]  # matte red — critical point (semantic: danger)
COLOR_PM = IMPRINT_PALETTE[2]  # blue — phase margin marker
PM_LABEL_TEXT = COLOR_PM if THEME == "light" else INK_SOFT  # dark mode: blue on #242420 fails WCAG AA

# Data — third-order system: G(s) = 2 / ((s+1)(0.5s+1)(0.2s+1))
num = [2.0]
den = np.polymul(np.polymul([1, 1], [0.5, 1]), [0.2, 1])
system = signal.TransferFunction(num, den)

omega = np.logspace(-2, 2, 500)
_, H = signal.freqresp(system, omega)

real_part = H.real
imag_part = H.imag

df = pd.DataFrame({"real": real_part, "imaginary": imag_part, "frequency": omega})
df_mirror = pd.DataFrame({"real": real_part, "imaginary": -imag_part, "frequency": -omega})

# Unit circle reference
theta = np.linspace(0, 2 * np.pi, 200)
df_circle = pd.DataFrame({"real": np.cos(theta), "imaginary": np.sin(theta)})

# Critical point (-1, 0)
df_critical = pd.DataFrame({"real": [-1.0], "imaginary": [0.0]})

# Gain margin: phase crossover — where imaginary=0 and real<0
real_cross_mask = (imag_part[1:] * imag_part[:-1] < 0) & (real_part[:-1] < 0)
cross_indices = np.where(real_cross_mask)[0]
cross_idx = cross_indices[0] if len(cross_indices) > 0 else np.argmin(np.abs(imag_part[200:])) + 200
df_gain_margin = pd.DataFrame({"x": [-1.0], "y": [0.0], "xend": [real_part[cross_idx]], "yend": [0.0]})

gain_margin_db = 20 * np.log10(1.0 / abs(real_part[cross_idx]))
gm_mid_x = (-1.0 + real_part[cross_idx]) / 2
df_gm_label = pd.DataFrame(
    {
        "real": [gm_mid_x],
        "imaginary": [0.26],  # above the line to avoid crowding with critical point label
        "label": [f"GM = {gain_margin_db:.1f} dB"],
    }
)

# Phase margin: gain crossover — where |G(jω)| = 1
magnitudes = np.abs(H)
cross_gain_mask = (magnitudes[1:] - 1) * (magnitudes[:-1] - 1) < 0
gain_cross_indices = np.where(cross_gain_mask)[0]
if len(gain_cross_indices) > 0:
    gc_idx = gain_cross_indices[0]
    gc_angle = np.angle(H[gc_idx], deg=True)
    phase_margin = 180 + gc_angle
    df_pm_point = pd.DataFrame({"real": [H[gc_idx].real], "imaginary": [H[gc_idx].imag]})
    df_pm_label = pd.DataFrame(
        {"real": [H[gc_idx].real + 0.18], "imaginary": [H[gc_idx].imag - 0.20], "label": [f"PM = {phase_margin:.1f}°"]}
    )
else:
    df_pm_point = None
    df_pm_label = None

# Direction arrows showing increasing frequency
arrow_indices = [50, 150, 300]
df_arrows = df.iloc[arrow_indices].copy()
df_arrows_next = df.iloc[[i + 5 for i in arrow_indices]].copy()
df_segments = pd.DataFrame(
    {
        "x": df_arrows["real"].values,
        "y": df_arrows["imaginary"].values,
        "xend": df_arrows_next["real"].values,
        "yend": df_arrows_next["imaginary"].values,
    }
)

# Frequency labels at key points along the curve
label_indices = [0, 80, 200, 350]
df_labels_base = df.iloc[label_indices].copy()
freq_labels = [f"ω={omega[i]:.2f}" if omega[i] < 10 else f"ω={omega[i]:.0f}" for i in label_indices]
nudge_x = [0.18, -0.22, -0.18, 0.18]
nudge_y = [0.14, -0.18, 0.16, 0.14]
df_freq_labels = pd.DataFrame(
    {
        "real": df_labels_base["real"].values + np.array(nudge_x),
        "imaginary": df_labels_base["imaginary"].values + np.array(nudge_y),
        "label": freq_labels,
    }
)

# Stability zone highlight around (-1, 0)
stab_theta = np.linspace(0, 2 * np.pi, 100)
df_stability_zone = pd.DataFrame({"real": -1.0 + 0.15 * np.cos(stab_theta), "imaginary": 0.15 * np.sin(stab_theta)})

# Build plot
plot = (
    ggplot()
    # Subtle stability-danger zone around critical point
    + geom_polygon(aes(x="real", y="imaginary"), data=df_stability_zone, fill=COLOR_CRITICAL, alpha=0.08)
    # Unit circle reference
    + geom_path(aes(x="real", y="imaginary"), data=df_circle, color=INK_MUTED, size=0.5, linetype="dashed")
    # Gain margin indicator line
    + geom_segment(
        aes(x="x", y="y", xend="xend", yend="yend"),
        data=df_gain_margin,
        color=COLOR_CRITICAL,
        size=0.7,
        linetype="dotted",
    )
    # GM label positioned above the line to avoid crowding
    + geom_label(
        aes(x="real", y="imaginary", label="label"),
        data=df_gm_label,
        size=4,
        color=COLOR_CRITICAL,
        fill=ELEVATED_BG,
        alpha=0.93,
        label_padding=0.3,
        label_r=0.15,
        label_size=0.5,
        fontface="bold",
    )
    # Mirror curve (negative frequencies) — dashed, less prominent
    + geom_path(
        aes(x="real", y="imaginary"), data=df_mirror, color=COLOR_MIRROR, size=0.8, alpha=0.38, linetype="dashed"
    )
    # Main Nyquist curve with interactive tooltips
    + geom_path(
        aes(x="real", y="imaginary"),
        data=df,
        color=COLOR_MAIN,
        size=2.0,
        tooltips=layer_tooltips()
        .format("real", ".3f")
        .format("imaginary", ".3f")
        .format("frequency", ".3f")
        .line("Re: @real")
        .line("Im: @imaginary")
        .line("ω: @frequency rad/s"),
    )
    # Direction arrows
    + geom_segment(
        aes(x="x", y="y", xend="xend", yend="yend"),
        data=df_segments,
        color=COLOR_MAIN,
        size=1.4,
        arrow=arrow(length=12, type="closed"),
    )
    # Frequency labels along the curve
    + geom_label(
        aes(x="real", y="imaginary", label="label"),
        data=df_freq_labels,
        size=3,
        color=INK_SOFT,
        fill=ELEVATED_BG,
        alpha=0.9,
        label_padding=0.3,
        label_r=0.2,
        label_size=0.2,
    )
    # Critical point (-1, 0) — prominent X marker
    + geom_point(aes(x="real", y="imaginary"), data=df_critical, color=COLOR_CRITICAL, size=10, shape=4, stroke=3.0)
    # Critical point label — placed below to separate from GM label above
    + geom_text(
        aes(x="real", y="imaginary"),
        data=pd.DataFrame({"real": [-0.80], "imaginary": [-0.24]}),
        label="(−1, 0)",
        size=4,
        color=COLOR_CRITICAL,
        fontface="bold",
    )
    # Origin marker
    + geom_point(
        aes(x="real", y="imaginary"),
        data=pd.DataFrame({"real": [0.0], "imaginary": [0.0]}),
        color=INK_MUTED,
        size=3,
        shape=3,
        stroke=1.5,
    )
    + labs(
        x="Re{G(jω)}",
        y="Im{G(jω)}",
        title="nyquist-basic · python · letsplot · anyplot.ai",
        subtitle="G(s) = 2 / [(s+1)(0.5s+1)(0.2s+1)]  —  Stable: curve does not encircle (−1, 0)",
    )
    + coord_fixed(ratio=1)
    + ggsize(600, 600)
    + theme_minimal()
    + theme(
        axis_text=element_text(size=10, color=INK_SOFT),
        axis_title=element_text(size=12, color=INK),
        plot_title=element_text(size=16, color=INK),
        plot_subtitle=element_text(size=10, color=INK_SOFT),
        panel_grid_major=element_line(color=INK_SOFT, size=0.12),
        panel_grid_minor=element_blank(),
        plot_background=element_rect(fill=PAGE_BG, color=PAGE_BG),
        panel_background=element_rect(fill=PAGE_BG),
        axis_ticks=element_blank(),
        axis_ticks_length=0,
        plot_margin=[10, 20, 15, 15],
        legend_background=element_rect(fill=ELEVATED_BG, color=INK_SOFT),
        legend_text=element_text(color=INK_SOFT),
        legend_title=element_text(color=INK),
    )
)

# Phase margin annotation (adds content to balance the canvas)
if df_pm_point is not None:
    plot = (
        plot
        + geom_point(aes(x="real", y="imaginary"), data=df_pm_point, color=COLOR_PM, size=7, shape=1, stroke=2.0)
        + geom_label(
            aes(x="real", y="imaginary", label="label"),
            data=df_pm_label,
            size=3.8,
            color=PM_LABEL_TEXT,
            fill=ELEVATED_BG,
            alpha=0.93,
            label_padding=0.3,
            label_r=0.15,
            label_size=0.4,
            fontface="bold",
        )
    )

# Save — theme-suffixed PNG + interactive HTML
ggsave(plot, f"plot-{THEME}.png", path=".", scale=4)
ggsave(plot, f"plot-{THEME}.html", path=".")
Runnable source as JSON, for any HTTP client: https://api.anyplot.ai/specs/nyquist-basic/letsplot/code. Any spec id and library id listed in llms-full.txt fit the same URL shape; every URL below is complete and callable.
{
  "spec_id": "nyquist-basic",
  "language": "python",
  "library": "letsplot",
  "page": "https://anyplot.ai/nyquist-basic/python/letsplot",
  "hub": "https://anyplot.ai/nyquist-basic",
  "code_json": "https://api.anyplot.ai/specs/nyquist-basic/letsplot/code",
  "spec_json": "https://api.anyplot.ai/specs/nyquist-basic",
  "render_light_png": "https://storage.googleapis.com/anyplot-images/plots/nyquist-basic/python/letsplot/plot-light.png",
  "render_dark_png": "https://storage.googleapis.com/anyplot-images/plots/nyquist-basic/python/letsplot/plot-dark.png",
  "interactive_light_html": "https://storage.googleapis.com/anyplot-images/plots/nyquist-basic/python/letsplot/plot-light.html",
  "interactive_dark_html": "https://storage.googleapis.com/anyplot-images/plots/nyquist-basic/python/letsplot/plot-dark.html",
  "quality_score": 92.0,
  "license": "MIT",
  "guide": "https://anyplot.ai/llms.txt"
}
Part of Nyquist Plot for Control Systems on anyplot.ai.