The same plot in 14 other libraries — JavaScript: Chart.js, D3.js, Highcharts, MUI X Charts; Python: Altair, Bokeh, lets-plot, Matplotlib, Plotly, plotnine, Pygal, Seaborn; R: ggplot2; Julia: Makie.jl. Compare all 15 side by side: MIDI Piano Roll Visualization in Python, R, Julia and JavaScript.
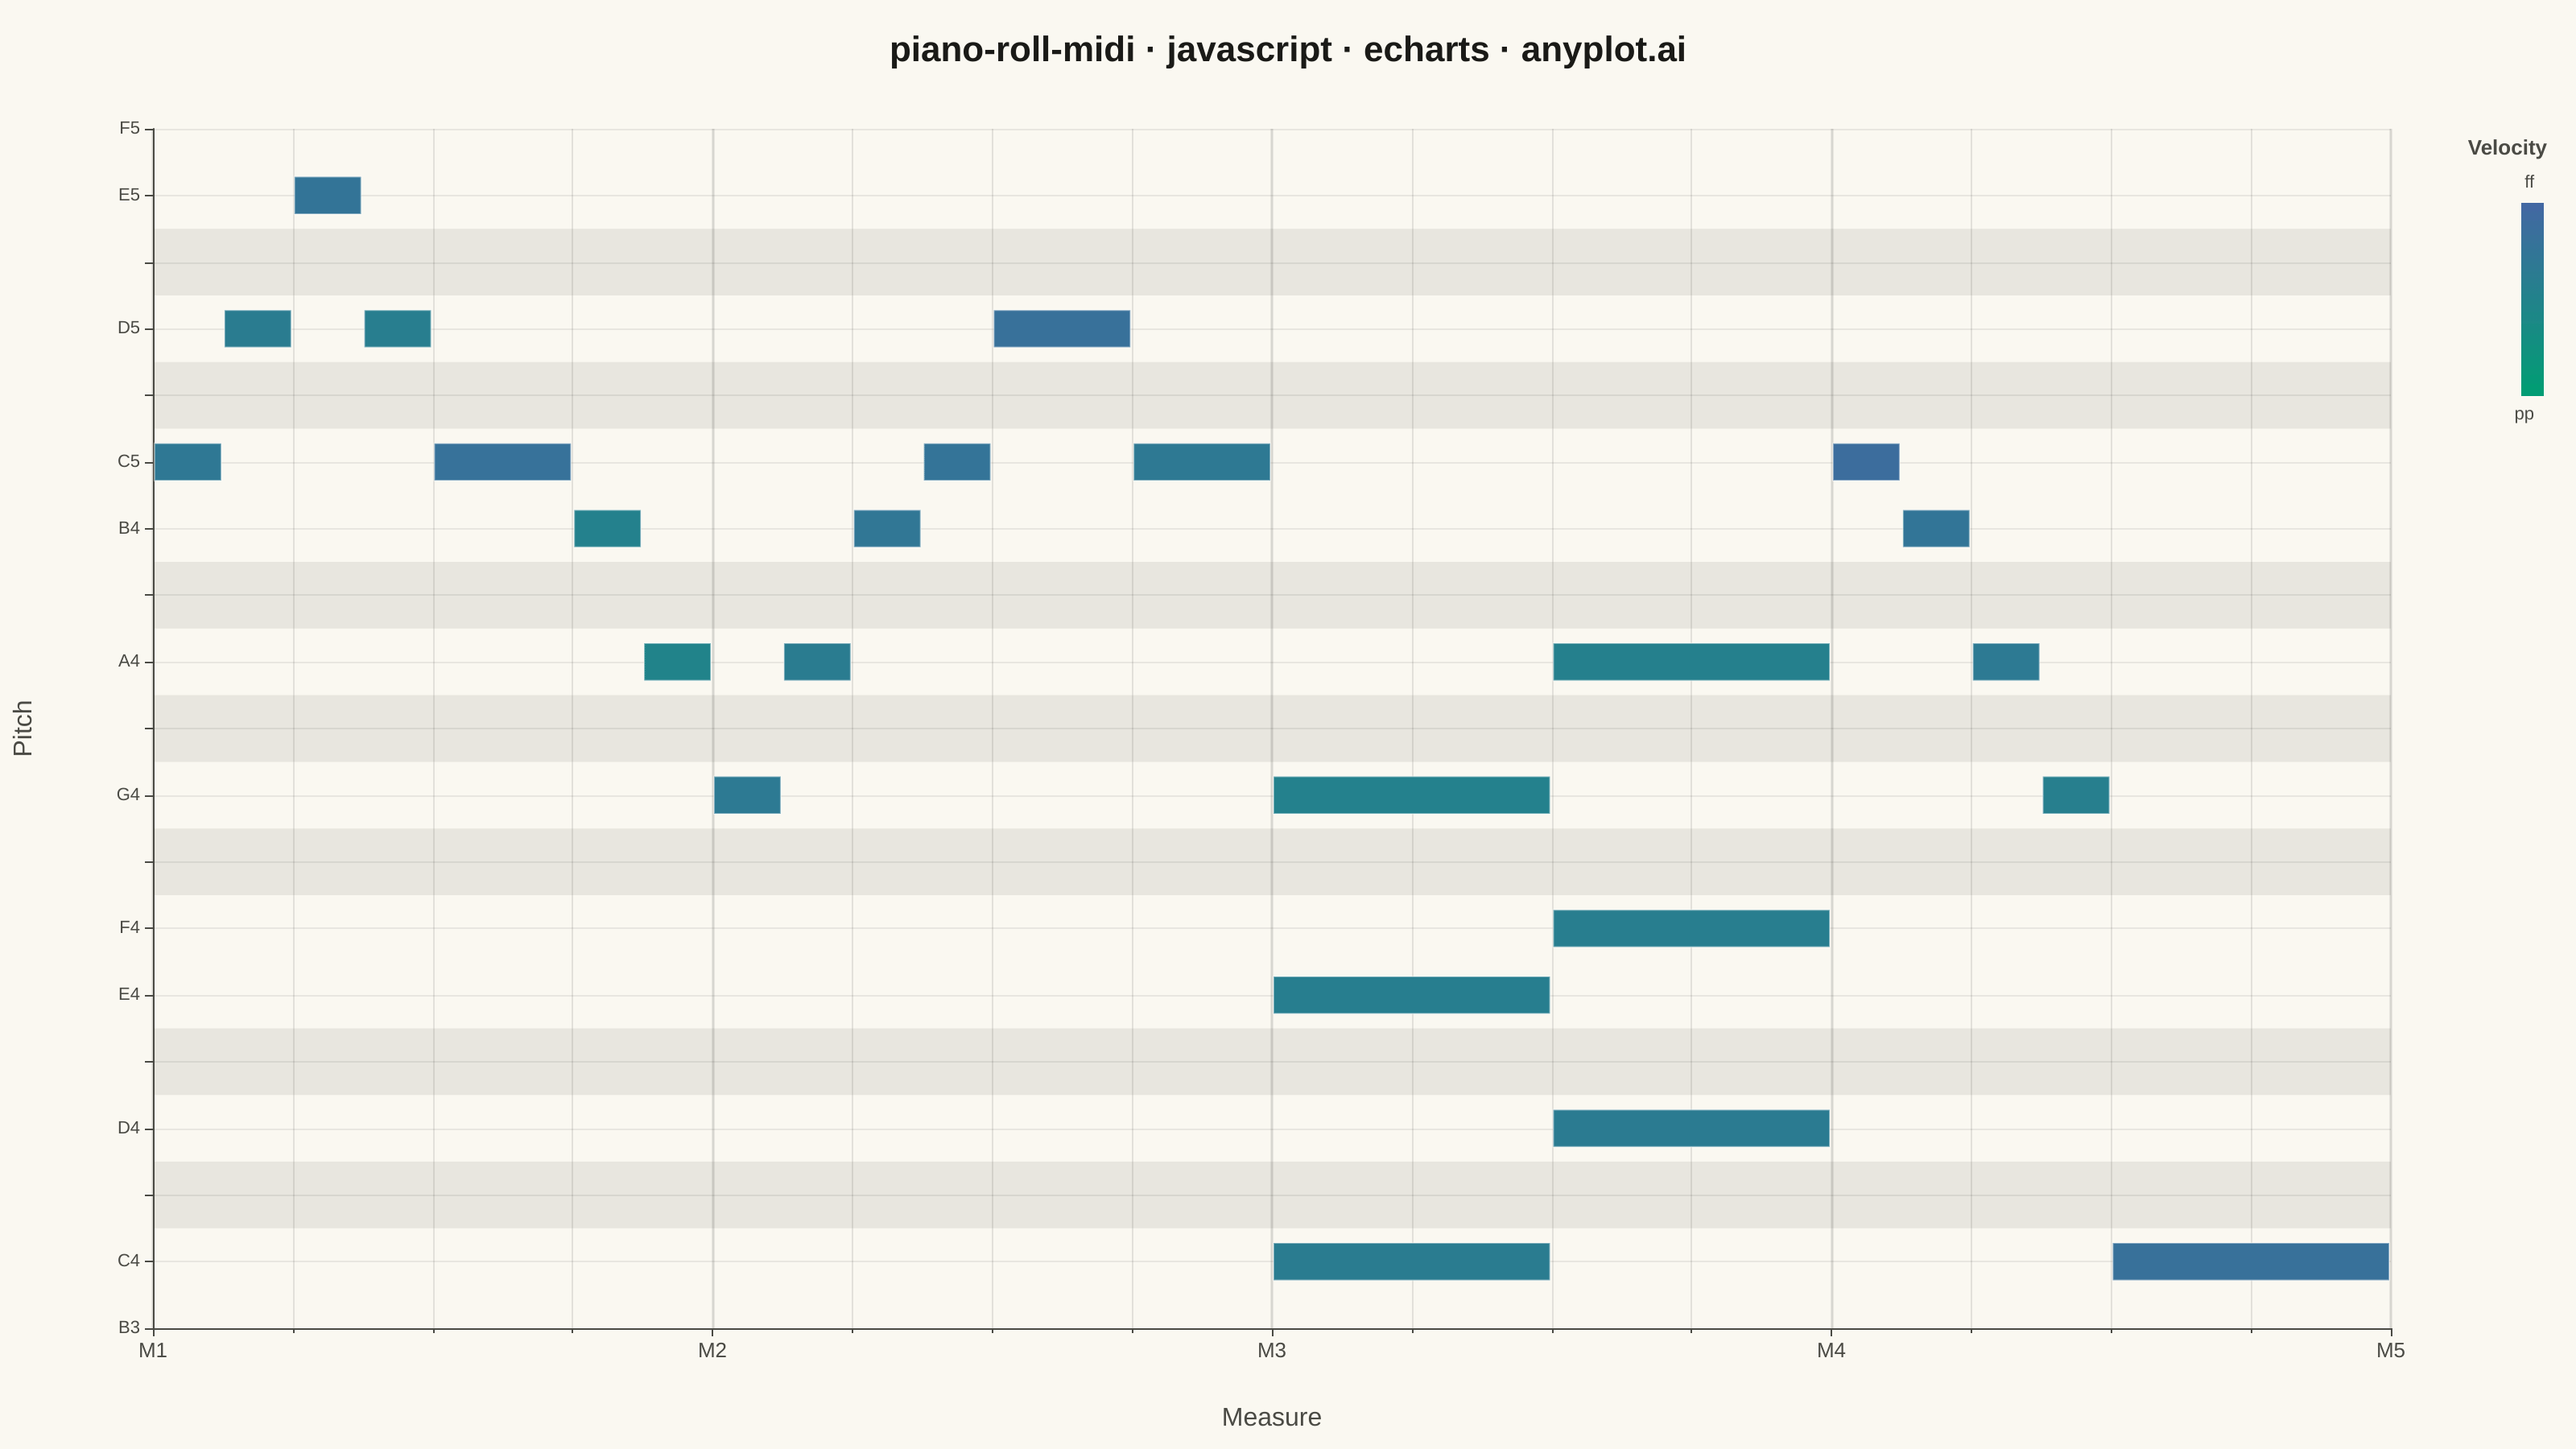
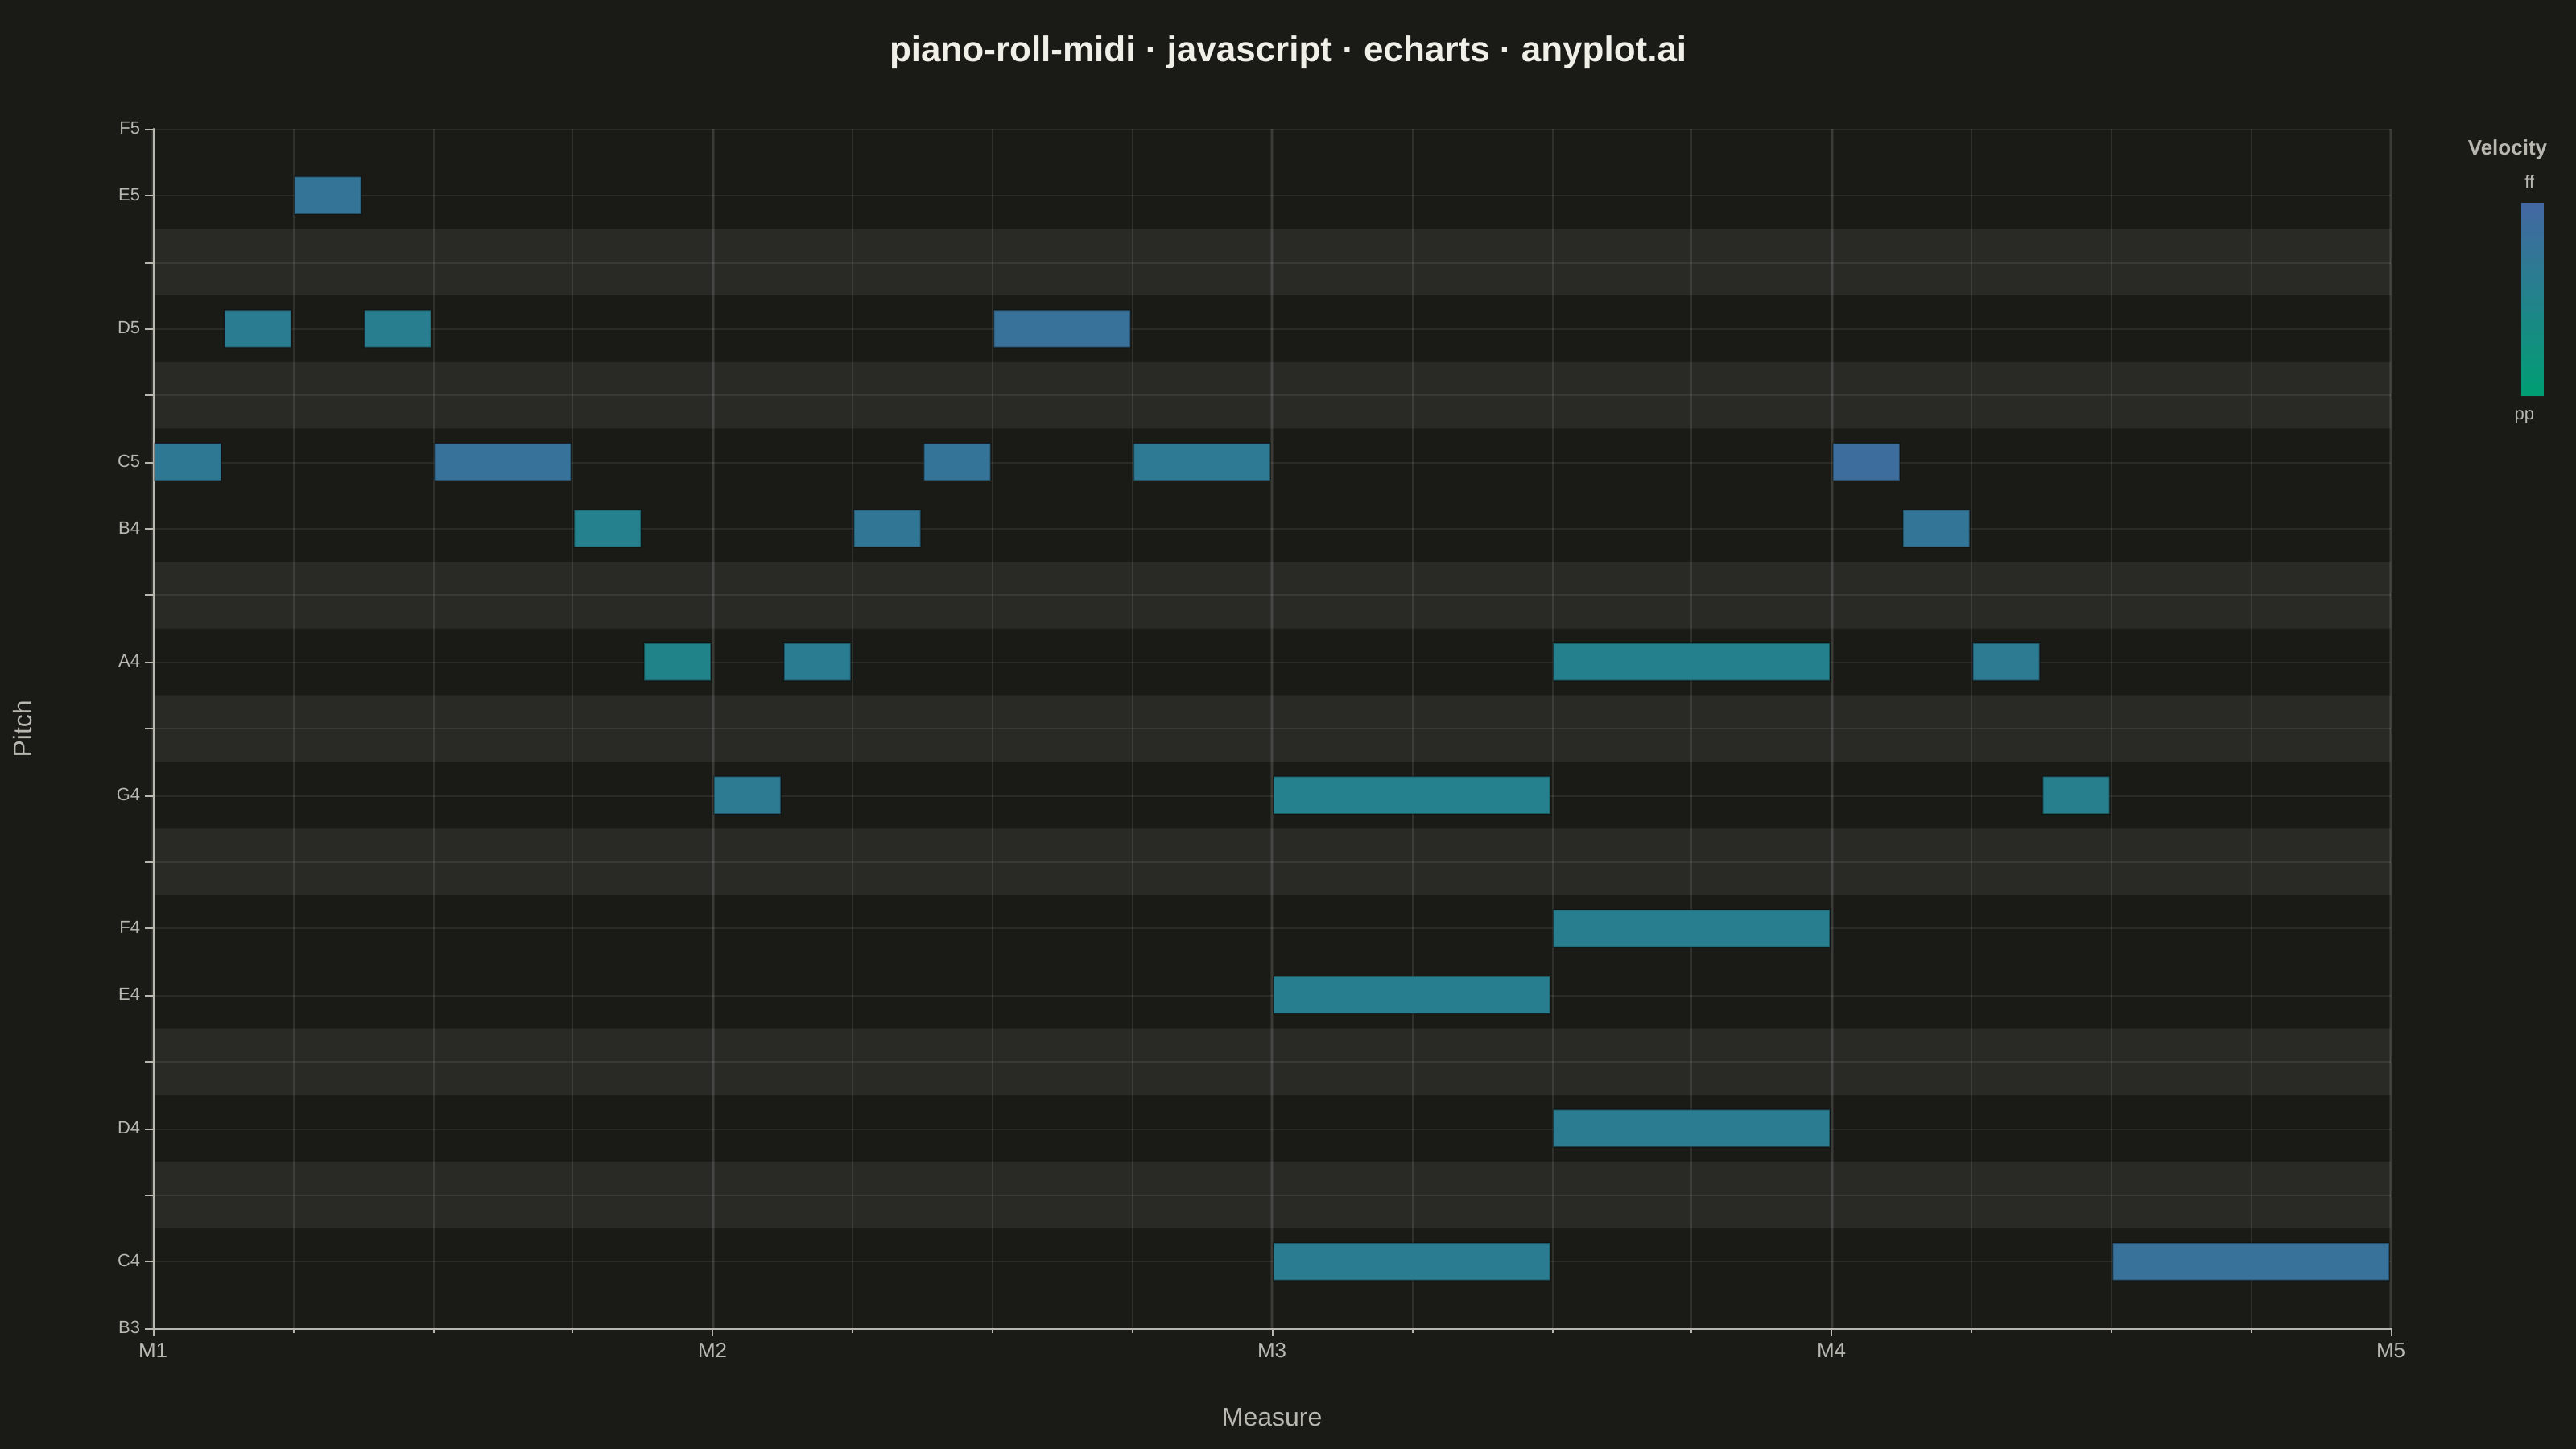
A grid-based visualization of musical notes over time, as seen in digital audio workstations (DAWs). Each note is represented as a horizontal rectangle positioned by pitch (y-axis) and time (x-axis), with bar length indicating note duration and color indicating velocity (dynamics). The background alternates between white and dark rows to mirror piano keyboard layout, with vertical grid lines marking beats and measures.
// anyplot.ai
// piano-roll-midi: MIDI Piano Roll Visualization
// Library: echarts 5.5.1 | JavaScript 22.22.3
// Quality: 92/100 | Created: 2026-06-03

const t = window.ANYPLOT_TOKENS;

// --- Data: C major composition — melody + triads, 4 measures (16 beats) ---
// [start_beat, duration_beats, midi_pitch, velocity]
const notes = [
  // Melody (measures 1–2): ascending scale then descent
  [0.0, 0.5, 72, 88],  [0.5, 0.5, 74, 78],
  [1.0, 0.5, 76, 96],  [1.5, 0.5, 74, 74],
  [2.0, 1.0, 72, 102], [3.0, 0.5, 71, 68],
  [3.5, 0.5, 69, 62],
  [4.0, 0.5, 67, 84],  [4.5, 0.5, 69, 78],
  [5.0, 0.5, 71, 91],  [5.5, 0.5, 72, 97],
  [6.0, 1.0, 74, 104], [7.0, 1.0, 72, 85],
  // Block chords (measure 3): C major then D minor
  [8.0, 2.0,  60, 78],  [8.0, 2.0,  64, 73],  [8.0, 2.0,  67, 68],
  [10.0, 2.0, 62, 80],  [10.0, 2.0, 65, 75],  [10.0, 2.0, 69, 70],
  // Final cadence (measure 4)
  [12.0, 0.5, 72, 112], [12.5, 0.5, 71, 94],
  [13.0, 0.5, 69, 84],  [13.5, 0.5, 67, 72],
  [14.0, 2.0, 60, 104],
];

const TOTAL_BEATS = 16;
const allPitches = notes.map(n => n[2]);
const minPitch = Math.min(...allPitches) - 1;  // 59 = B3
const maxPitch = Math.max(...allPitches) + 1;  // 77 = F5

const NOTE_NAMES = ['C', 'C#', 'D', 'D#', 'E', 'F', 'F#', 'G', 'G#', 'A', 'A#', 'B'];

function noteName(midi) {
  return NOTE_NAMES[midi % 12] + (Math.floor(midi / 12) - 1);
}

function isBlackKey(midi) {
  return [1, 3, 6, 8, 10].includes(midi % 12);
}

function hexRgb(hex) {
  return [
    parseInt(hex.slice(1, 3), 16),
    parseInt(hex.slice(3, 5), 16),
    parseInt(hex.slice(5, 7), 16),
  ];
}

// Imprint sequential colormap: low velocity → t.seq[0] (green), high → t.seq[1] (blue)
function velColor(vel) {
  const r = Math.min(vel / 127, 1);
  const c0 = hexRgb(t.seq[0]);
  const c1 = hexRgb(t.seq[1]);
  return `rgb(${Math.round(c0[0] + r * (c1[0] - c0[0]))},${Math.round(c0[1] + r * (c1[1] - c0[1]))},${Math.round(c0[2] + r * (c1[2] - c0[2]))})`;
}

const isDark = window.ANYPLOT_THEME === 'dark';
// Subtle shading for black-key rows (mirrors DAW piano keyboard layout)
const blackKeyBg = isDark ? 'rgba(240,239,232,0.07)' : 'rgba(26,26,23,0.08)';

// Black-key pitches in the display range
const blackKeyPitches = [];
for (let p = minPitch; p <= maxPitch; p++) {
  if (isBlackKey(p)) blackKeyPitches.push([p]);
}

// Render a shaded band covering the full time range for a black key row
function renderBgItem(params, api) {
  const pitch = api.value(0);
  const tl = api.coord([0, pitch + 0.5]);
  const br = api.coord([TOTAL_BEATS, pitch - 0.5]);
  return {
    type: 'rect',
    shape: { x: tl[0], y: tl[1], width: br[0] - tl[0], height: br[1] - tl[1] },
    style: { fill: blackKeyBg },
    z2: 0,
  };
}

// Render each MIDI note as a horizontal bar colored by velocity
function renderNoteItem(params, api) {
  const start = api.value(0);
  const dur   = api.value(1);
  const pitch = api.value(2);
  const vel   = api.value(3);
  const pad   = 0.28;  // vertical padding: bar occupies 72% of the row height
  const tl = api.coord([start, pitch + pad]);
  const br = api.coord([start + dur, pitch - pad]);
  return {
    type: 'rect',
    shape: {
      x: tl[0] + 1,
      y: tl[1],
      width: Math.max(br[0] - tl[0] - 2, 3),
      height: br[1] - tl[1],
    },
    style: {
      fill: velColor(vel),
      stroke: isDark ? 'rgba(0,0,0,0.3)' : 'rgba(255,255,255,0.4)',
      lineWidth: 1,
    },
    z2: 2,
  };
}

// --- Init -------------------------------------------------------------------
const chart = echarts.init(document.getElementById('container'));

// --- Option -----------------------------------------------------------------
chart.setOption({
  animation: false,
  color: t.palette,
  backgroundColor: 'transparent',

  title: {
    text: 'piano-roll-midi · javascript · echarts · anyplot.ai',
    left: 'center',
    top: 16,
    textStyle: { color: t.ink, fontSize: 22, fontWeight: 'bold' },
  },

  grid: { left: 95, right: 115, top: 80, bottom: 75 },

  xAxis: {
    type: 'value',
    min: 0,
    max: TOTAL_BEATS,
    interval: 4,
    minorTick: { show: true, splitNumber: 4 },
    name: 'Measure',
    nameLocation: 'middle',
    nameGap: 48,
    nameTextStyle: { color: t.inkSoft, fontSize: 16 },
    axisLabel: {
      color: t.inkSoft,
      fontSize: 13,
      // Label each measure start: M1 … M5
      formatter: val => val <= TOTAL_BEATS ? `M${val / 4 + 1}` : '',
    },
    axisLine: { lineStyle: { color: t.inkSoft } },
    // Strong lines at measure boundaries
    splitLine: {
      show: true,
      lineStyle: { color: t.grid, width: 1.5 },
    },
    // Lighter lines at each beat
    minorSplitLine: {
      show: true,
      lineStyle: { color: t.grid, width: 0.7 },
    },
  },

  yAxis: {
    type: 'value',
    min: minPitch,
    max: maxPitch,
    interval: 1,
    name: 'Pitch',
    nameLocation: 'middle',
    nameGap: 72,
    nameTextStyle: { color: t.inkSoft, fontSize: 16 },
    axisLabel: {
      color: t.inkSoft,
      fontSize: 11,
      // Show note name only for white keys; leave black-key rows unlabeled
      formatter: val => {
        const m = Math.round(val);
        return isBlackKey(m) ? '' : noteName(m);
      },
    },
    axisLine: { lineStyle: { color: t.inkSoft } },
    splitLine: {
      show: true,
      lineStyle: { color: t.grid, width: 0.5 },
    },
  },

  // Velocity color ramp legend (positioned in the right margin)
  graphic: [
    {
      type: 'text',
      right: 18, top: 86,
      style: { text: 'Velocity', fill: t.inkSoft, fontSize: 13, fontWeight: 'bold' },
    },
    {
      type: 'text',
      right: 26, top: 108,
      style: { text: 'ff', fill: t.inkSoft, fontSize: 11 },
    },
    {
      type: 'rect',
      right: 20, top: 126,
      shape: { width: 14, height: 120 },
      style: {
        fill: {
          type: 'linear', x: 0, y: 0, x2: 0, y2: 1,
          colorStops: [
            { offset: 0, color: t.seq[1] },  // blue at top = loud
            { offset: 1, color: t.seq[0] },  // green at bottom = soft
          ],
        },
      },
    },
    {
      type: 'text',
      right: 26, top: 252,
      style: { text: 'pp', fill: t.inkSoft, fontSize: 11 },
    },
  ],

  series: [
    // Black-key row shading (background layer)
    {
      type: 'custom',
      renderItem: renderBgItem,
      data: blackKeyPitches,
      encode: { x: 0, y: 0 },
      silent: true,
      z: 0,
    },
    // MIDI note bars (foreground layer)
    {
      type: 'custom',
      renderItem: renderNoteItem,
      data: notes,
      encode: { x: [0], y: 2 },
      z: 2,
    },
  ],
});
Runnable source as JSON, for any HTTP client: https://api.anyplot.ai/specs/piano-roll-midi/echarts/code. Any spec id and library id listed in llms-full.txt fit the same URL shape; every URL below is complete and callable.
{
  "spec_id": "piano-roll-midi",
  "language": "javascript",
  "library": "echarts",
  "page": "https://anyplot.ai/piano-roll-midi/javascript/echarts",
  "hub": "https://anyplot.ai/piano-roll-midi",
  "code_json": "https://api.anyplot.ai/specs/piano-roll-midi/echarts/code",
  "spec_json": "https://api.anyplot.ai/specs/piano-roll-midi",
  "render_light_png": "https://storage.googleapis.com/anyplot-images/plots/piano-roll-midi/javascript/echarts/plot-light.png",
  "render_dark_png": "https://storage.googleapis.com/anyplot-images/plots/piano-roll-midi/javascript/echarts/plot-dark.png",
  "interactive_light_html": "https://storage.googleapis.com/anyplot-images/plots/piano-roll-midi/javascript/echarts/plot-light.html",
  "interactive_dark_html": "https://storage.googleapis.com/anyplot-images/plots/piano-roll-midi/javascript/echarts/plot-dark.html",
  "quality_score": 92.0,
  "license": "MIT",
  "guide": "https://anyplot.ai/llms.txt"
}
Part of MIDI Piano Roll Visualization on anyplot.ai.