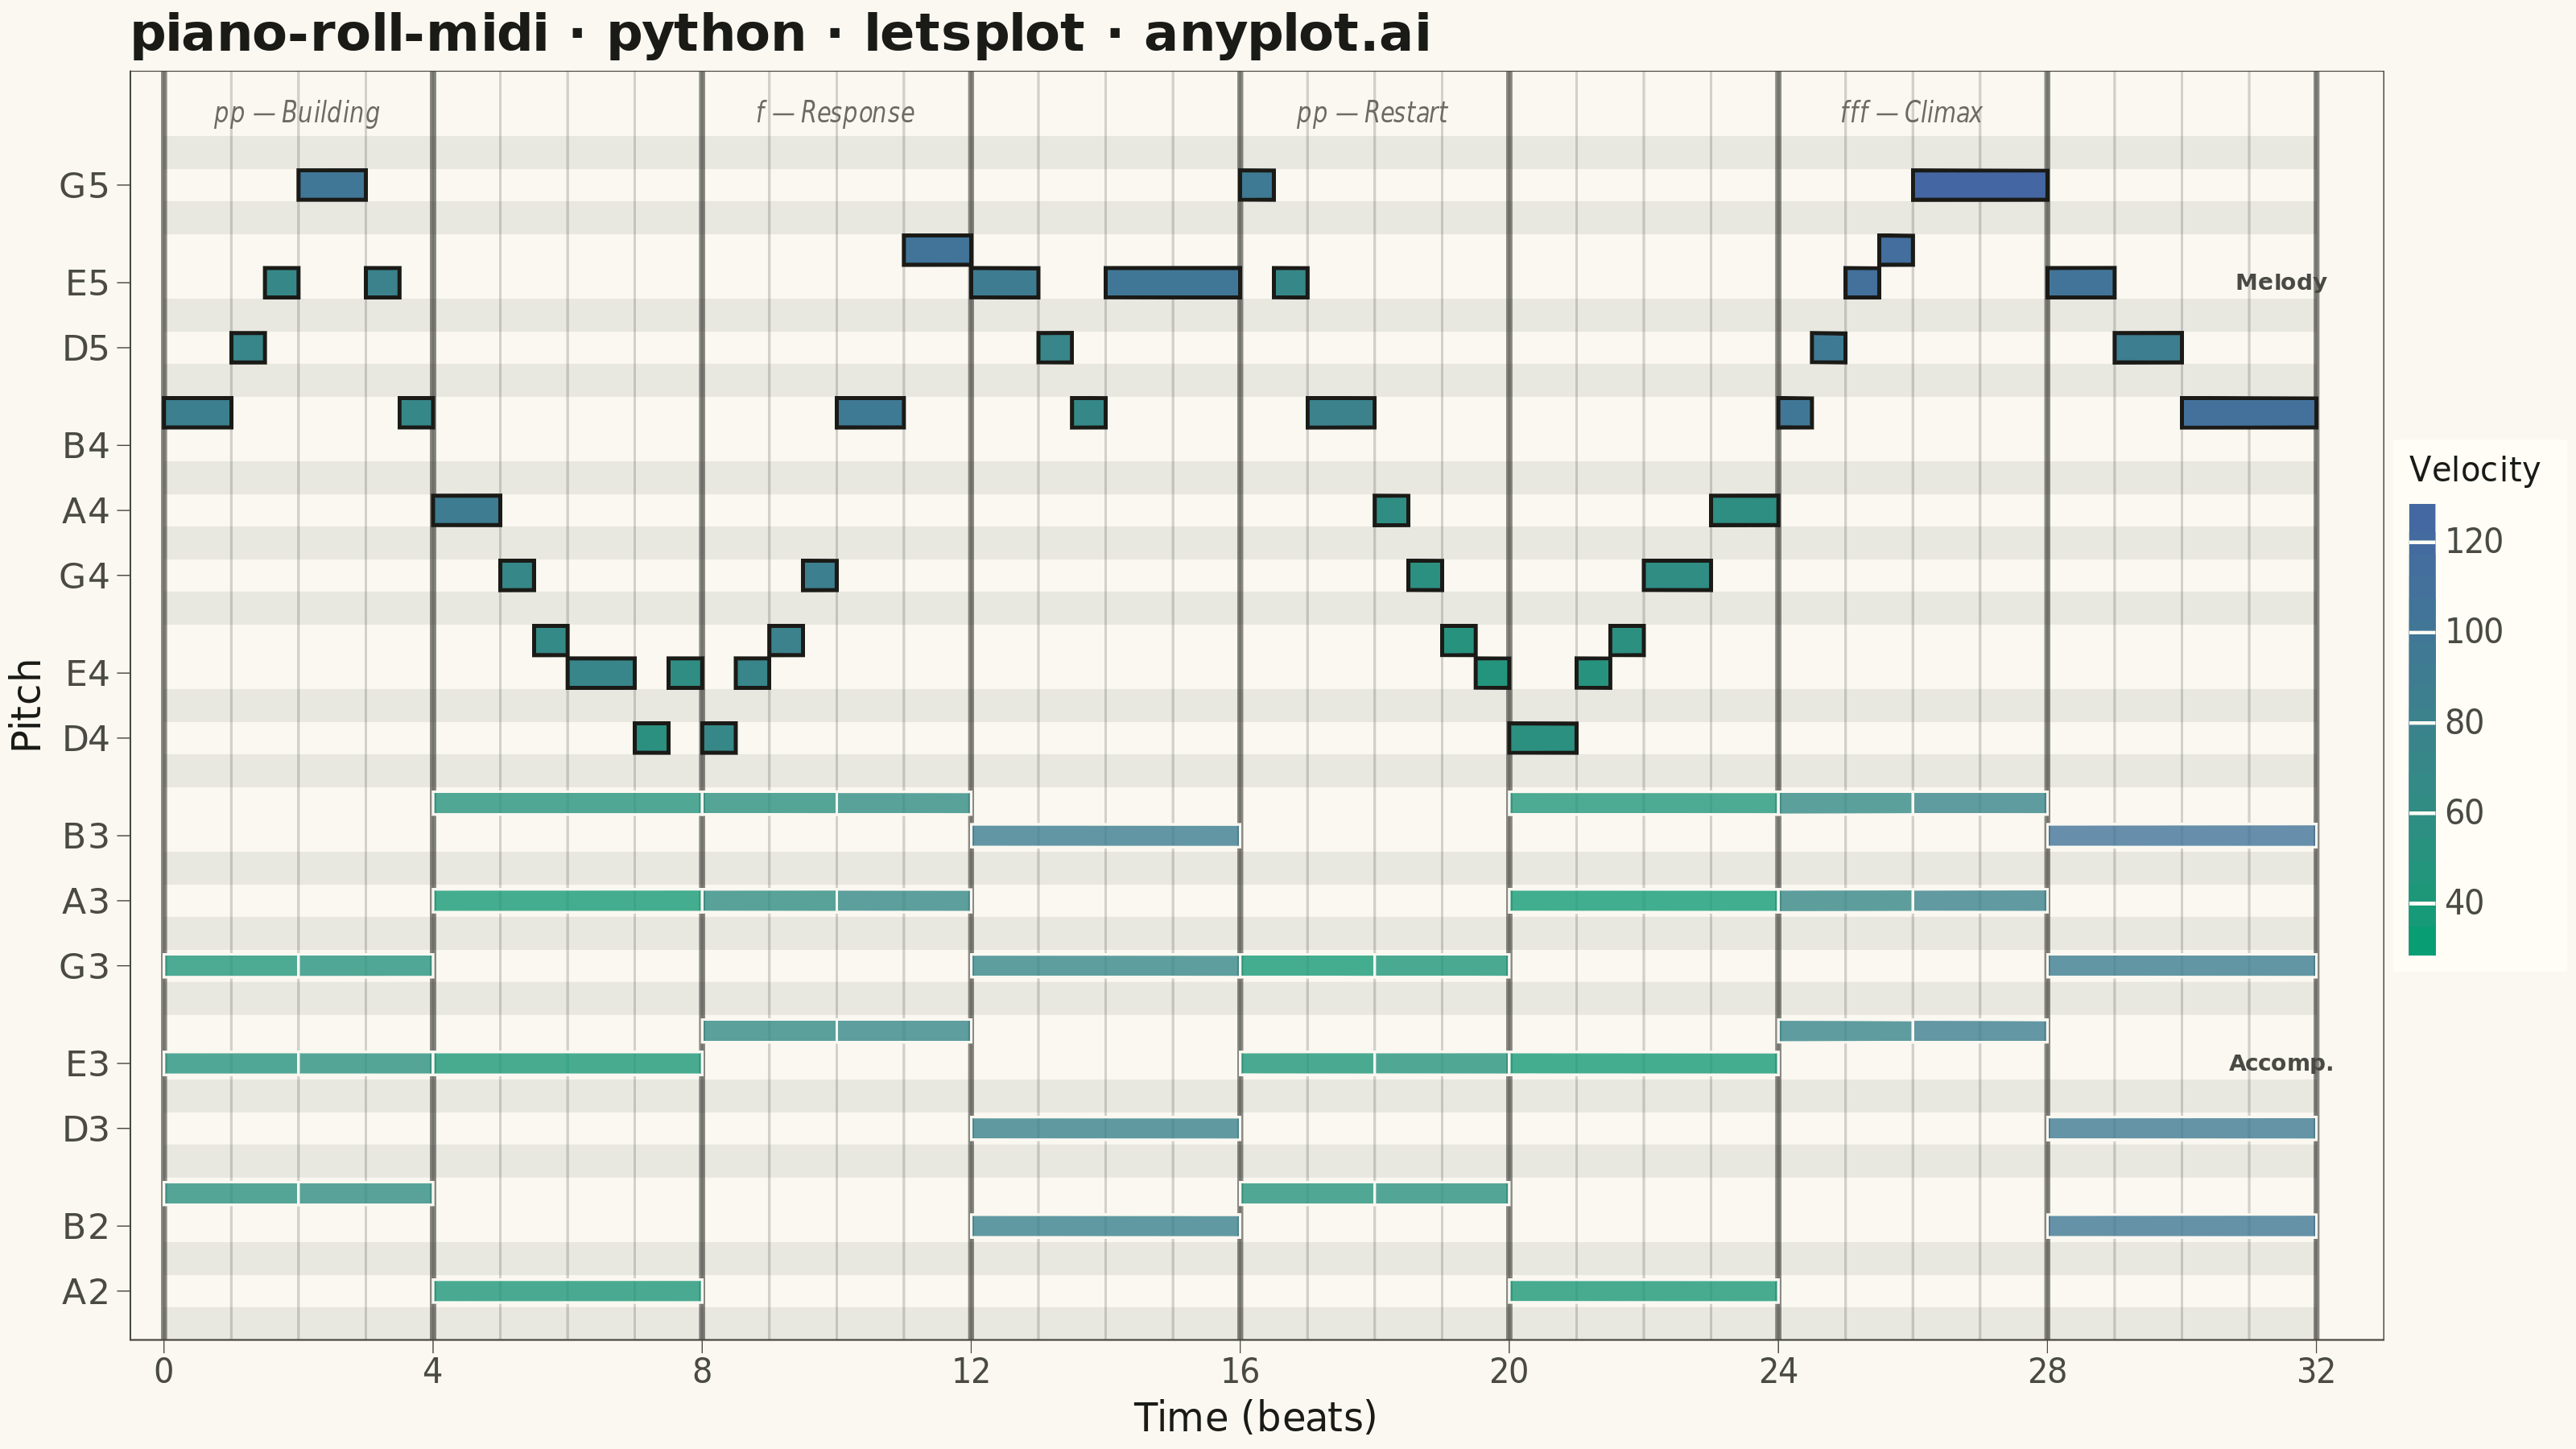
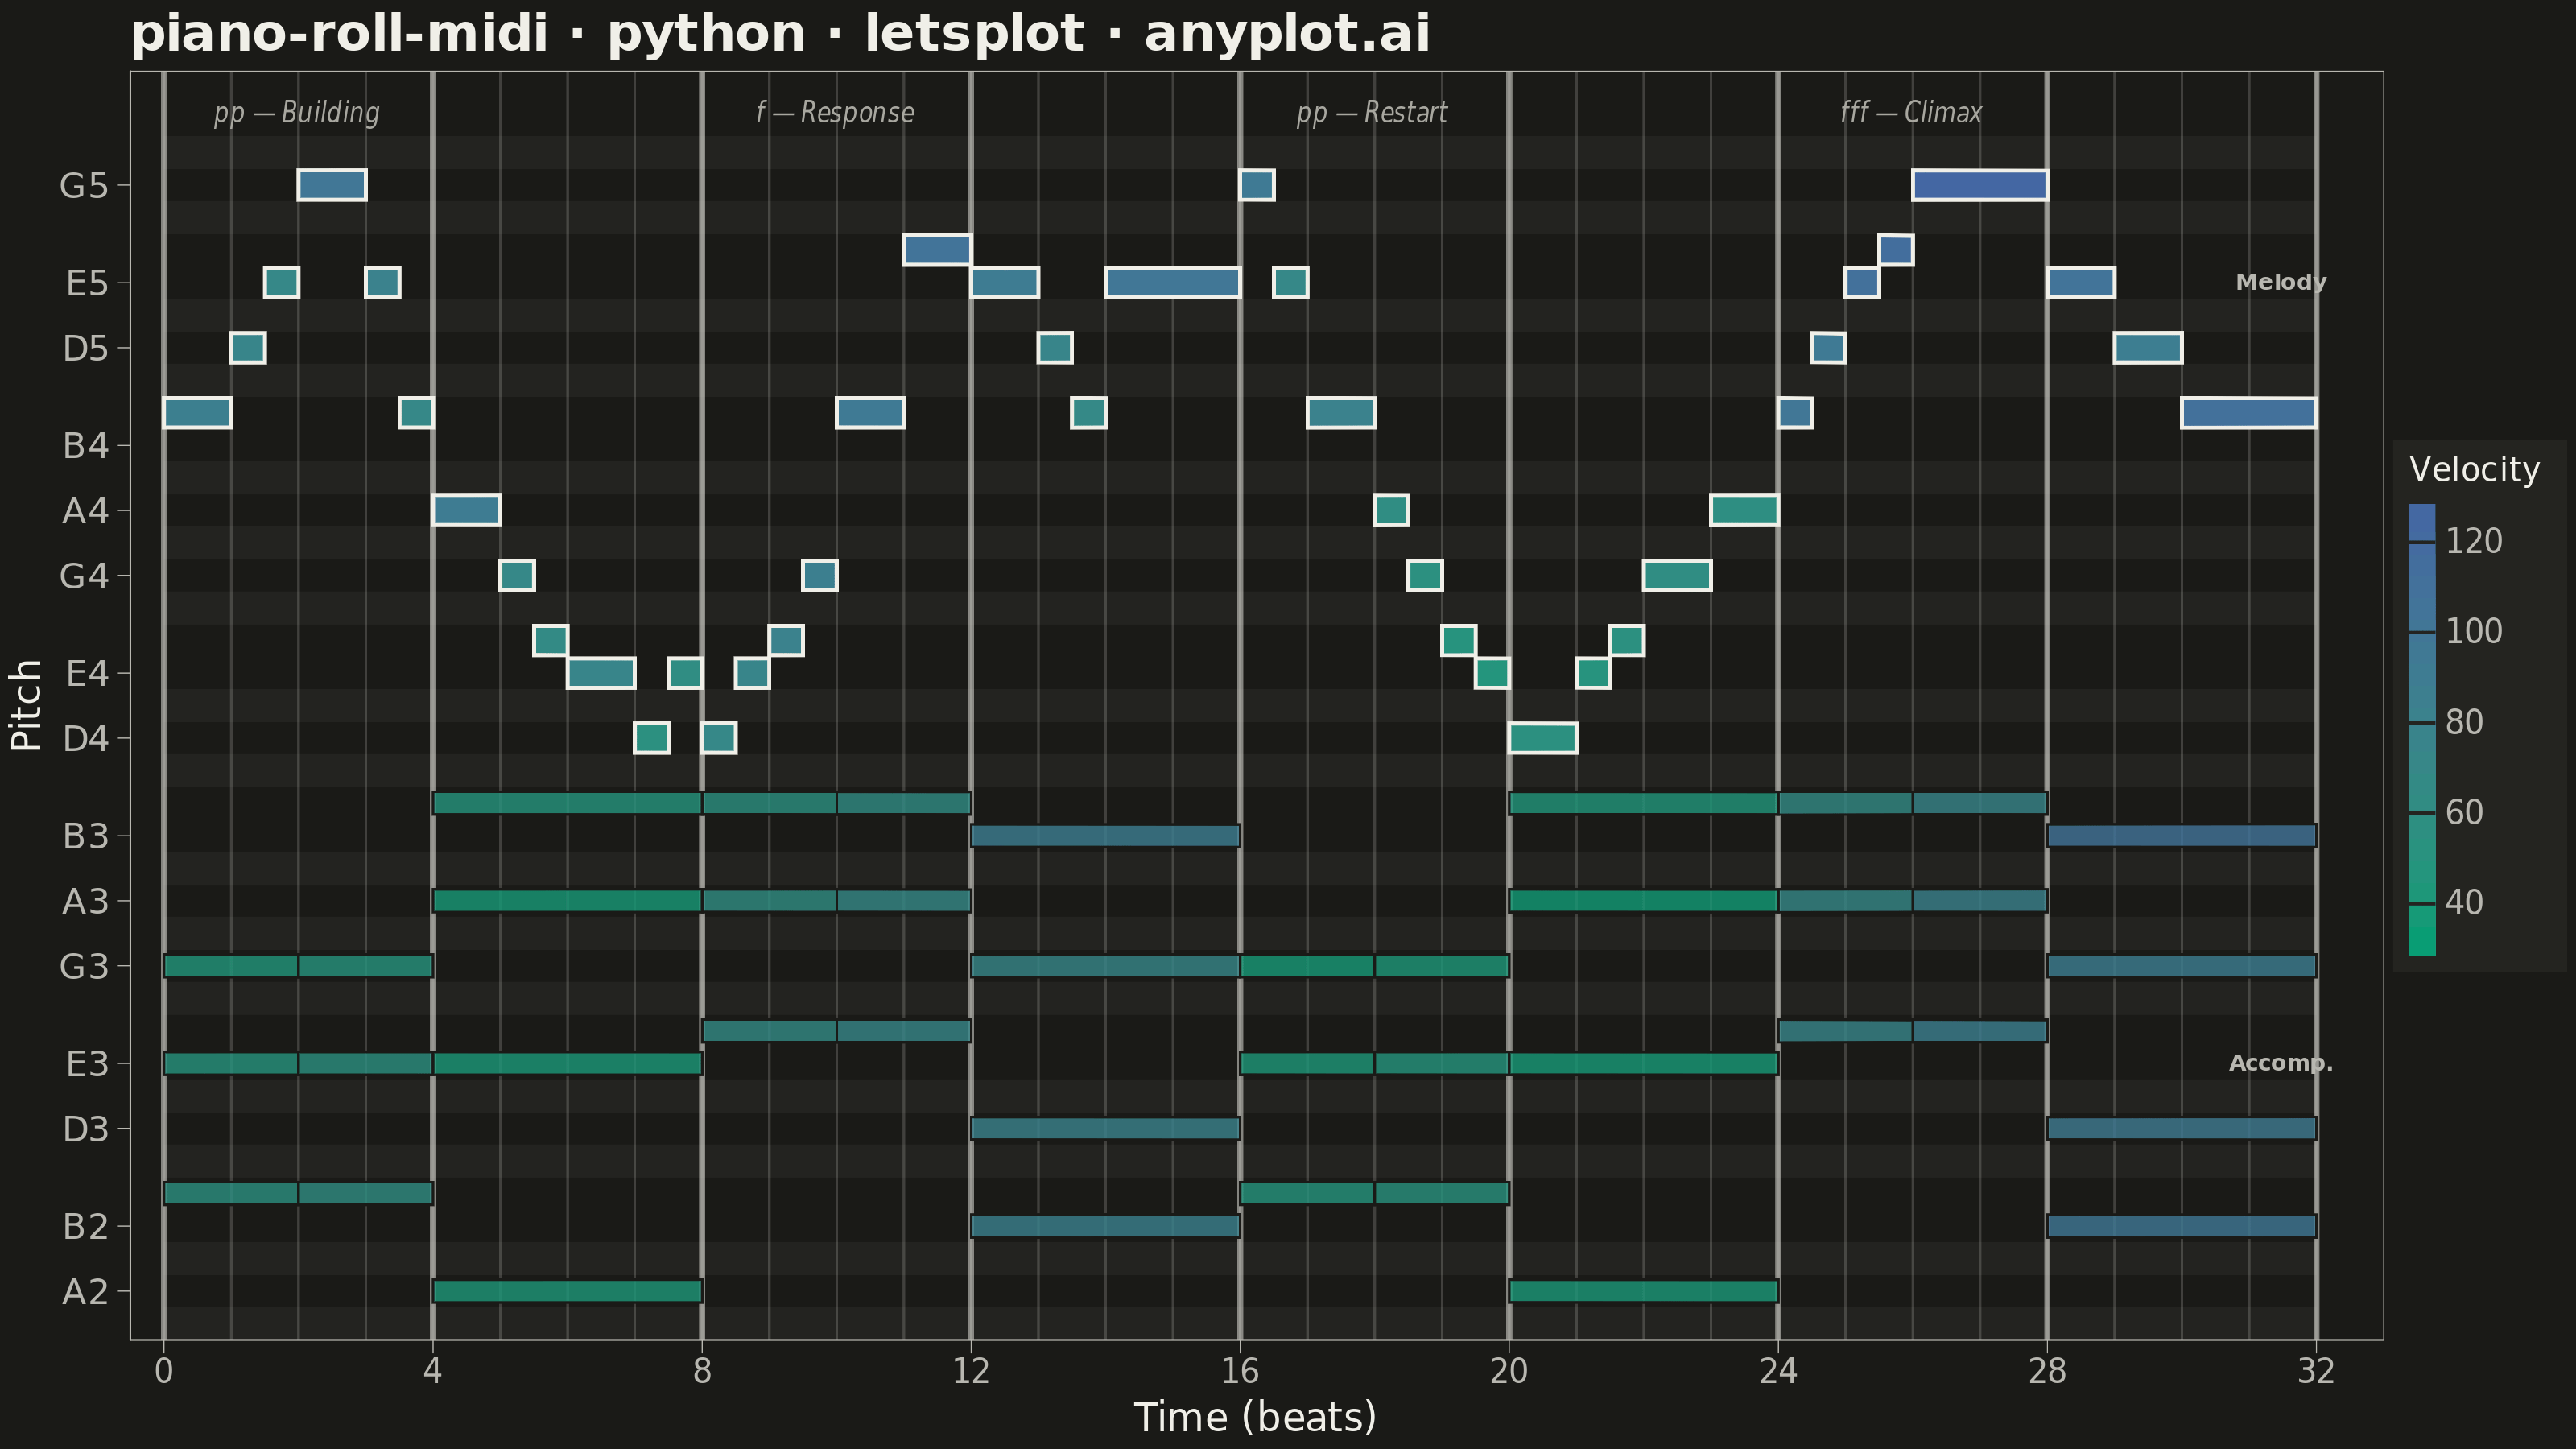
A grid-based visualization of musical notes over time, as seen in digital audio workstations (DAWs). Each note is represented as a horizontal rectangle positioned by pitch (y-axis) and time (x-axis), with bar length indicating note duration and color indicating velocity (dynamics). The background alternates between white and dark rows to mirror piano keyboard layout, with vertical grid lines marking beats and measures.
""" anyplot.ai
piano-roll-midi: MIDI Piano Roll Visualization
Library: letsplot 4.10.1 | Python 3.13.13
Quality: 90/100 | Updated: 2026-06-03
"""

import os
import shutil

import numpy as np
import pandas as pd
from lets_plot import *
from lets_plot.export import ggsave as export_ggsave


LetsPlot.setup_html()

# Theme tokens (Imprint palette — theme-adaptive chrome)
THEME = os.getenv("ANYPLOT_THEME", "light")
PAGE_BG = "#FAF8F1" if THEME == "light" else "#1A1A17"
ELEVATED_BG = "#FFFDF6" if THEME == "light" else "#242420"
INK = "#1A1A17" if THEME == "light" else "#F0EFE8"
INK_SOFT = "#4A4A44" if THEME == "light" else "#B8B7B0"
INK_MUTED = "#6B6A63" if THEME == "light" else "#A8A79F"

# Black key row background — slightly offset from PAGE_BG for subtle contrast
BLACK_KEY_BG = "#E4E3DC" if THEME == "light" else "#252522"
BEAT_LINE = "rgba(26,26,23,0.18)" if THEME == "light" else "rgba(240,239,232,0.18)"
MEASURE_LINE = "rgba(26,26,23,0.50)" if THEME == "light" else "rgba(240,239,232,0.50)"

# Data — Cmaj–Am–F–G chord progression with melody, 8 measures
np.random.seed(42)

black_semitones = {1, 3, 6, 8, 10}
black_key_pitches = {p for p in range(0, 128) if (p % 12) in black_semitones}

chords = [
    # Measure 1: C major — building (half notes)
    (0, 2, [48, 52, 55], [55, 50, 45]),
    (2, 2, [48, 52, 55], [60, 55, 50]),
    # Measure 2: A minor — softer
    (4, 4, [45, 52, 57, 60], [42, 40, 38, 48]),
    # Measure 3: F major — growing (half notes)
    (8, 2, [53, 57, 60], [65, 60, 55]),
    (10, 2, [53, 57, 60], [72, 68, 62]),
    # Measure 4: G major — strong
    (12, 4, [47, 50, 55, 59], [82, 78, 72, 88]),
    # Measure 5: C major — restart softer (half notes)
    (16, 2, [48, 52, 55], [48, 42, 38]),
    (18, 2, [48, 52, 55], [52, 48, 42]),
    # Measure 6: A minor — quiet
    (20, 4, [45, 52, 57, 60], [40, 38, 35, 45]),
    # Measure 7: F major — building to climax (half notes)
    (24, 2, [53, 57, 60], [75, 70, 65]),
    (26, 2, [53, 57, 60], [85, 80, 75]),
    # Measure 8: G major — fortissimo resolve
    (28, 4, [47, 50, 55, 59], [98, 92, 88, 105]),
]

melody_notes = [
    (0, 1, 72, 85),
    (1, 0.5, 74, 75),
    (1.5, 0.5, 76, 70),
    (2, 1, 79, 100),
    (3, 0.5, 76, 80),
    (3.5, 0.5, 72, 70),
    (4, 1, 69, 90),
    (5, 0.5, 67, 70),
    (5.5, 0.5, 65, 65),
    (6, 1, 64, 75),
    (7, 0.5, 62, 55),
    (7.5, 0.5, 64, 60),
    (8, 0.5, 62, 70),
    (8.5, 0.5, 64, 75),
    (9, 0.5, 65, 80),
    (9.5, 0.5, 67, 85),
    (10, 1, 72, 95),
    (11, 1, 77, 105),
    (12, 1, 76, 90),
    (13, 0.5, 74, 75),
    (13.5, 0.5, 72, 68),
    (14, 2, 76, 100),
    (16, 0.5, 79, 95),
    (16.5, 0.5, 76, 70),
    (17, 1, 72, 80),
    (18, 0.5, 69, 60),
    (18.5, 0.5, 67, 55),
    (19, 0.5, 65, 50),
    (19.5, 0.5, 64, 48),
    (20, 1, 62, 55),
    (21, 0.5, 64, 50),
    (21.5, 0.5, 65, 55),
    (22, 1, 67, 60),
    (23, 1, 69, 58),
    (24, 0.5, 72, 100),
    (24.5, 0.5, 74, 95),
    (25, 0.5, 76, 110),
    (25.5, 0.5, 77, 115),
    (26, 2, 79, 127),
    (28, 1, 76, 105),
    (29, 1, 74, 88),
    (30, 2, 72, 110),
]

starts, durations, pitches, velocities, roles = [], [], [], [], []

for beat, dur, chord_pitches, chord_vels in chords:
    for p, v in zip(chord_pitches, chord_vels, strict=True):
        starts.append(beat)
        durations.append(dur)
        pitches.append(p)
        velocities.append(min(v, 127))
        roles.append("Accompaniment")

for beat, dur, pitch, vel in melody_notes:
    starts.append(beat)
    durations.append(dur)
    pitches.append(pitch)
    velocities.append(min(vel, 127))
    roles.append("Melody")

df = pd.DataFrame({"start": starts, "duration": durations, "pitch": pitches, "velocity": velocities, "role": roles})
df["end"] = df["start"] + df["duration"]

# Melody notes slightly taller for visual hierarchy
df["pitch_top"] = np.where(df["role"] == "Melody", df["pitch"] + 0.45, df["pitch"] + 0.35)
df["pitch_bottom"] = np.where(df["role"] == "Melody", df["pitch"] - 0.45, df["pitch"] - 0.35)

note_names_all = ["C", "C#", "D", "D#", "E", "F", "F#", "G", "G#", "A", "A#", "B"]
df["note_name"] = [f"{note_names_all[p % 12]}{p // 12 - 1}" for p in df["pitch"]]

pitch_min = df["pitch"].min() - 1
pitch_max = df["pitch"].max() + 1

# Black key row shading across full width
all_pitches = list(range(pitch_min, pitch_max + 1))
black_pitches_in_range = [p for p in all_pitches if p in black_key_pitches]
bg_rows = pd.DataFrame(
    {
        "pitch_bottom": [p - 0.5 for p in black_pitches_in_range],
        "pitch_top": [p + 0.5 for p in black_pitches_in_range],
        "xmin": [0.0] * len(black_pitches_in_range),
        "xmax": [32.0] * len(black_pitches_in_range),
    }
)

# Y-axis labels — white keys only
y_breaks = [p for p in all_pitches if p not in black_key_pitches]
white_note_letters = {0: "C", 2: "D", 4: "E", 5: "F", 7: "G", 9: "A", 11: "B"}
y_labels = [f"{white_note_letters[p % 12]}{p // 12 - 1}" for p in y_breaks]

beat_lines = pd.DataFrame({"x": [float(b) for b in range(0, 33)]})
measure_lines = pd.DataFrame({"x": [float(m) for m in range(0, 33, 4)]})

df_accomp = df[df["role"] == "Accompaniment"].copy()
df_melody = df[df["role"] == "Melody"].copy()

sections = pd.DataFrame(
    {
        "x": [2.0, 10.0, 18.0, 26.0],
        "y": [pitch_max + 1.2] * 4,
        "label": ["pp — Building", "f — Response", "pp — Restart", "fff — Climax"],
    }
)

role_labels = pd.DataFrame({"x": [31.5, 31.5], "y": [76.0, 52.0], "label": ["Melody", "Accomp."]})

title = "piano-roll-midi · python · letsplot · anyplot.ai"

# Plot
plot = (
    ggplot()
    # Black key row shading — stronger contrast than previous
    + geom_rect(
        data=bg_rows,
        mapping=aes(xmin="xmin", xmax="xmax", ymin="pitch_bottom", ymax="pitch_top"),
        fill=BLACK_KEY_BG,
        color="rgba(0,0,0,0)",
        alpha=0.8,
    )
    # Beat grid lines (subtle)
    + geom_vline(data=beat_lines, mapping=aes(xintercept="x"), color=BEAT_LINE, size=0.3)
    # Measure grid lines (stronger — mark bars)
    + geom_vline(data=measure_lines, mapping=aes(xintercept="x"), color=MEASURE_LINE, size=0.8)
    # Accompaniment notes — semi-transparent
    + geom_rect(
        data=df_accomp,
        mapping=aes(xmin="start", xmax="end", ymin="pitch_bottom", ymax="pitch_top", fill="velocity"),
        color=PAGE_BG,
        size=0.3,
        alpha=0.80,
        tooltips=layer_tooltips().line("@note_name").line("vel: @velocity").line("beat: @start — @end"),
    )
    # Melody notes — fully opaque, taller, dark border for hierarchy
    + geom_rect(
        data=df_melody,
        mapping=aes(xmin="start", xmax="end", ymin="pitch_bottom", ymax="pitch_top", fill="velocity"),
        color=INK,
        size=0.5,
        alpha=1.0,
        tooltips=layer_tooltips().line("@note_name").line("vel: @velocity").line("beat: @start — @end"),
    )
    # Section labels showing dynamic arc (pp → fff)
    + geom_text(data=sections, mapping=aes(x="x", y="y", label="label"), size=4, color=INK_MUTED, fontface="italic")
    # Role labels on right edge
    + geom_text(data=role_labels, mapping=aes(x="x", y="y", label="label"), size=3.5, color=INK_SOFT, fontface="bold")
    # Imprint sequential colormap — quiet (green) → loud (blue), single-polarity
    + scale_fill_gradient(
        low="#009E73",
        high="#4467A3",
        name="Velocity",
        limits=[30, 127],
        guide=guide_colorbar(barwidth=8, barheight=140),
    )
    + scale_x_continuous(name="Time (beats)", breaks=[0, 4, 8, 12, 16, 20, 24, 28, 32])
    + scale_y_continuous(name="Pitch", breaks=y_breaks, labels=y_labels)
    + coord_cartesian(xlim=[-0.5, 33], ylim=[pitch_min - 0.5, pitch_max + 2.5])
    + labs(title=title)
    + theme_minimal()
    + theme(
        plot_title=element_text(size=16, face="bold", color=INK),
        axis_title_x=element_text(size=12, color=INK),
        axis_title_y=element_text(size=12, color=INK),
        axis_text_x=element_text(size=10, color=INK_SOFT),
        axis_text_y=element_text(size=11, color=INK_SOFT),
        axis_line=element_line(color=INK_SOFT, size=0.5),
        axis_ticks=element_line(color=INK_SOFT, size=0.3),
        legend_title=element_text(size=10, color=INK),
        legend_text=element_text(size=10, color=INK_SOFT),
        legend_background=element_rect(fill=ELEVATED_BG, color=INK_SOFT),
        legend_position="right",
        panel_grid_major=element_blank(),
        panel_grid_minor=element_blank(),
        panel_background=element_rect(fill=PAGE_BG, color=INK_SOFT, size=0.3),
        plot_background=element_rect(fill=PAGE_BG, color=PAGE_BG),
    )
    + ggsize(800, 450)
)

# Save
export_ggsave(plot, filename=f"plot-{THEME}.png", path=".", scale=4)
export_ggsave(plot, filename=f"plot-{THEME}.html", path=".")

if os.path.exists("lets-plot-images"):
    shutil.rmtree("lets-plot-images")
Runnable source as JSON, for any HTTP client: https://api.anyplot.ai/specs/piano-roll-midi/letsplot/code. Any spec id and library id listed in llms-full.txt fit the same URL shape; every URL below is complete and callable.
{
  "spec_id": "piano-roll-midi",
  "language": "python",
  "library": "letsplot",
  "page": "https://anyplot.ai/piano-roll-midi/python/letsplot",
  "hub": "https://anyplot.ai/piano-roll-midi",
  "code_json": "https://api.anyplot.ai/specs/piano-roll-midi/letsplot/code",
  "spec_json": "https://api.anyplot.ai/specs/piano-roll-midi",
  "render_light_png": "https://storage.googleapis.com/anyplot-images/plots/piano-roll-midi/python/letsplot/plot-light.png",
  "render_dark_png": "https://storage.googleapis.com/anyplot-images/plots/piano-roll-midi/python/letsplot/plot-dark.png",
  "interactive_light_html": "https://storage.googleapis.com/anyplot-images/plots/piano-roll-midi/python/letsplot/plot-light.html",
  "interactive_dark_html": "https://storage.googleapis.com/anyplot-images/plots/piano-roll-midi/python/letsplot/plot-dark.html",
  "quality_score": 90.0,
  "license": "MIT",
  "guide": "https://anyplot.ai/llms.txt"
}
Part of MIDI Piano Roll Visualization on anyplot.ai.