The same plot in 14 other libraries — JavaScript: Chart.js, D3.js, Apache ECharts, MUI X Charts; Python: Altair, Bokeh, lets-plot, Matplotlib, Plotly, plotnine, Pygal, Seaborn; R: ggplot2; Julia: Makie.jl. Compare all 15 side by side: MIDI Piano Roll Visualization in Python, R, Julia and JavaScript.
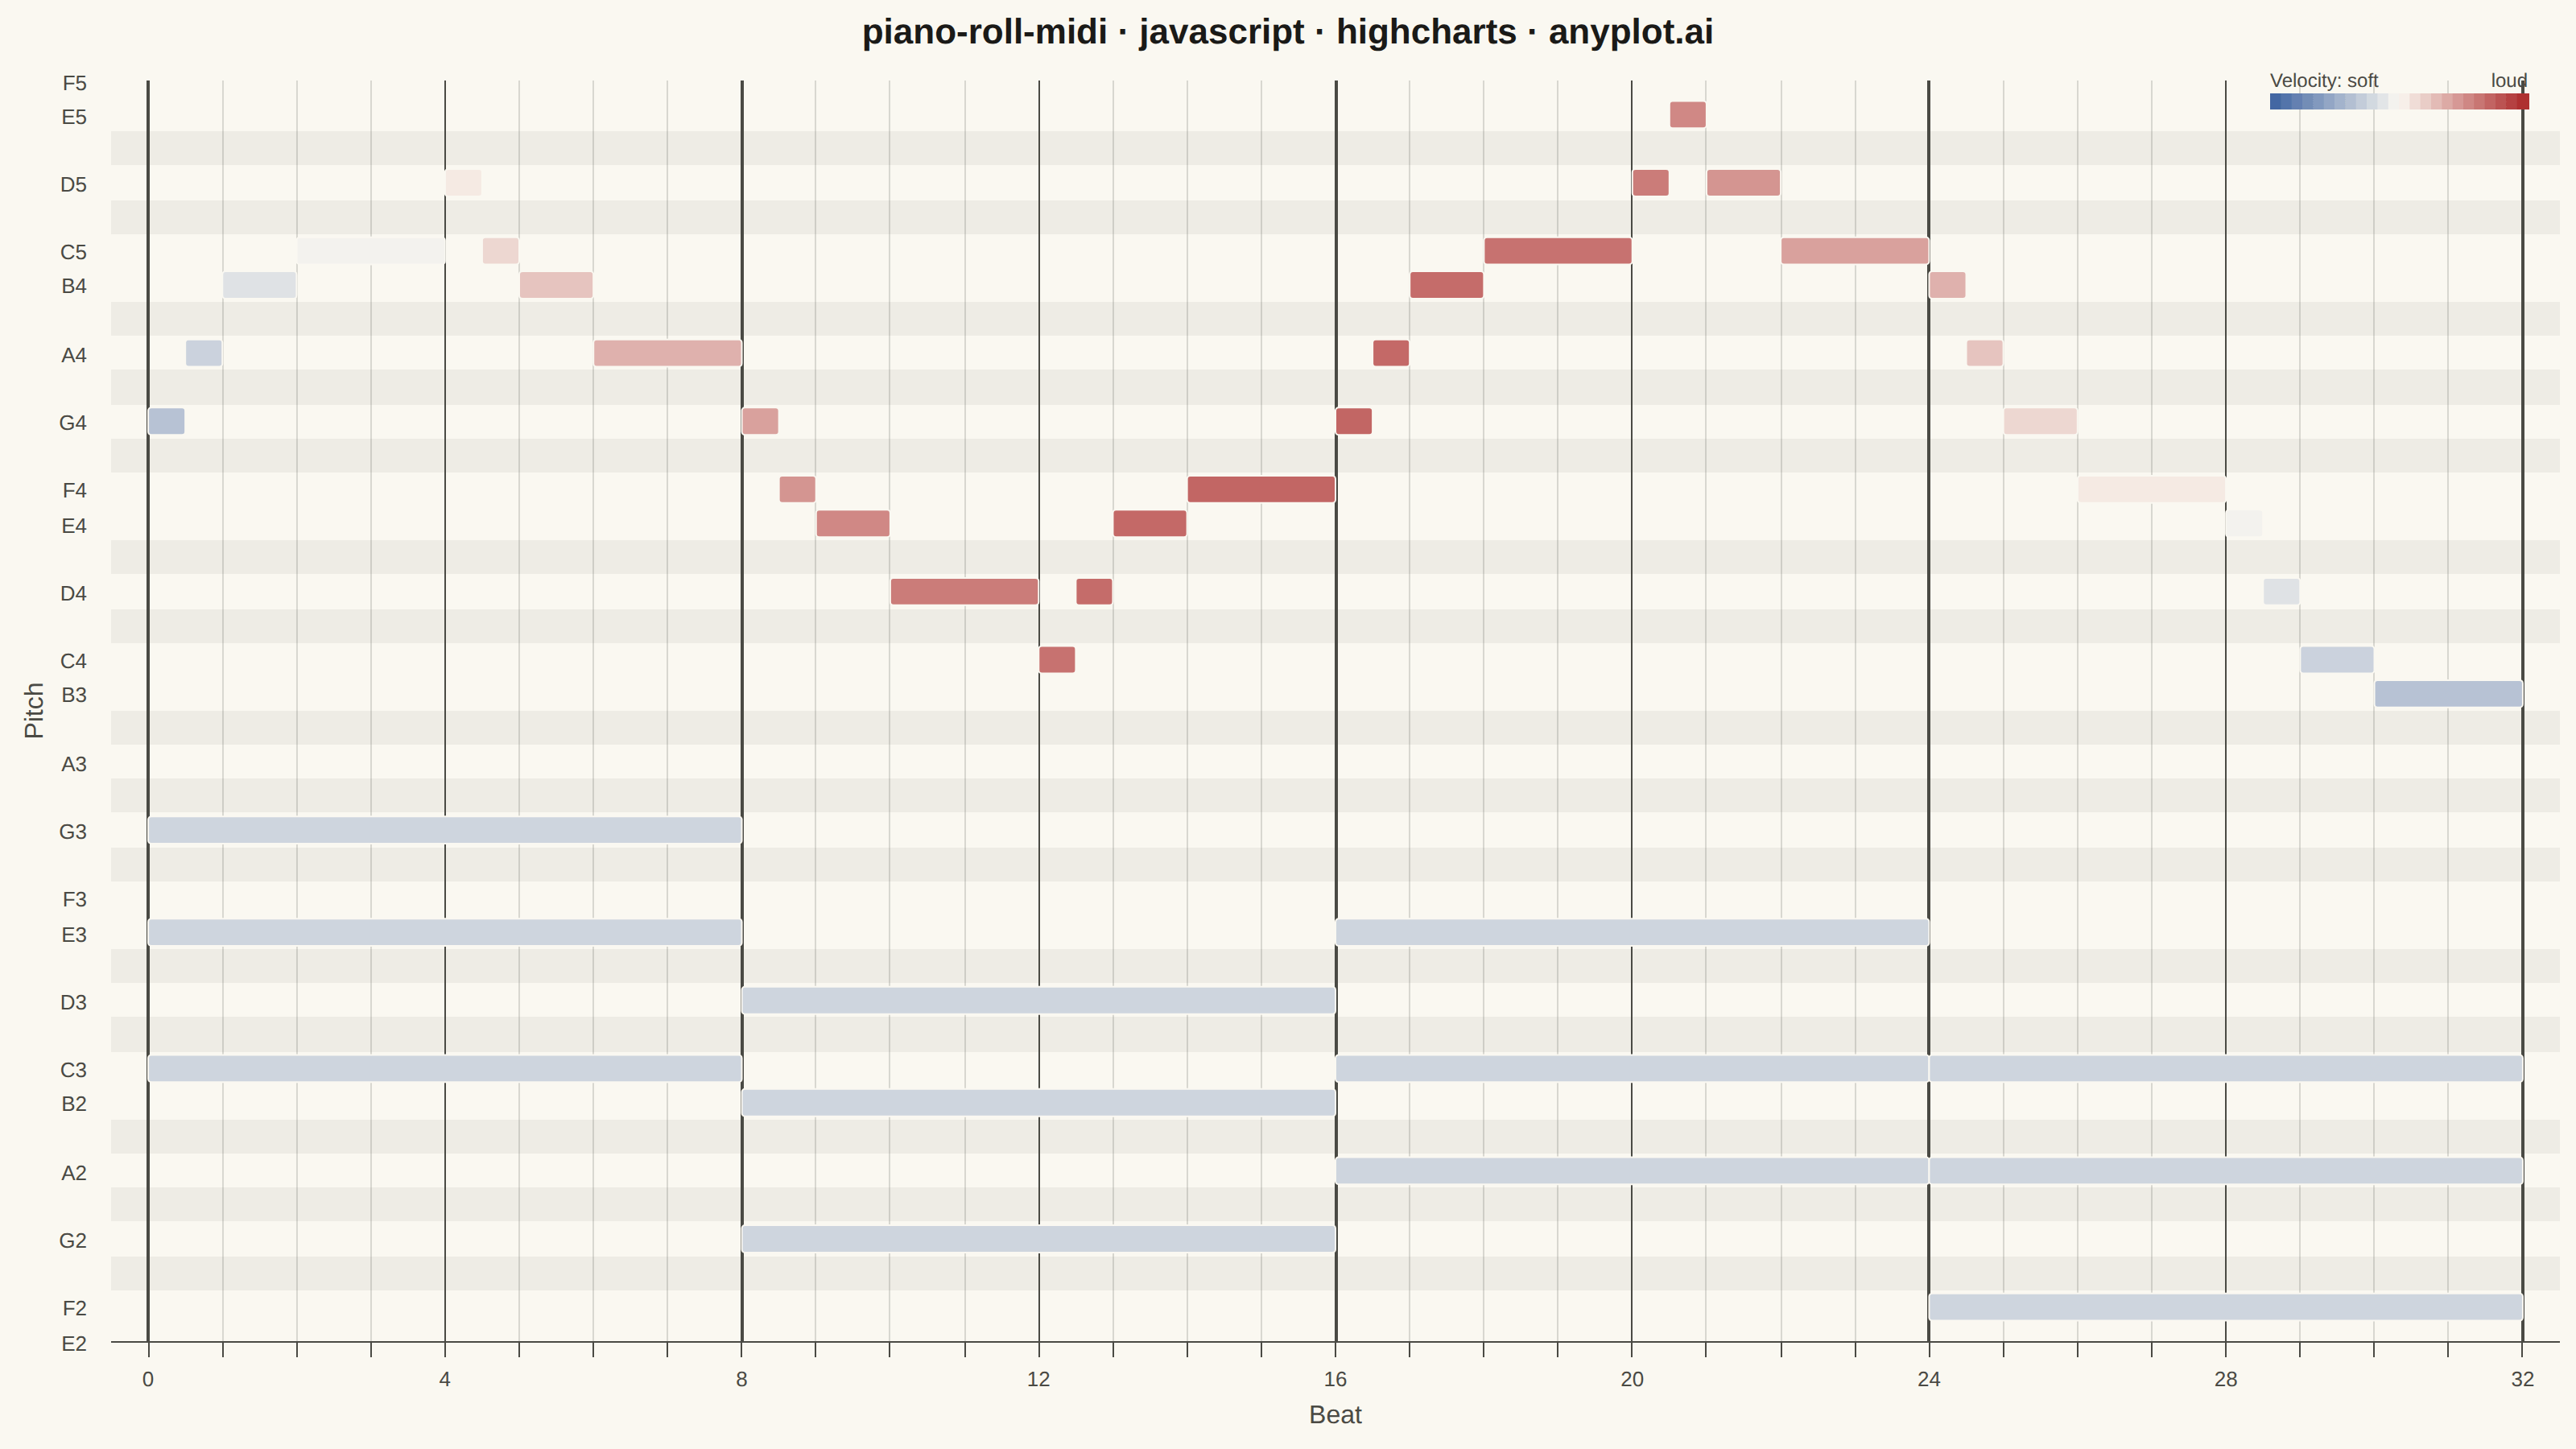
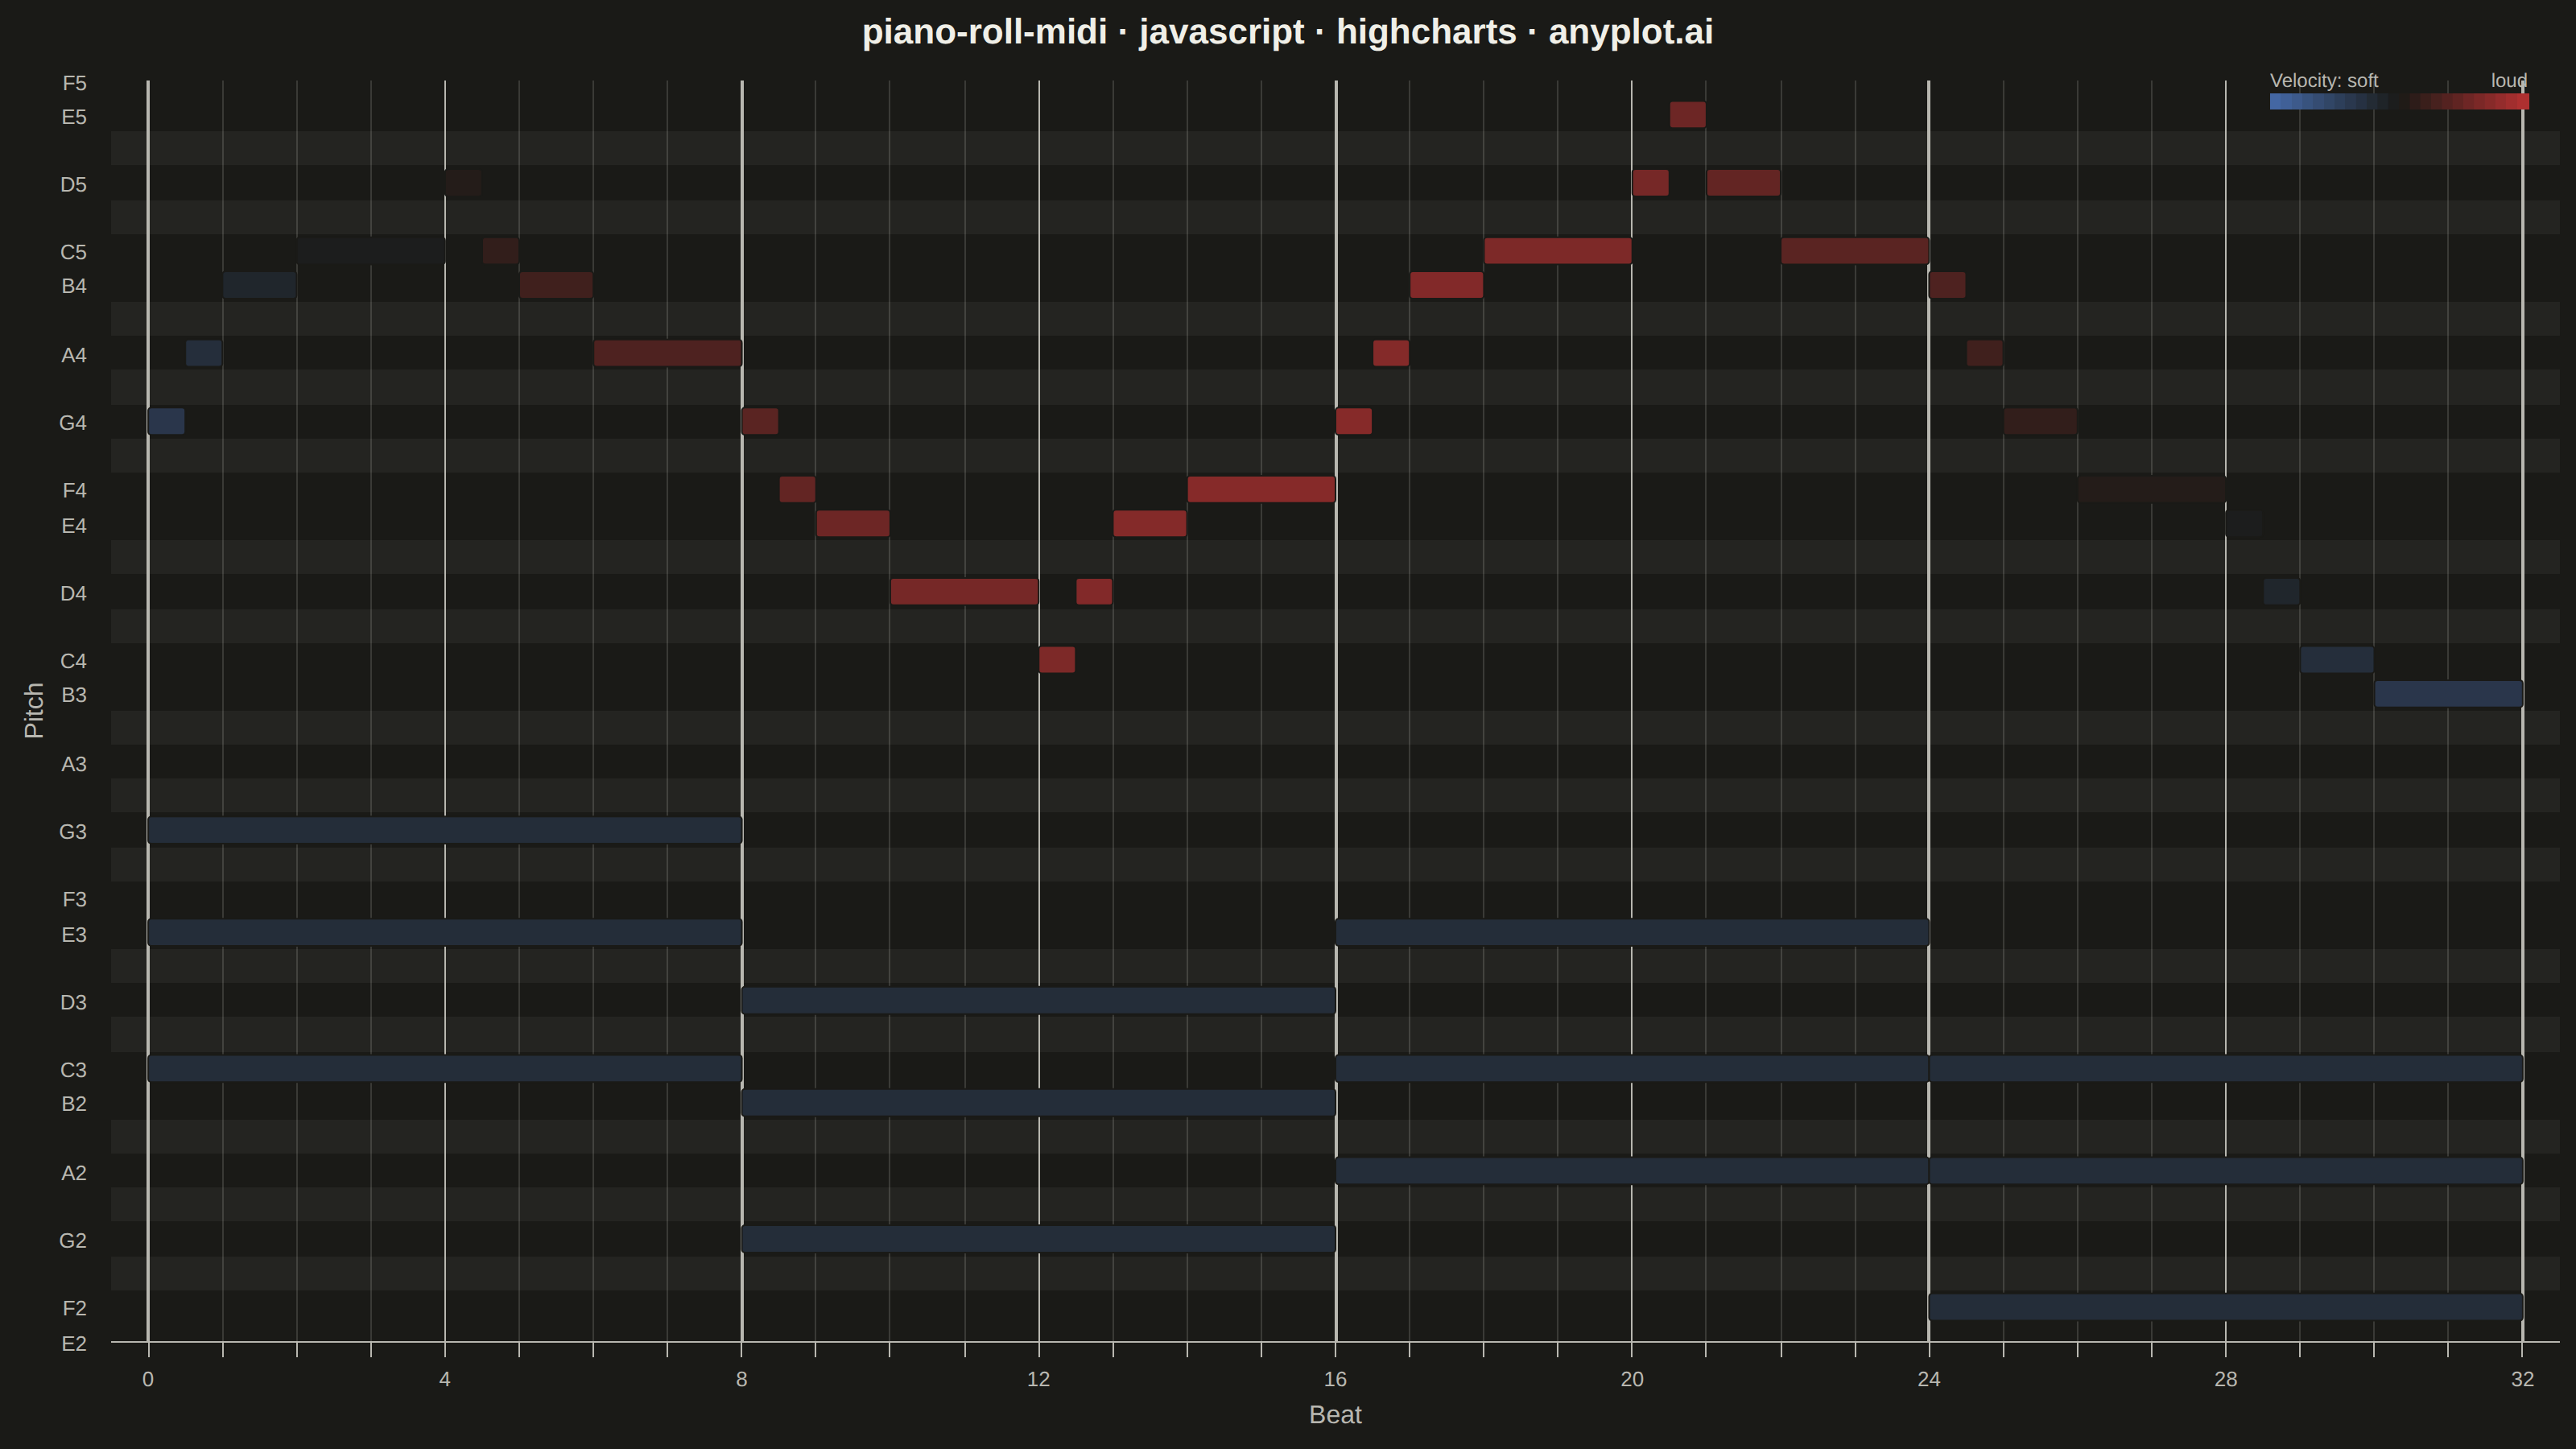
A grid-based visualization of musical notes over time, as seen in digital audio workstations (DAWs). Each note is represented as a horizontal rectangle positioned by pitch (y-axis) and time (x-axis), with bar length indicating note duration and color indicating velocity (dynamics). The background alternates between white and dark rows to mirror piano keyboard layout, with vertical grid lines marking beats and measures.
// anyplot.ai
// piano-roll-midi: MIDI Piano Roll Visualization
// Library: highcharts 12.6.0 | JavaScript 22.23.2
// Quality: 90/100 | Created: 2026-08-20

const t = window.ANYPLOT_TOKENS;

// --- Data: an 8-measure phrase (4/4, quarter = 1 beat) ----------------------
// Sustained chord pad (soft, low register) + a scale-wise melody on top.
const BEATS_PER_MEASURE = 4;
const MEASURES = 8;
const TOTAL_BEATS = BEATS_PER_MEASURE * MEASURES;

const chordPad = [
  { start: 0, notes: [48, 52, 55] }, // C major  (C3 E3 G3)
  { start: 8, notes: [43, 47, 50] }, // G major  (G2 B2 D3)
  { start: 16, notes: [45, 48, 52] }, // A minor (A2 C3 E3)
  { start: 24, notes: [41, 45, 48] }, // F major (F2 A2 C3)
];

const melodyPitches = [
  67, 69, 71, 72, 74, 72, 71, 69, 67, 65, 64, 62, 60, 62, 64, 65, 67, 69, 71,
  72, 74, 76, 74, 72, 71, 69, 67, 65, 64, 62, 60, 59,
];
const melodyDurations = [0.5, 0.5, 1, 2]; // repeats every 4-beat measure

const notes = [];
chordPad.forEach((chord) => {
  chord.notes.forEach((pitch) => {
    notes.push({ start: chord.start, duration: 8, pitch, velocity: 48 });
  });
});
let cursor = 0;
melodyPitches.forEach((pitch, i) => {
  const duration = melodyDurations[i % melodyDurations.length];
  const velocity = Math.round(40 + 70 * Math.sin((Math.PI * i) / (melodyPitches.length - 1)));
  notes.push({ start: cursor, duration, pitch, velocity });
  cursor += duration;
});

const minPitch = Math.min(...notes.map((n) => n.pitch));
const maxPitch = Math.max(...notes.map((n) => n.pitch));

// --- Helpers -----------------------------------------------------------------
const NOTE_NAMES = ["C", "C#", "D", "D#", "E", "F", "F#", "G", "G#", "A", "A#", "B"];
const BLACK_KEY_CLASSES = [1, 3, 6, 8, 10];

function noteName(pitch) {
  const octave = Math.floor(pitch / 12) - 1;
  return NOTE_NAMES[pitch % 12] + octave;
}

function hexToRgb(hex) {
  const n = parseInt(hex.slice(1), 16);
  return [(n >> 16) & 255, (n >> 8) & 255, n & 255];
}

function lerpColor(hexA, hexB, frac) {
  const a = hexToRgb(hexA);
  const b = hexToRgb(hexB);
  const c = a.map((v, i) => Math.round(v + (b[i] - v) * frac));
  return `rgb(${c[0]}, ${c[1]}, ${c[2]})`;
}

const [inkR, inkG, inkB] = hexToRgb(t.ink);
const blackKeyRowFill = `rgba(${inkR}, ${inkG}, ${inkB}, 0.05)`;

// velocity → imprint_div: soft (low) is blue, loud (high) is red
function velocityColor(velocity) {
  const frac = velocity / 127;
  return frac < 0.5
    ? lerpColor(t.div[2], t.div[1], frac / 0.5)
    : lerpColor(t.div[1], t.div[0], (frac - 0.5) / 0.5);
}

// --- Chart ---------------------------------------------------------------
Highcharts.chart("container", {
  chart: {
    type: "scatter",
    backgroundColor: "transparent",
    animation: false,
    style: { fontFamily: "inherit" },
    events: {
      load: function () {
        const chart = this;
        const xAxis = chart.xAxis[0];
        const yAxis = chart.yAxis[0];
        const rowHalf = 0.4;

        // Notes as rectangles positioned by real time/pitch coordinates
        notes.forEach((note) => {
          const x1 = xAxis.toPixels(note.start, false);
          const x2 = xAxis.toPixels(note.start + note.duration, false);
          const y1 = yAxis.toPixels(note.pitch - rowHalf, false);
          const y2 = yAxis.toPixels(note.pitch + rowHalf, false);
          chart.renderer
            .rect(Math.min(x1, x2), Math.min(y1, y2), Math.abs(x2 - x1), Math.abs(y2 - y1), 2)
            .attr({
              fill: velocityColor(note.velocity),
              stroke: t.pageBg,
              "stroke-width": 1,
              zIndex: 5,
            })
            .add();
        });

        // Compact velocity legend (top-right, inside the plot area)
        const legendW = 160;
        const legendX = xAxis.left + xAxis.width - legendW - 20;
        const legendY = chart.plotTop + 8;
        const steps = 24;
        for (let i = 0; i < steps; i++) {
          chart.renderer
            .rect(legendX + (i * legendW) / steps, legendY, legendW / steps + 1, 10)
            .attr({ fill: velocityColor((i / (steps - 1)) * 127), zIndex: 5 })
            .add();
        }
        chart.renderer
          .text("Velocity: soft", legendX, legendY - 4)
          .css({ color: t.inkSoft, fontSize: "12px" })
          .add();
        chart.renderer
          .text("loud", legendX + legendW, legendY - 4)
          .attr({ align: "right" })
          .css({ color: t.inkSoft, fontSize: "12px" })
          .add();
      },
    },
  },
  credits: { enabled: false },
  colors: t.palette,
  title: {
    text: "piano-roll-midi · javascript · highcharts · anyplot.ai",
    style: { color: t.ink, fontSize: "22px", fontWeight: "600" },
  },
  xAxis: {
    title: { text: "Beat", style: { color: t.inkSoft, fontSize: "16px" } },
    min: -0.5,
    max: TOTAL_BEATS + 0.5,
    tickInterval: 1,
    gridLineWidth: 1,
    gridLineColor: t.grid,
    lineColor: t.inkSoft,
    tickColor: t.inkSoft,
    labels: {
      style: { color: t.inkSoft, fontSize: "13px" },
      formatter: function () {
        return this.value % BEATS_PER_MEASURE === 0 ? String(this.value) : "";
      },
    },
    plotLines: Array.from({ length: MEASURES + 1 }, (_, m) => ({
      value: m * BEATS_PER_MEASURE,
      color: t.inkSoft,
      width: m % 2 === 0 ? 2 : 1,
      zIndex: 3,
    })),
  },
  yAxis: {
    title: { text: "Pitch", style: { color: t.inkSoft, fontSize: "16px" } },
    min: minPitch - 1,
    max: maxPitch + 1,
    tickInterval: 1,
    gridLineWidth: 0,
    lineColor: t.inkSoft,
    tickColor: t.inkSoft,
    labels: {
      style: { color: t.inkSoft, fontSize: "13px" },
      formatter: function () {
        return BLACK_KEY_CLASSES.includes(this.value % 12) ? "" : noteName(this.value);
      },
    },
    plotBands: Array.from(
      { length: maxPitch - minPitch + 3 },
      (_, i) => minPitch - 1 + i,
    ).map((pitch) => ({
      from: pitch - 0.5,
      to: pitch + 0.5,
      color: BLACK_KEY_CLASSES.includes(((pitch % 12) + 12) % 12) ? blackKeyRowFill : "transparent",
      zIndex: 1,
    })),
  },
  legend: { enabled: false },
  plotOptions: { series: { animation: false } },
  // Invisible anchor series: Highcharts only renders axis lines/labels/grid
  // for cartesian charts that carry data — the notes themselves are drawn as
  // custom rectangles (see load handler) since no core series type supports
  // floating time-ranged bars, so this anchor exists purely to establish the
  // real axis scale that those rectangles are positioned against.
  series: [
    {
      type: "scatter",
      data: notes.map((n) => [n.start + n.duration / 2, n.pitch]),
      marker: { enabled: false },
      enableMouseTracking: false,
      showInLegend: false,
    },
  ],
});
Runnable source as JSON, for any HTTP client: https://api.anyplot.ai/specs/piano-roll-midi/highcharts/code. Any spec id and library id listed in llms-full.txt fit the same URL shape; every URL below is complete and callable.
{
  "spec_id": "piano-roll-midi",
  "language": "javascript",
  "library": "highcharts",
  "page": "https://anyplot.ai/piano-roll-midi/javascript/highcharts",
  "hub": "https://anyplot.ai/piano-roll-midi",
  "code_json": "https://api.anyplot.ai/specs/piano-roll-midi/highcharts/code",
  "spec_json": "https://api.anyplot.ai/specs/piano-roll-midi",
  "render_light_png": "https://storage.googleapis.com/anyplot-images/plots/piano-roll-midi/javascript/highcharts/plot-light.png",
  "render_dark_png": "https://storage.googleapis.com/anyplot-images/plots/piano-roll-midi/javascript/highcharts/plot-dark.png",
  "interactive_light_html": "https://storage.googleapis.com/anyplot-images/plots/piano-roll-midi/javascript/highcharts/plot-light.html",
  "interactive_dark_html": "https://storage.googleapis.com/anyplot-images/plots/piano-roll-midi/javascript/highcharts/plot-dark.html",
  "quality_score": 90.0,
  "license": "MIT",
  "guide": "https://anyplot.ai/llms.txt"
}
Part of MIDI Piano Roll Visualization on anyplot.ai.