The same plot in 14 other libraries — JavaScript: Chart.js, D3.js, Apache ECharts, Highcharts; Python: Altair, Bokeh, lets-plot, Matplotlib, Plotly, plotnine, Pygal, Seaborn; R: ggplot2; Julia: Makie.jl. Compare all 15 side by side: MIDI Piano Roll Visualization in Python, R, Julia and JavaScript.
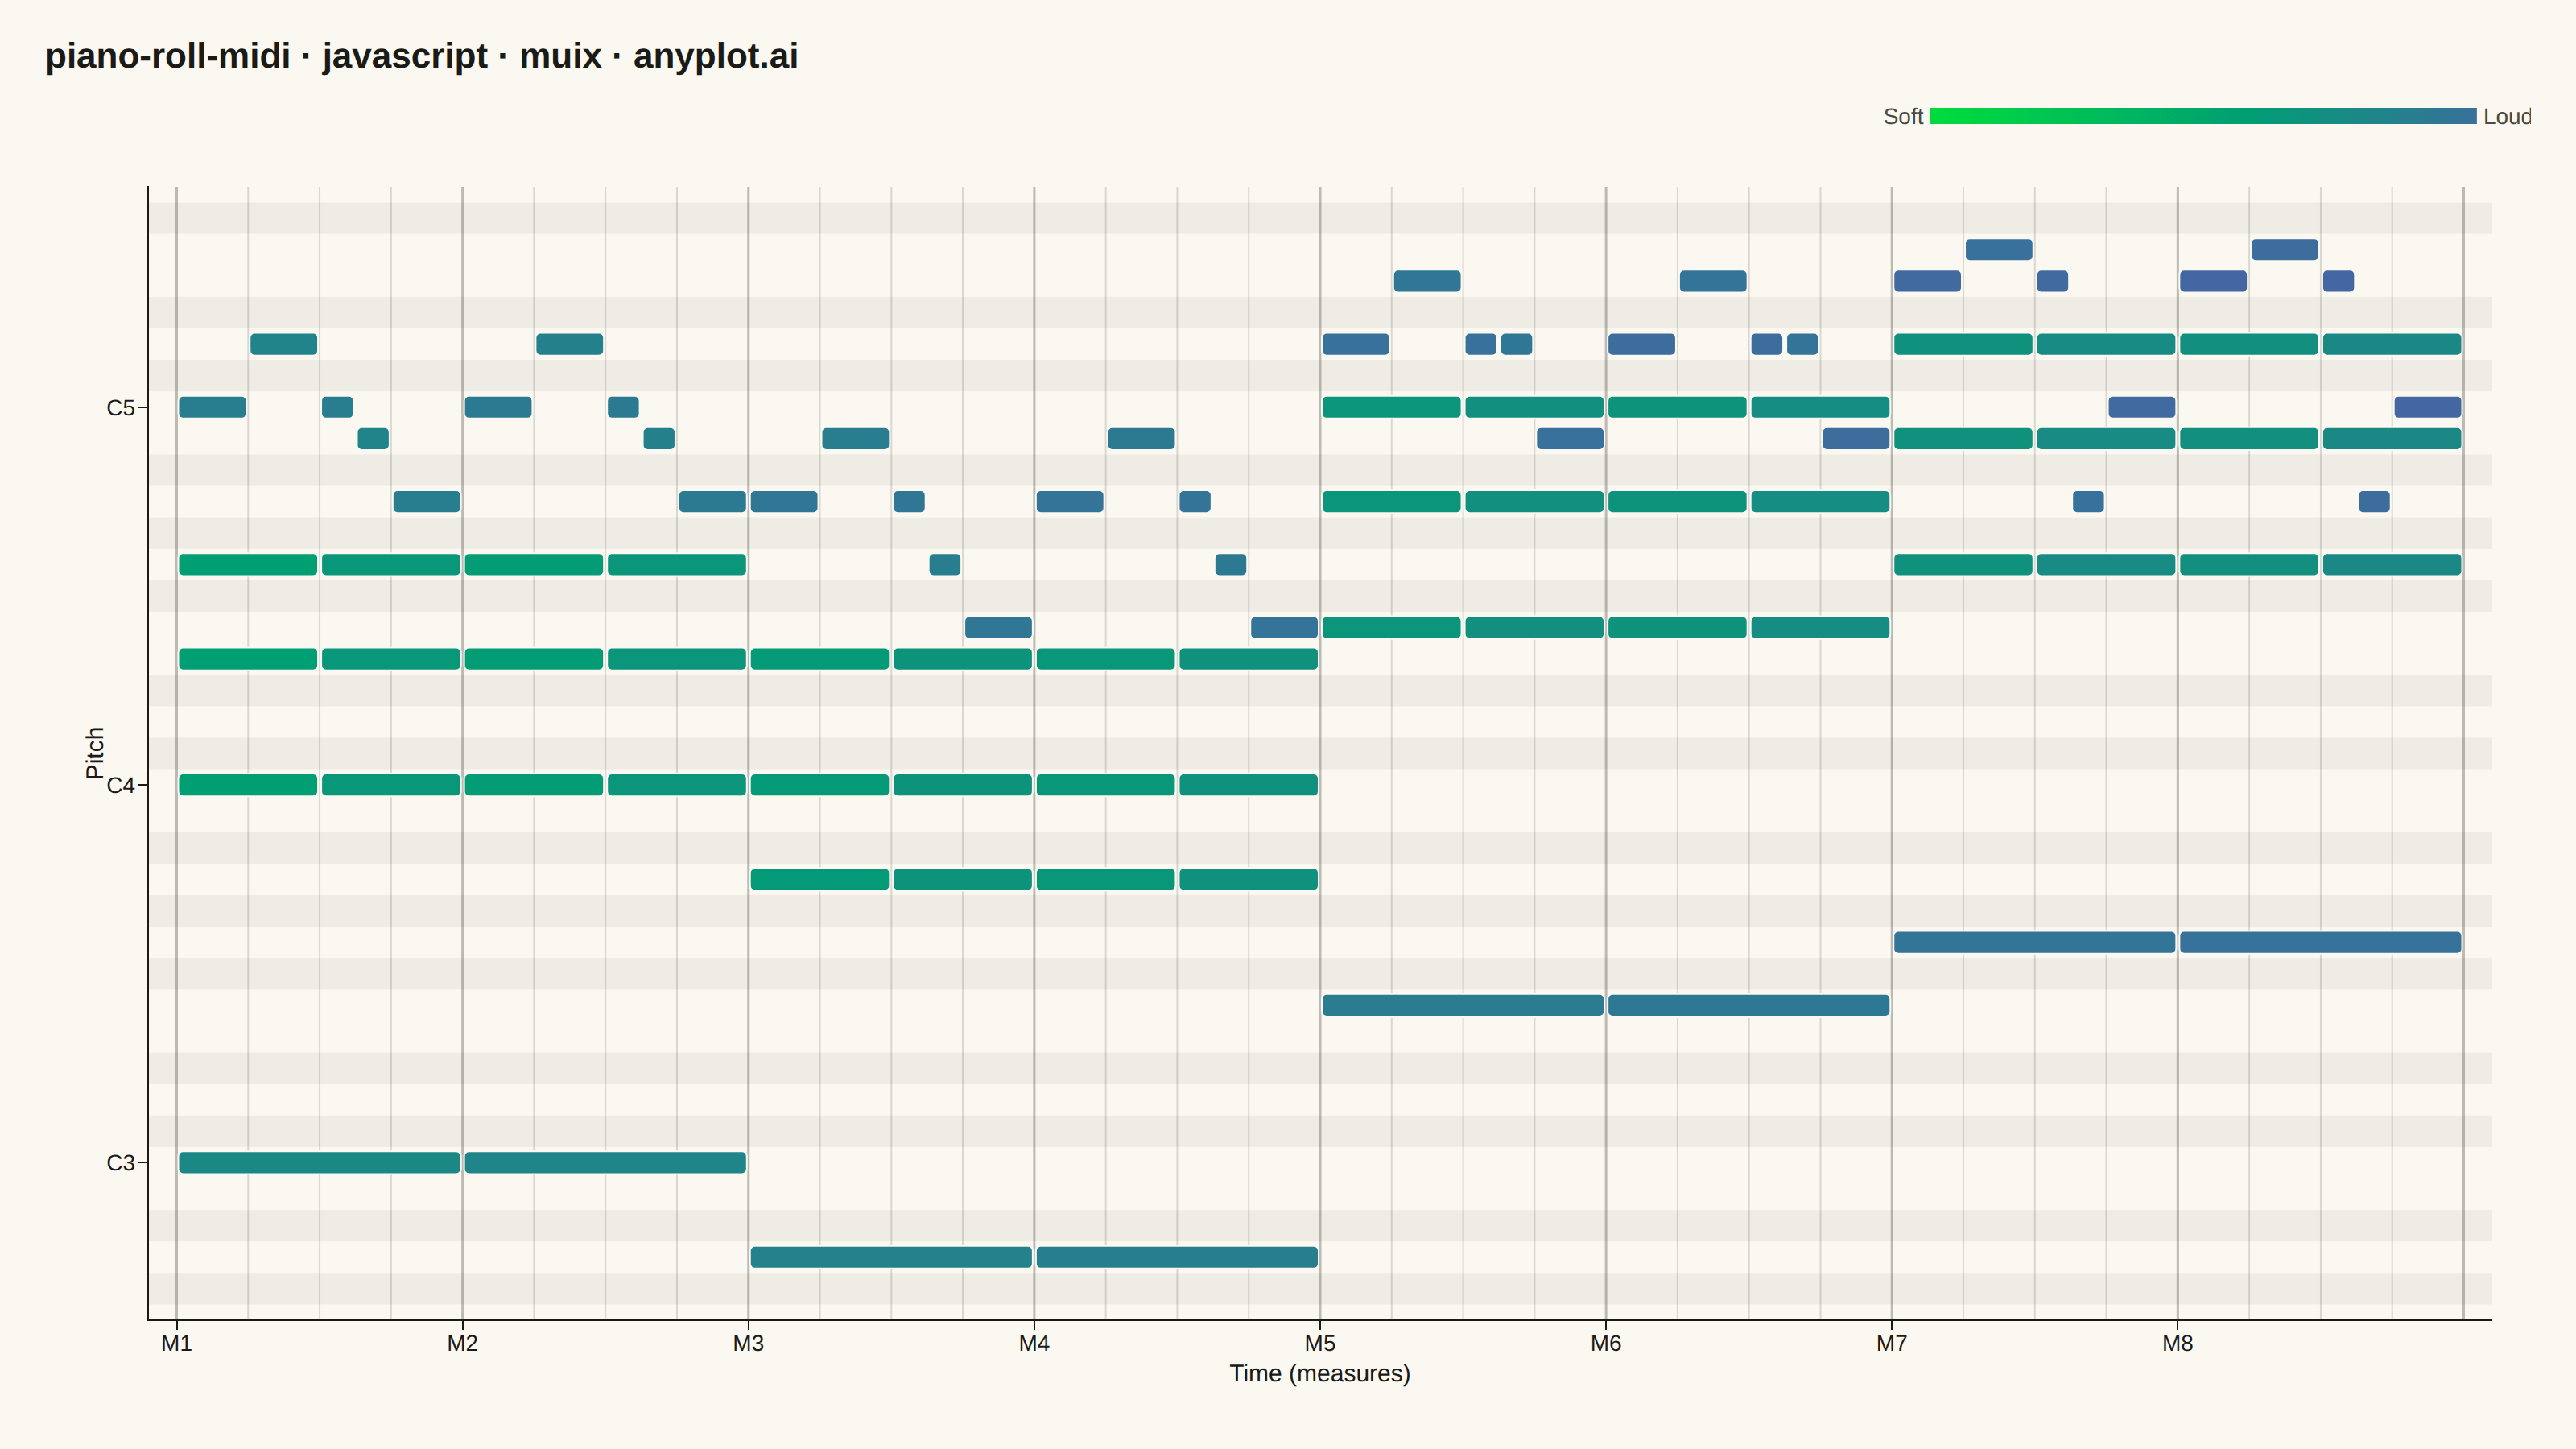
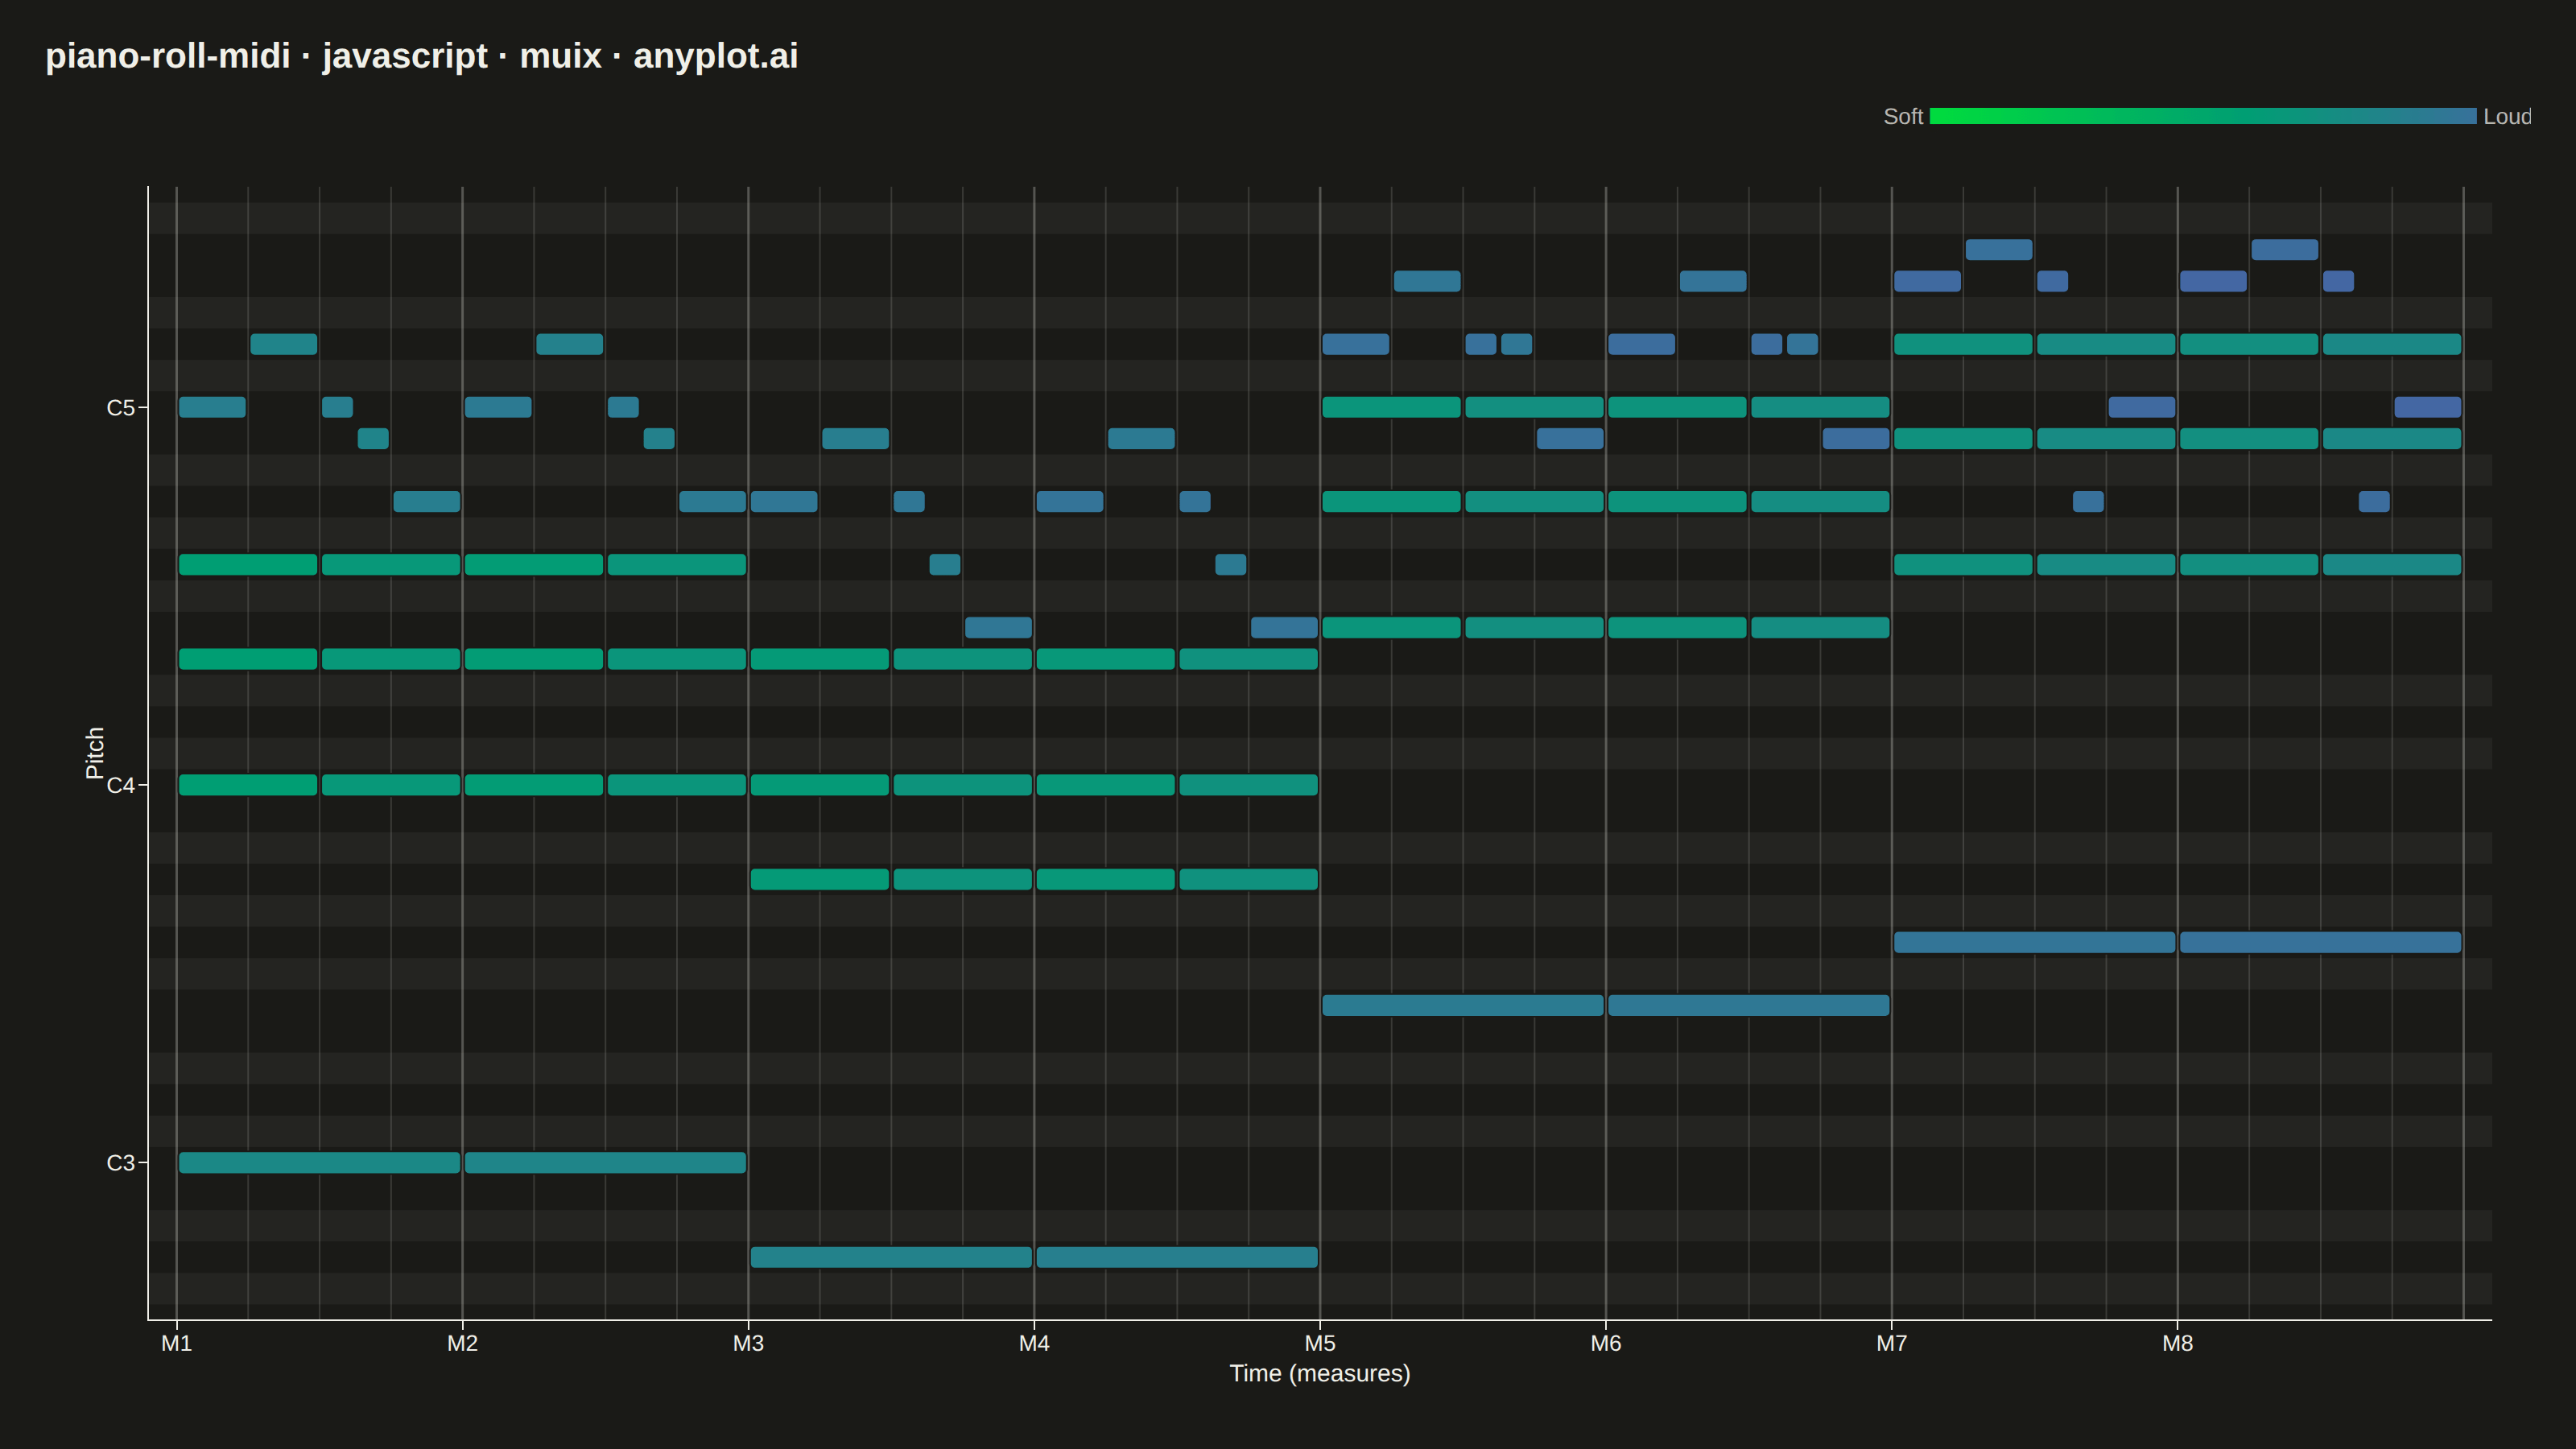
A grid-based visualization of musical notes over time, as seen in digital audio workstations (DAWs). Each note is represented as a horizontal rectangle positioned by pitch (y-axis) and time (x-axis), with bar length indicating note duration and color indicating velocity (dynamics). The background alternates between white and dark rows to mirror piano keyboard layout, with vertical grid lines marking beats and measures.
// anyplot.ai
// piano-roll-midi: MIDI Piano Roll Visualization
// Library: muix 7.29.1 | JavaScript 22.23.2
// Quality: 94/100 | Created: 2026-08-20
import { ChartContainer } from "@mui/x-charts/ChartContainer";
import { ChartsXAxis } from "@mui/x-charts/ChartsXAxis";
import { ChartsYAxis } from "@mui/x-charts/ChartsYAxis";
import { ContinuousColorLegend } from "@mui/x-charts/ChartsLegend";
import { useXScale, useYScale, useZColorScale, useDrawingArea } from "@mui/x-charts/hooks";
import { Box, Typography } from "@mui/material";

const t = window.ANYPLOT_TOKENS;

// --- Data (in-memory, deterministic) ----------------------------------------
// A four-bar chord loop (I - vi - IV - V in C major) played twice: a whole-note
// bass root, a two-hit comping pattern per measure, and a diatonic melodic line
// on top. Velocities climb measure by measure to build a single crescendo arc
// (soft comping early -> loud melody peaks late), so the color scale alone
// tells the dynamics story without any text callouts.
const BEATS_PER_MEASURE = 4;
const MEASURES = 8;
const TOTAL_BEATS = MEASURES * BEATS_PER_MEASURE;

const CHORDS = [
  { root: 60, tones: [60, 64, 67], melody: [72, 74, 72, 71, 69] }, // C major
  { root: 57, tones: [57, 60, 64], melody: [69, 71, 69, 67, 65] }, // A minor
  { root: 65, tones: [65, 69, 72], melody: [74, 76, 74, 74, 71] }, // F major
  { root: 67, tones: [67, 71, 74], melody: [76, 77, 76, 69, 72] }, // G major
];

const MELODY_OFFSETS = [0, 1, 2, 2.5, 3];
const MELODY_DURATIONS = [1, 1, 0.5, 0.5, 1];

const notes = [];
for (let measure = 0; measure < MEASURES; measure += 1) {
  const chord = CHORDS[Math.floor(measure / 2) % CHORDS.length];
  const measureStart = measure * BEATS_PER_MEASURE;

  // Bass: one whole note holding the chord root down an octave.
  notes.push({
    start: measureStart,
    duration: BEATS_PER_MEASURE,
    pitch: chord.root - 12,
    velocity: 78 + measure * 3,
  });

  // Comping: the triad struck on beat 1 and beat 3 of the measure.
  for (let hit = 0; hit < 2; hit += 1) {
    const hitStart = measureStart + hit * 2;
    const hitVelocity = 58 + measure * 2 + (hit === 1 ? 6 : 0);
    chord.tones.forEach((pitch) => {
      notes.push({ start: hitStart, duration: 2, pitch, velocity: hitVelocity });
    });
  }

  // Melody: a five-note diatonic cell riding on top of the harmony.
  MELODY_OFFSETS.forEach((offset, i) => {
    notes.push({
      start: measureStart + offset,
      duration: MELODY_DURATIONS[i],
      pitch: chord.melody[i],
      velocity: 82 + measure * 3 + (i % 2 === 0 ? 6 : 0),
    });
  });
}

const pitches = notes.map((n) => n.pitch);
const velocities = notes.map((n) => n.velocity);
const PITCH_MARGIN = 2; // auto-fit the visible range to the data, not all 128 MIDI notes
const pitchAxisMin = Math.min(...pitches) - PITCH_MARGIN;
const pitchAxisMax = Math.max(...pitches) + PITCH_MARGIN;
const velocityMin = Math.min(...velocities);
const velocityMax = Math.max(...velocities);

const NOTE_NAMES = ["C", "C#", "D", "D#", "E", "F", "F#", "G", "G#", "A", "A#", "B"];
const midiToNoteName = (midi) => `${NOTE_NAMES[((midi % 12) + 12) % 12]}${Math.floor(midi / 12) - 1}`;
const isBlackKey = (midi) => [1, 3, 6, 8, 10].includes(((midi % 12) + 12) % 12);

const measureTicks = Array.from({ length: MEASURES }, (_, i) => i * BEATS_PER_MEASURE);
const octaveTicks = [];
for (let p = Math.ceil(pitchAxisMin); p <= Math.floor(pitchAxisMax); p += 1) {
  if (p % 12 === 0) octaveTicks.push(p);
}

const hexToRgba = (hex, alpha) => {
  const n = parseInt(hex.replace("#", ""), 16);
  return `rgba(${(n >> 16) & 255}, ${(n >> 8) & 255}, ${n & 255}, ${alpha})`;
};
const blackKeyFill = hexToRgba(t.ink, 0.05);
const measureLineColor = hexToRgba(t.ink, 0.28);

const TITLE = "piano-roll-midi · javascript · muix · anyplot.ai";

// --- Piano-key row shading (white/black key bands behind the notes) ---------
function KeyboardRows() {
  const yScale = useYScale("pitch");
  const drawingArea = useDrawingArea();
  const rows = [];
  for (let p = Math.ceil(pitchAxisMin); p <= Math.floor(pitchAxisMax); p += 1) {
    if (isBlackKey(p)) rows.push(p);
  }
  return (
    <g>
      {rows.map((p) => (
        <rect
          key={p}
          x={drawingArea.left}
          y={yScale(p + 0.5)}
          width={drawingArea.width}
          height={yScale(p - 0.5) - yScale(p + 0.5)}
          fill={blackKeyFill}
        />
      ))}
    </g>
  );
}

// --- Beat / measure grid lines (stronger at measure boundaries) ------------
function BeatGrid() {
  const xScale = useXScale("beats");
  const drawingArea = useDrawingArea();
  const beats = Array.from({ length: TOTAL_BEATS + 1 }, (_, b) => b);
  return (
    <g>
      {beats.map((b) => {
        const isMeasure = b % BEATS_PER_MEASURE === 0;
        return (
          <line
            key={b}
            x1={xScale(b)}
            x2={xScale(b)}
            y1={drawingArea.top}
            y2={drawingArea.top + drawingArea.height}
            stroke={isMeasure ? measureLineColor : t.grid}
            strokeWidth={isMeasure ? 1.5 : 1}
          />
        );
      })}
    </g>
  );
}

// --- Notes: one rounded rect per (start, duration, pitch), fill by velocity -
function NoteBars() {
  const xScale = useXScale("beats");
  const yScale = useYScale("pitch");
  const colorScale = useZColorScale("velocity");
  return (
    <g>
      {notes.map((n, i) => {
        const x0 = xScale(n.start);
        const x1 = xScale(n.start + n.duration);
        const rowTop = yScale(n.pitch + 0.5);
        const rowBottom = yScale(n.pitch - 0.5);
        const pad = (rowBottom - rowTop) * 0.14;
        return (
          <rect
            key={i}
            x={x0 + 1}
            y={rowTop + pad}
            width={Math.max(x1 - x0 - 2, 3)}
            height={Math.max(rowBottom - rowTop - pad * 2, 2)}
            rx={3}
            fill={colorScale ? colorScale(n.velocity) : t.palette[0]}
            stroke={t.pageBg}
            strokeWidth={1}
          />
        );
      })}
    </g>
  );
}

// --- Chart (default-exported component — the harness mounts it) ------------
export default function Chart() {
  const size = window.ANYPLOT_SIZE;
  const padding = { top: 24, right: 28, bottom: 20, left: 28 };
  const titleBlockHeight = 44;
  const chartWidth = size.width - padding.left - padding.right;
  const chartHeight = size.height - padding.top - padding.bottom - titleBlockHeight;

  return (
    <Box
      sx={{
        width: size.width,
        height: size.height,
        boxSizing: "border-box",
        padding: `${padding.top}px ${padding.right}px ${padding.bottom}px ${padding.left}px`,
        display: "flex",
        flexDirection: "column",
      }}
    >
      <Typography sx={{ fontSize: 22, fontWeight: 600, color: "text.primary", mb: "18px", lineHeight: 1 }}>
        {TITLE}
      </Typography>
      <ChartContainer
        width={chartWidth}
        height={chartHeight}
        series={[]}
        margin={{ left: 64, right: 24, top: 52, bottom: 56 }}
        xAxis={[
          {
            id: "beats",
            scaleType: "linear",
            min: -0.4,
            max: TOTAL_BEATS + 0.4,
            tickInterval: measureTicks,
            valueFormatter: (beat) => `M${beat / BEATS_PER_MEASURE + 1}`,
            label: "Time (measures)",
            tickLabelStyle: { fontSize: 14 },
            labelStyle: { fontSize: 15 },
          },
        ]}
        yAxis={[
          {
            id: "pitch",
            scaleType: "linear",
            min: pitchAxisMin,
            max: pitchAxisMax,
            tickInterval: octaveTicks,
            valueFormatter: (pitch) => midiToNoteName(pitch),
            label: "Pitch",
            tickLabelStyle: { fontSize: 14 },
            labelStyle: { fontSize: 15 },
          },
        ]}
        zAxis={[
          {
            id: "velocity",
            min: velocityMin,
            max: velocityMax,
            colorMap: { type: "continuous", color: [t.seq[0], t.seq[1]] },
          },
        ]}
        disableAxisListener
      >
        <KeyboardRows />
        <BeatGrid />
        <ChartsYAxis />
        <ChartsXAxis />
        <NoteBars />
        <ContinuousColorLegend
          axisDirection="z"
          axisId="velocity"
          minLabel="Soft"
          maxLabel="Loud"
          position={{ horizontal: "right", vertical: "top" }}
          direction="row"
          length="22%"
          thickness={10}
          labelStyle={{ fontSize: 14, fill: t.inkSoft }}
        />
      </ChartContainer>
    </Box>
  );
}
Runnable source as JSON, for any HTTP client: https://api.anyplot.ai/specs/piano-roll-midi/muix/code. Any spec id and library id listed in llms-full.txt fit the same URL shape; every URL below is complete and callable.
{
  "spec_id": "piano-roll-midi",
  "language": "javascript",
  "library": "muix",
  "page": "https://anyplot.ai/piano-roll-midi/javascript/muix",
  "hub": "https://anyplot.ai/piano-roll-midi",
  "code_json": "https://api.anyplot.ai/specs/piano-roll-midi/muix/code",
  "spec_json": "https://api.anyplot.ai/specs/piano-roll-midi",
  "render_light_png": "https://storage.googleapis.com/anyplot-images/plots/piano-roll-midi/javascript/muix/plot-light.png",
  "render_dark_png": "https://storage.googleapis.com/anyplot-images/plots/piano-roll-midi/javascript/muix/plot-dark.png",
  "interactive_light_html": "https://storage.googleapis.com/anyplot-images/plots/piano-roll-midi/javascript/muix/plot-light.html",
  "interactive_dark_html": "https://storage.googleapis.com/anyplot-images/plots/piano-roll-midi/javascript/muix/plot-dark.html",
  "quality_score": 94.0,
  "license": "MIT",
  "guide": "https://anyplot.ai/llms.txt"
}
Part of MIDI Piano Roll Visualization on anyplot.ai.