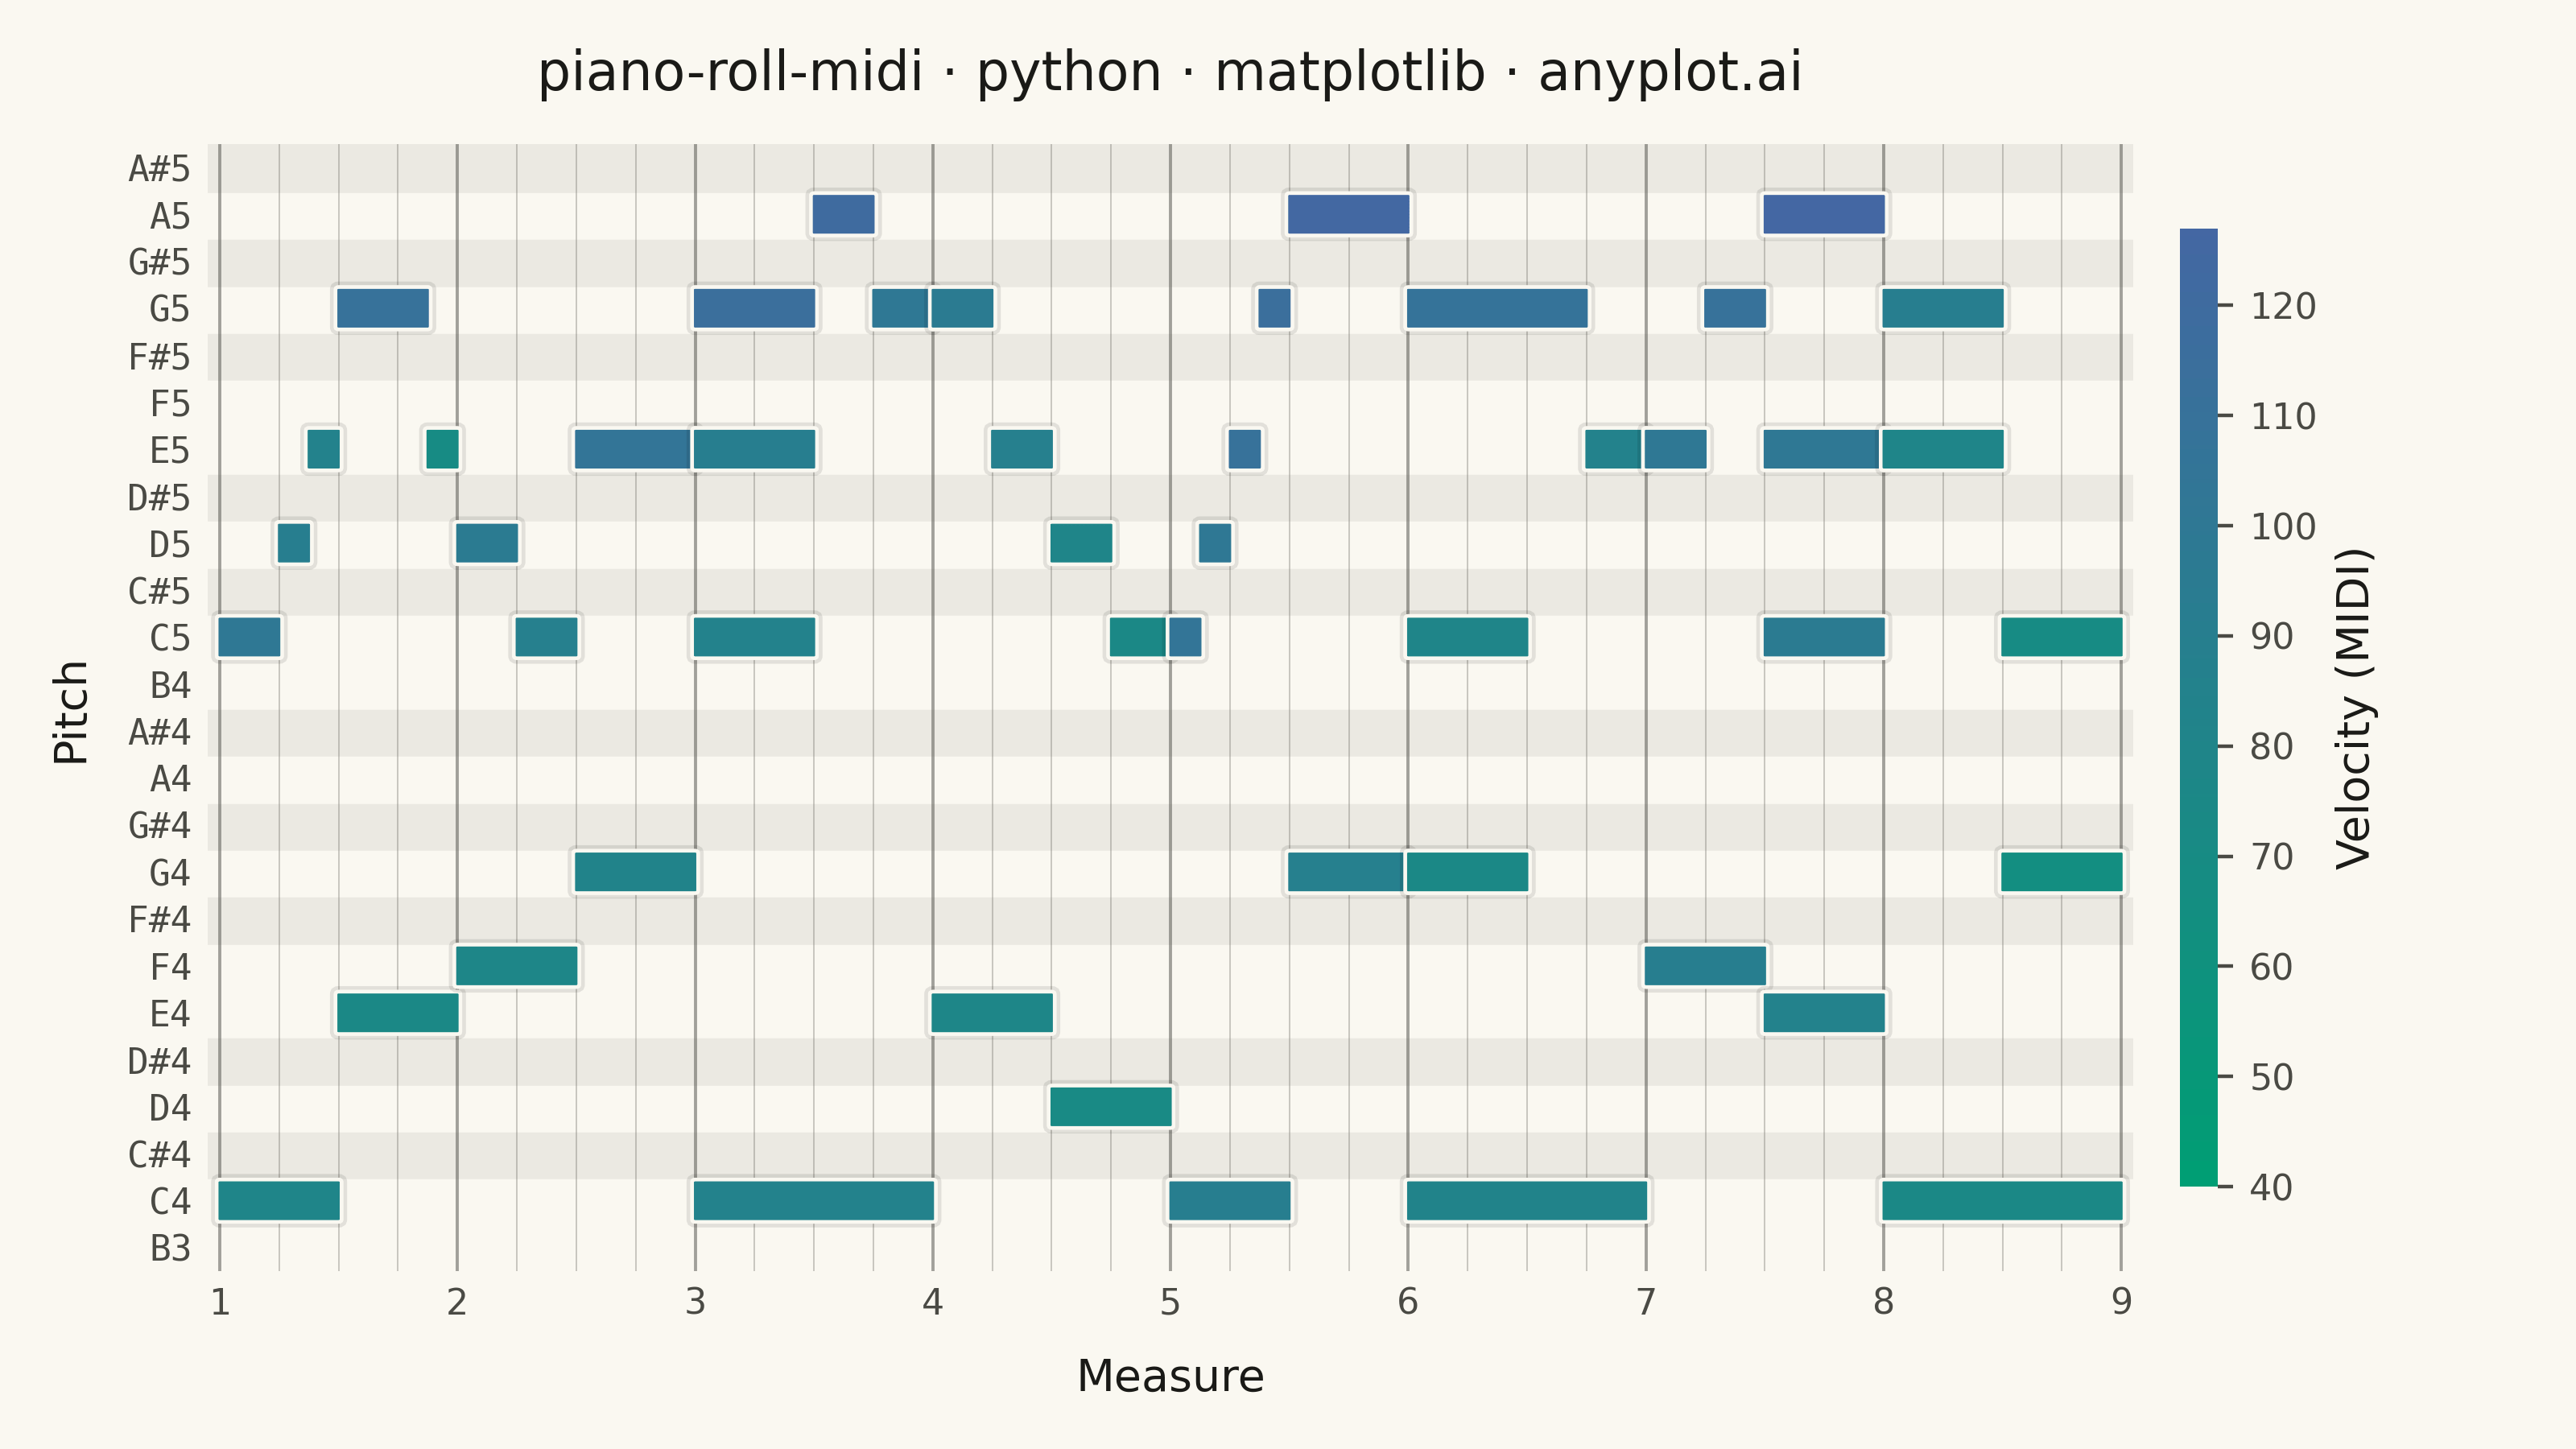
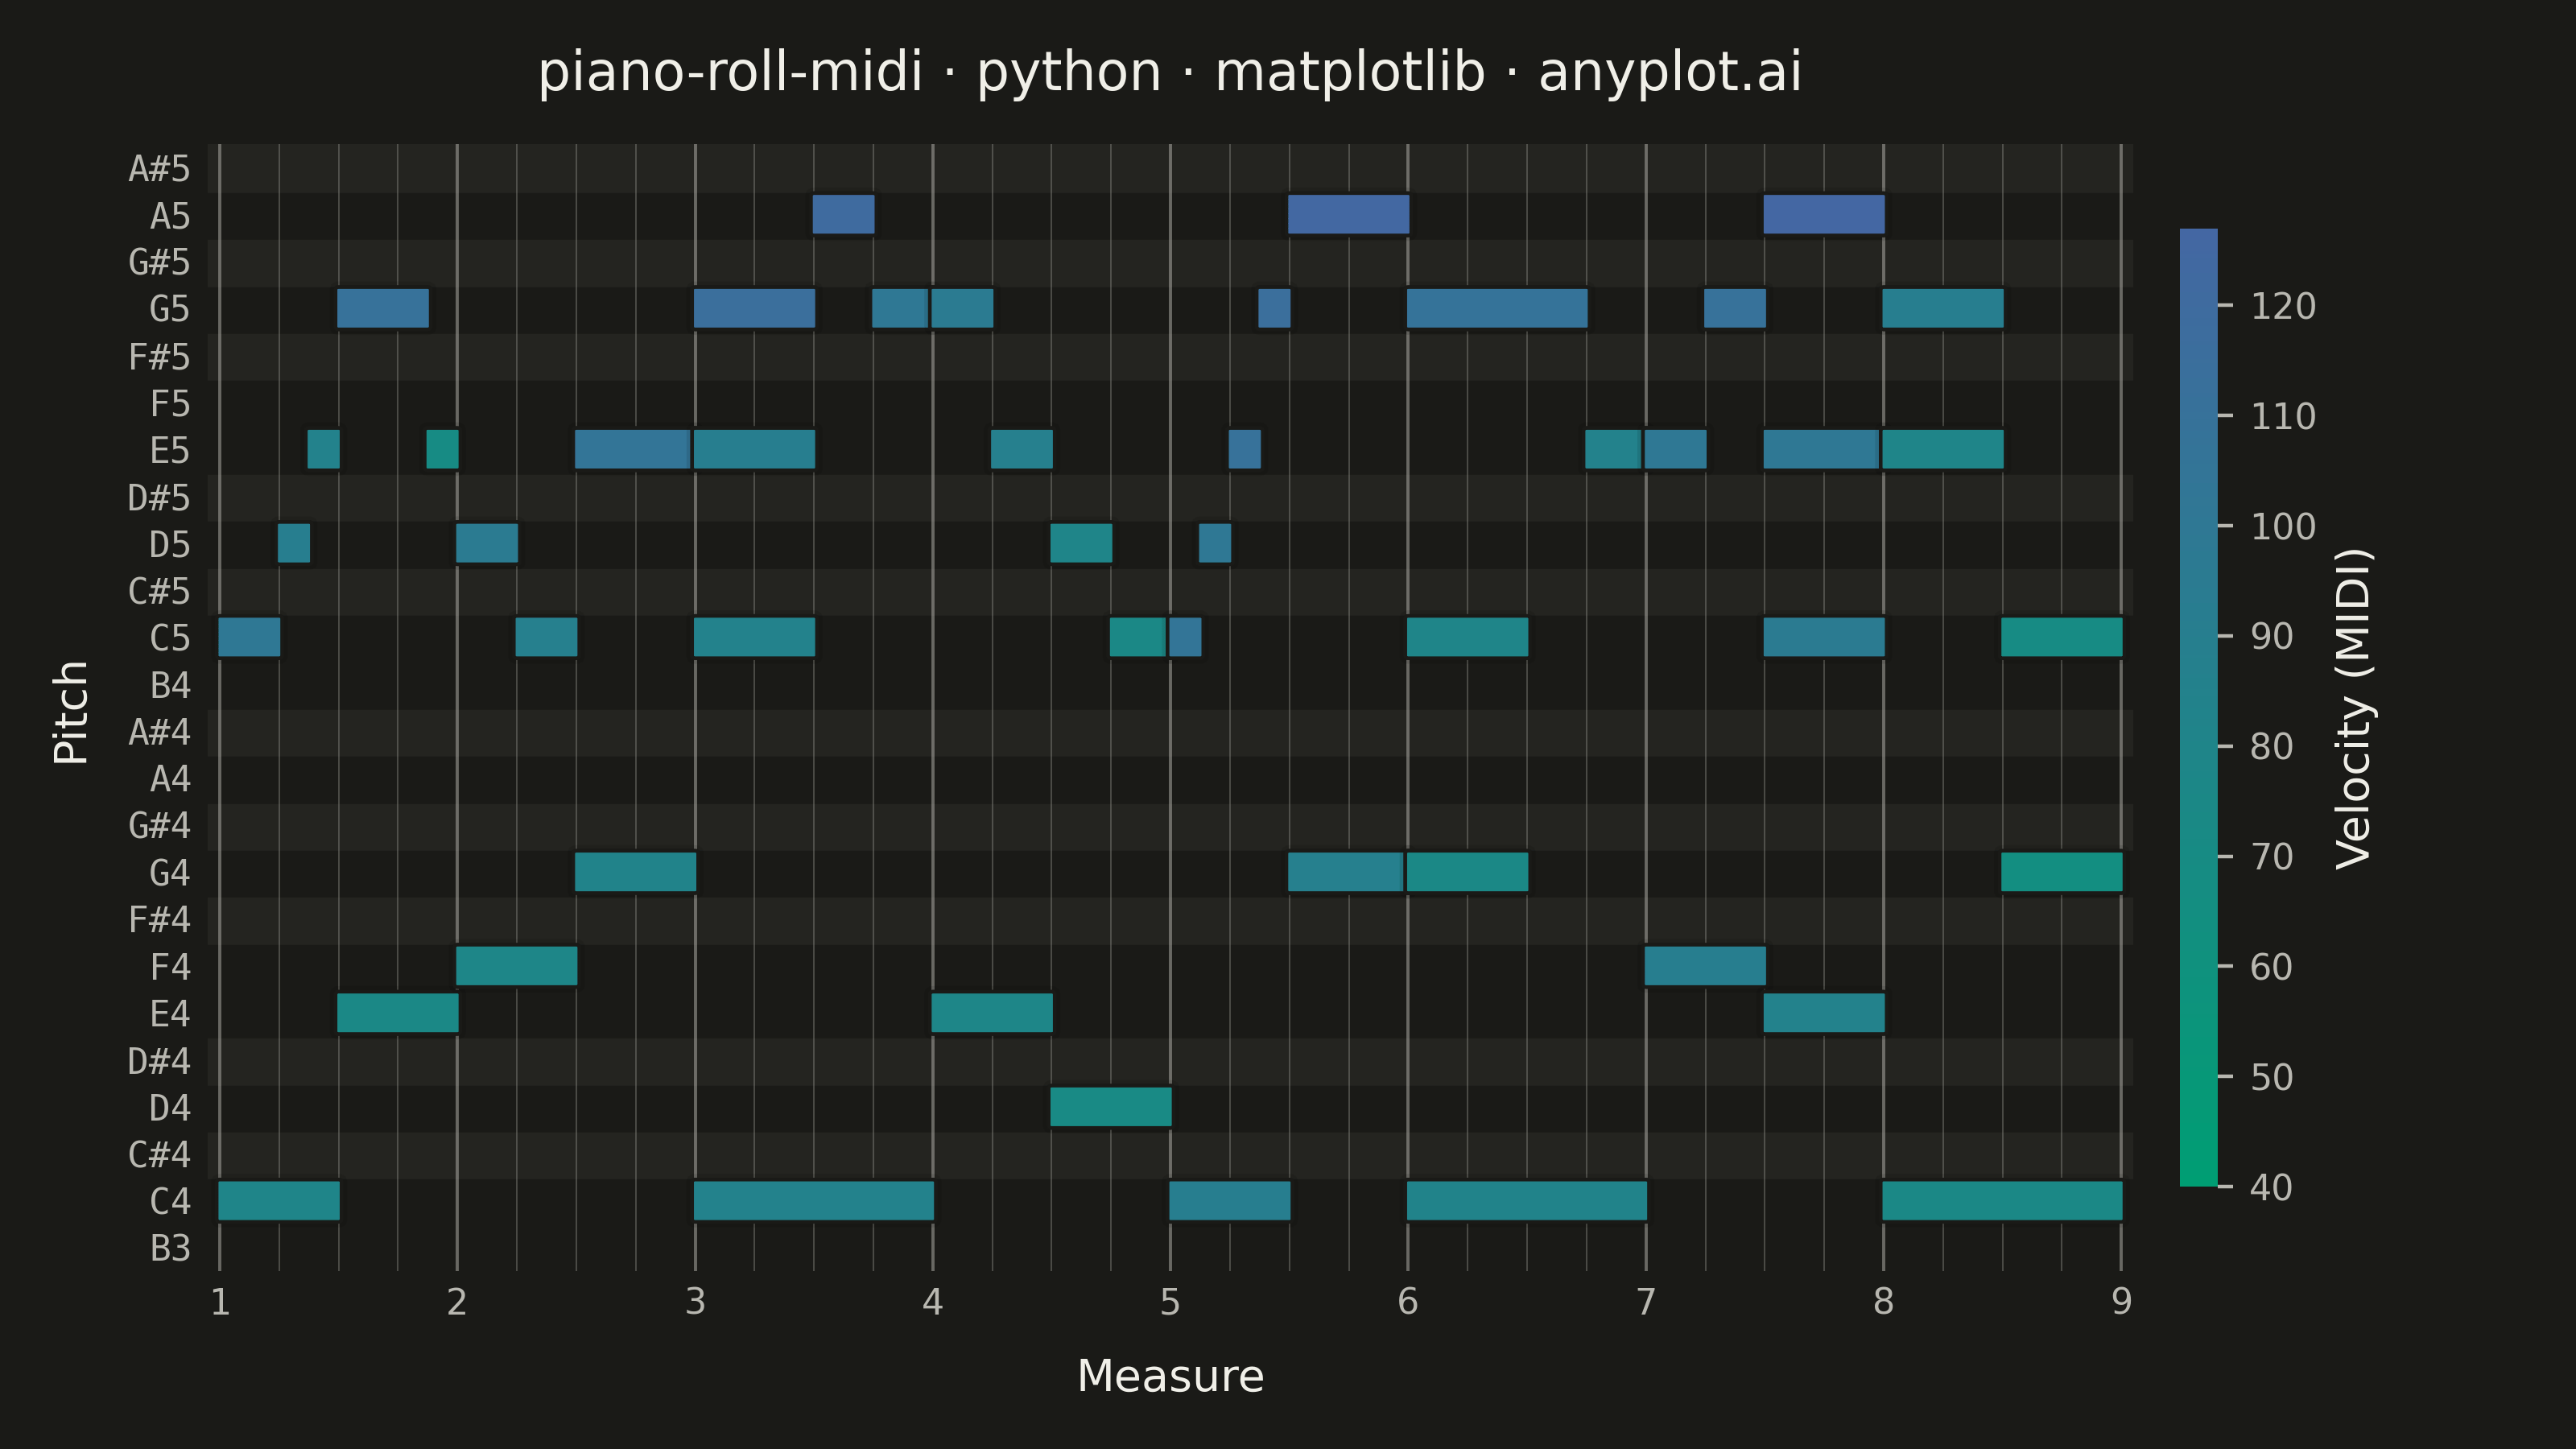
A grid-based visualization of musical notes over time, as seen in digital audio workstations (DAWs). Each note is represented as a horizontal rectangle positioned by pitch (y-axis) and time (x-axis), with bar length indicating note duration and color indicating velocity (dynamics). The background alternates between white and dark rows to mirror piano keyboard layout, with vertical grid lines marking beats and measures.
""" anyplot.ai
piano-roll-midi: MIDI Piano Roll Visualization
Library: matplotlib 3.10.9 | Python 3.13.13
Quality: 91/100 | Updated: 2026-06-03
"""

import os

import matplotlib.colors as mcolors
import matplotlib.patches as mpatches
import matplotlib.patheffects as pe
import matplotlib.pyplot as plt
import numpy as np
from matplotlib.colors import LinearSegmentedColormap


THEME = os.getenv("ANYPLOT_THEME", "light")

PAGE_BG = "#FAF8F1" if THEME == "light" else "#1A1A17"
ELEVATED_BG = "#FFFDF6" if THEME == "light" else "#242420"
INK = "#1A1A17" if THEME == "light" else "#F0EFE8"
INK_SOFT = "#4A4A44" if THEME == "light" else "#B8B7B0"
INK_MUTED = "#6B6A63" if THEME == "light" else "#A8A79F"

# Imprint sequential colormap for velocity (single-polarity, soft→loud)
imprint_seq = LinearSegmentedColormap.from_list("imprint_seq", ["#009E73", "#4467A3"])

# Key row shading: black keys get a slightly offset background
BLACK_KEY_BG = "#EBE9E2" if THEME == "light" else "#242420"

# Piano black-key semitone positions: C#, D#, F#, G#, A#
BLACK_KEYS = {1, 3, 6, 8, 10}

# Data: a musical phrase with melody, bass, and chords across 8 measures
np.random.seed(42)

notes = [
    # Measure 1 - Opening melody
    (0.0, 1.0, 72, 100),
    (1.0, 0.5, 74, 90),
    (1.5, 0.5, 76, 85),
    (2.0, 1.5, 79, 110),
    (3.5, 0.5, 76, 70),
    # Bass measure 1
    (0.0, 2.0, 60, 80),
    (2.0, 2.0, 64, 75),
    # Measure 2 - Continuation
    (4.0, 1.0, 74, 95),
    (5.0, 1.0, 72, 88),
    (6.0, 2.0, 76, 105),
    # Bass measure 2
    (4.0, 2.0, 65, 78),
    (6.0, 2.0, 67, 82),
    # Measure 3 - Chords + melody
    (8.0, 2.0, 79, 115),
    (8.0, 2.0, 76, 90),
    (8.0, 2.0, 72, 85),
    (10.0, 1.0, 81, 120),
    (11.0, 1.0, 79, 100),
    # Bass measure 3
    (8.0, 4.0, 60, 85),
    # Measure 4 - Descending
    (12.0, 1.0, 79, 95),
    (13.0, 1.0, 76, 88),
    (14.0, 1.0, 74, 80),
    (15.0, 1.0, 72, 75),
    # Bass measure 4
    (12.0, 2.0, 64, 78),
    (14.0, 2.0, 62, 72),
    # Measure 5 - New phrase, louder
    (16.0, 0.5, 72, 105),
    (16.5, 0.5, 74, 100),
    (17.0, 0.5, 76, 110),
    (17.5, 0.5, 79, 115),
    (18.0, 2.0, 81, 125),
    # Bass measure 5
    (16.0, 2.0, 60, 90),
    (18.0, 2.0, 67, 88),
    # Measure 6 - Sustained
    (20.0, 3.0, 79, 108),
    (23.0, 1.0, 76, 85),
    # Chord measure 6
    (20.0, 2.0, 72, 80),
    (20.0, 2.0, 67, 75),
    # Bass measure 6
    (20.0, 4.0, 60, 82),
    # Measure 7 - Climax
    (24.0, 1.0, 76, 100),
    (25.0, 1.0, 79, 110),
    (26.0, 2.0, 81, 127),
    (26.0, 2.0, 76, 100),
    (26.0, 2.0, 72, 95),
    # Bass measure 7
    (24.0, 2.0, 65, 90),
    (26.0, 2.0, 64, 85),
    # Measure 8 - Resolution
    (28.0, 2.0, 79, 90),
    (30.0, 2.0, 72, 70),
    (28.0, 2.0, 76, 80),
    (30.0, 2.0, 67, 65),
    # Bass measure 8
    (28.0, 4.0, 60, 75),
]

pitches = np.array([n[2] for n in notes])
pitch_min = int(pitches.min()) - 1
pitch_max = int(pitches.max()) + 1

norm = mcolors.Normalize(vmin=40, vmax=127)

# Canvas: landscape 3200×1800 px (figsize × dpi = 8×400, 4.5×400)
fig, ax = plt.subplots(figsize=(8, 4.5), dpi=400, facecolor=PAGE_BG)
ax.set_facecolor(PAGE_BG)

# Alternating row shading to distinguish black vs white piano keys
for pitch in range(pitch_min, pitch_max + 1):
    row_color = BLACK_KEY_BG if (pitch % 12) in BLACK_KEYS else PAGE_BG
    ax.axhspan(pitch - 0.5, pitch + 0.5, color=row_color, zorder=0)

# Vertical grid: subtle beats with stronger measure boundaries
total_beats = 32
for beat in range(total_beats + 1):
    if beat % 4 == 0:
        ax.axvline(beat, color=INK_SOFT, linewidth=0.7, alpha=0.5, zorder=1)
    else:
        ax.axvline(beat, color=INK_MUTED, linewidth=0.35, alpha=0.35, zorder=1)

# Note rectangles: rounded corners with subtle depth shadow
for start, dur, pitch, vel in notes:
    color = imprint_seq(norm(vel))
    rect = mpatches.FancyBboxPatch(
        (start, pitch - 0.4),
        dur,
        0.8,
        boxstyle="round,pad=0.05",
        facecolor=color,
        edgecolor=PAGE_BG,
        linewidth=0.8,
        zorder=2,
        path_effects=[pe.withStroke(linewidth=2.5, foreground="#00000018"), pe.Normal()],
    )
    ax.add_patch(rect)

# Y-axis: MIDI note names (C4, D#4, etc.) in monospace for alignment
visible_pitches = list(range(pitch_min, pitch_max + 1))
pitch_labels = []
for p in visible_pitches:
    octave = p // 12 - 1
    semitone = p % 12
    name = ["C", "C#", "D", "D#", "E", "F", "F#", "G", "G#", "A", "A#", "B"][semitone]
    pitch_labels.append(f"{name}{octave}")

ax.set_yticks(visible_pitches)
ax.set_yticklabels(pitch_labels, fontsize=8, fontfamily="monospace")

# X-axis: measure numbers (1-indexed)
beat_ticks = np.arange(0, total_beats + 1, 4)
ax.set_xticks(beat_ticks)
ax.set_xticklabels([str(int(b // 4) + 1) for b in beat_ticks], fontsize=8)

# Axes limits and labels
ax.set_xlim(-0.2, total_beats + 0.2)
ax.set_ylim(pitch_min - 0.5, pitch_max + 0.5)
ax.set_xlabel("Measure", fontsize=10, labelpad=8, color=INK)
ax.set_ylabel("Pitch", fontsize=10, labelpad=8, color=INK)

title = "piano-roll-midi · python · matplotlib · anyplot.ai"
ax.set_title(title, fontsize=12, fontweight="medium", pad=12, color=INK)

# Chrome: remove all spines, hide tick marks, apply theme colors
for spine in ax.spines.values():
    spine.set_visible(False)
ax.tick_params(axis="both", length=0, labelcolor=INK_SOFT)

# Velocity colorbar using Imprint sequential colormap
sm = plt.cm.ScalarMappable(cmap=imprint_seq, norm=norm)
sm.set_array([])
cbar = plt.colorbar(sm, ax=ax, pad=0.02, aspect=25, shrink=0.85)
cbar.set_label("Velocity (MIDI)", fontsize=10, color=INK)
cbar.ax.tick_params(labelsize=8, colors=INK_SOFT)
cbar.outline.set_visible(False)
plt.setp(cbar.ax.yaxis.get_ticklabels(), color=INK_SOFT)

plt.tight_layout()
plt.savefig(f"plot-{THEME}.png", dpi=400, facecolor=PAGE_BG)
plt.close()
Runnable source as JSON, for any HTTP client: https://api.anyplot.ai/specs/piano-roll-midi/matplotlib/code. Any spec id and library id listed in llms-full.txt fit the same URL shape; every URL below is complete and callable.
{
  "spec_id": "piano-roll-midi",
  "language": "python",
  "library": "matplotlib",
  "page": "https://anyplot.ai/piano-roll-midi/python/matplotlib",
  "hub": "https://anyplot.ai/piano-roll-midi",
  "code_json": "https://api.anyplot.ai/specs/piano-roll-midi/matplotlib/code",
  "spec_json": "https://api.anyplot.ai/specs/piano-roll-midi",
  "render_light_png": "https://storage.googleapis.com/anyplot-images/plots/piano-roll-midi/python/matplotlib/plot-light.png",
  "render_dark_png": "https://storage.googleapis.com/anyplot-images/plots/piano-roll-midi/python/matplotlib/plot-dark.png",
  "quality_score": 91.0,
  "license": "MIT",
  "guide": "https://anyplot.ai/llms.txt"
}
Part of MIDI Piano Roll Visualization on anyplot.ai.