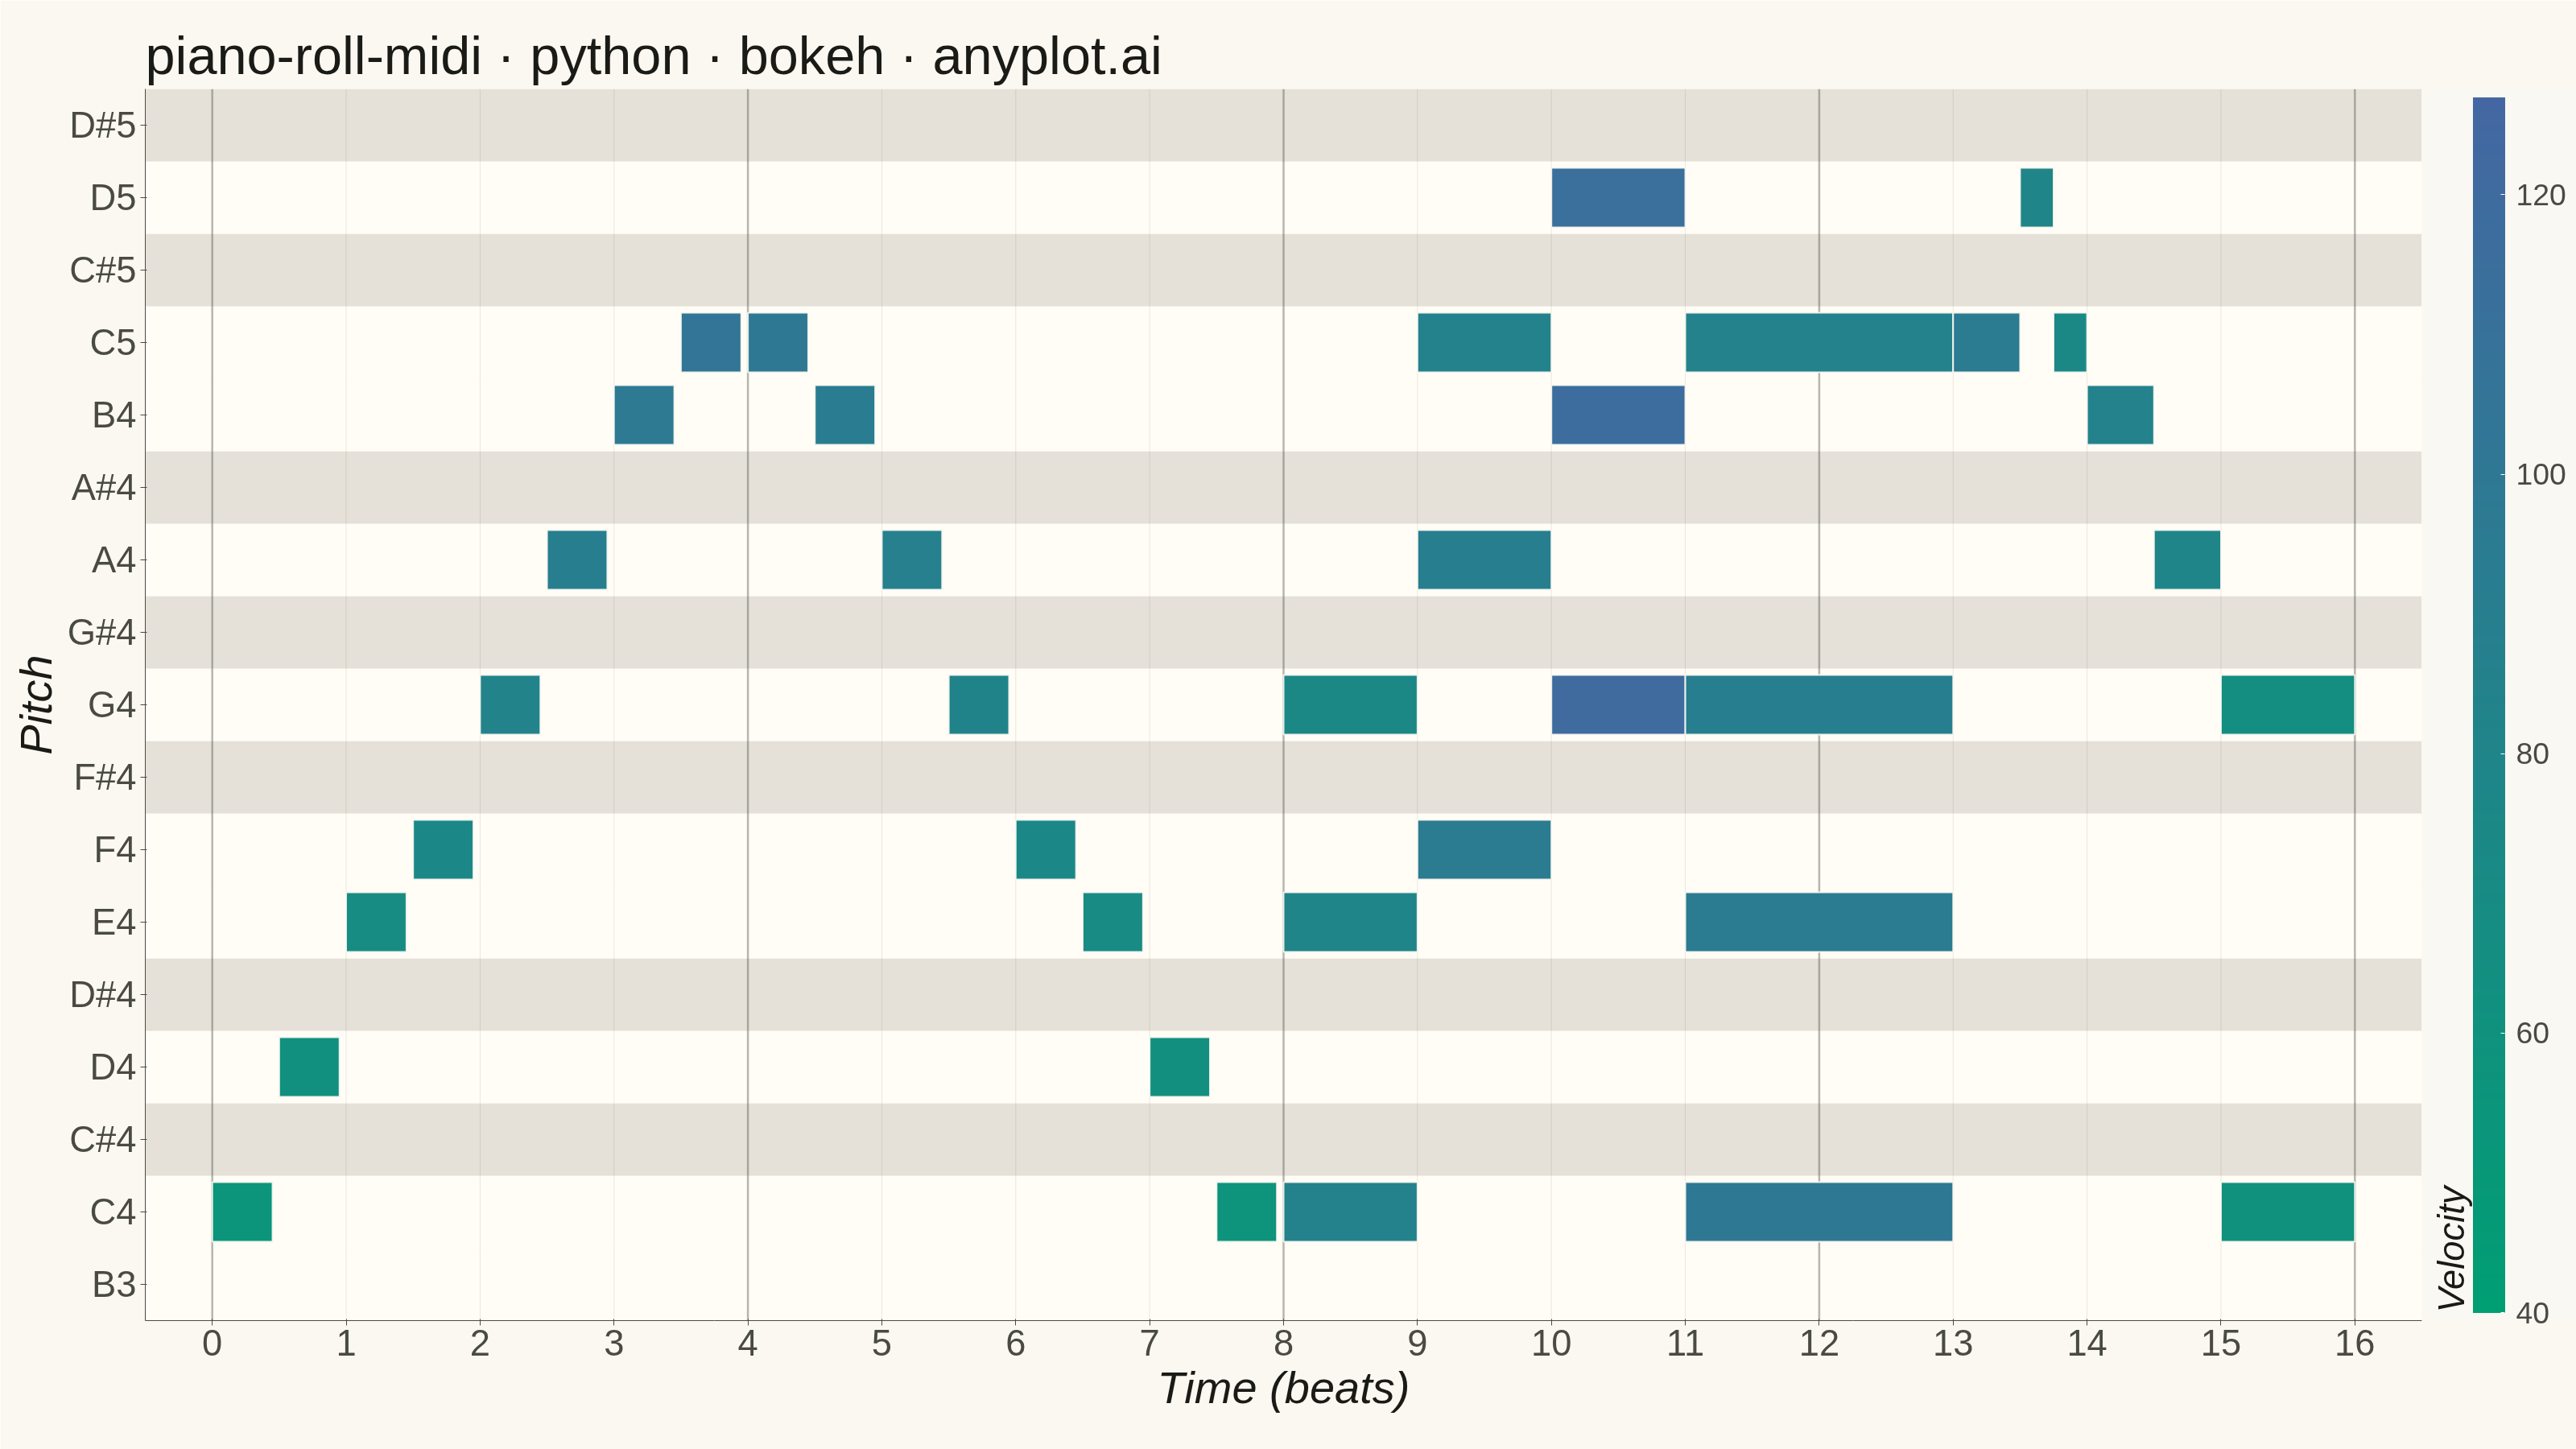
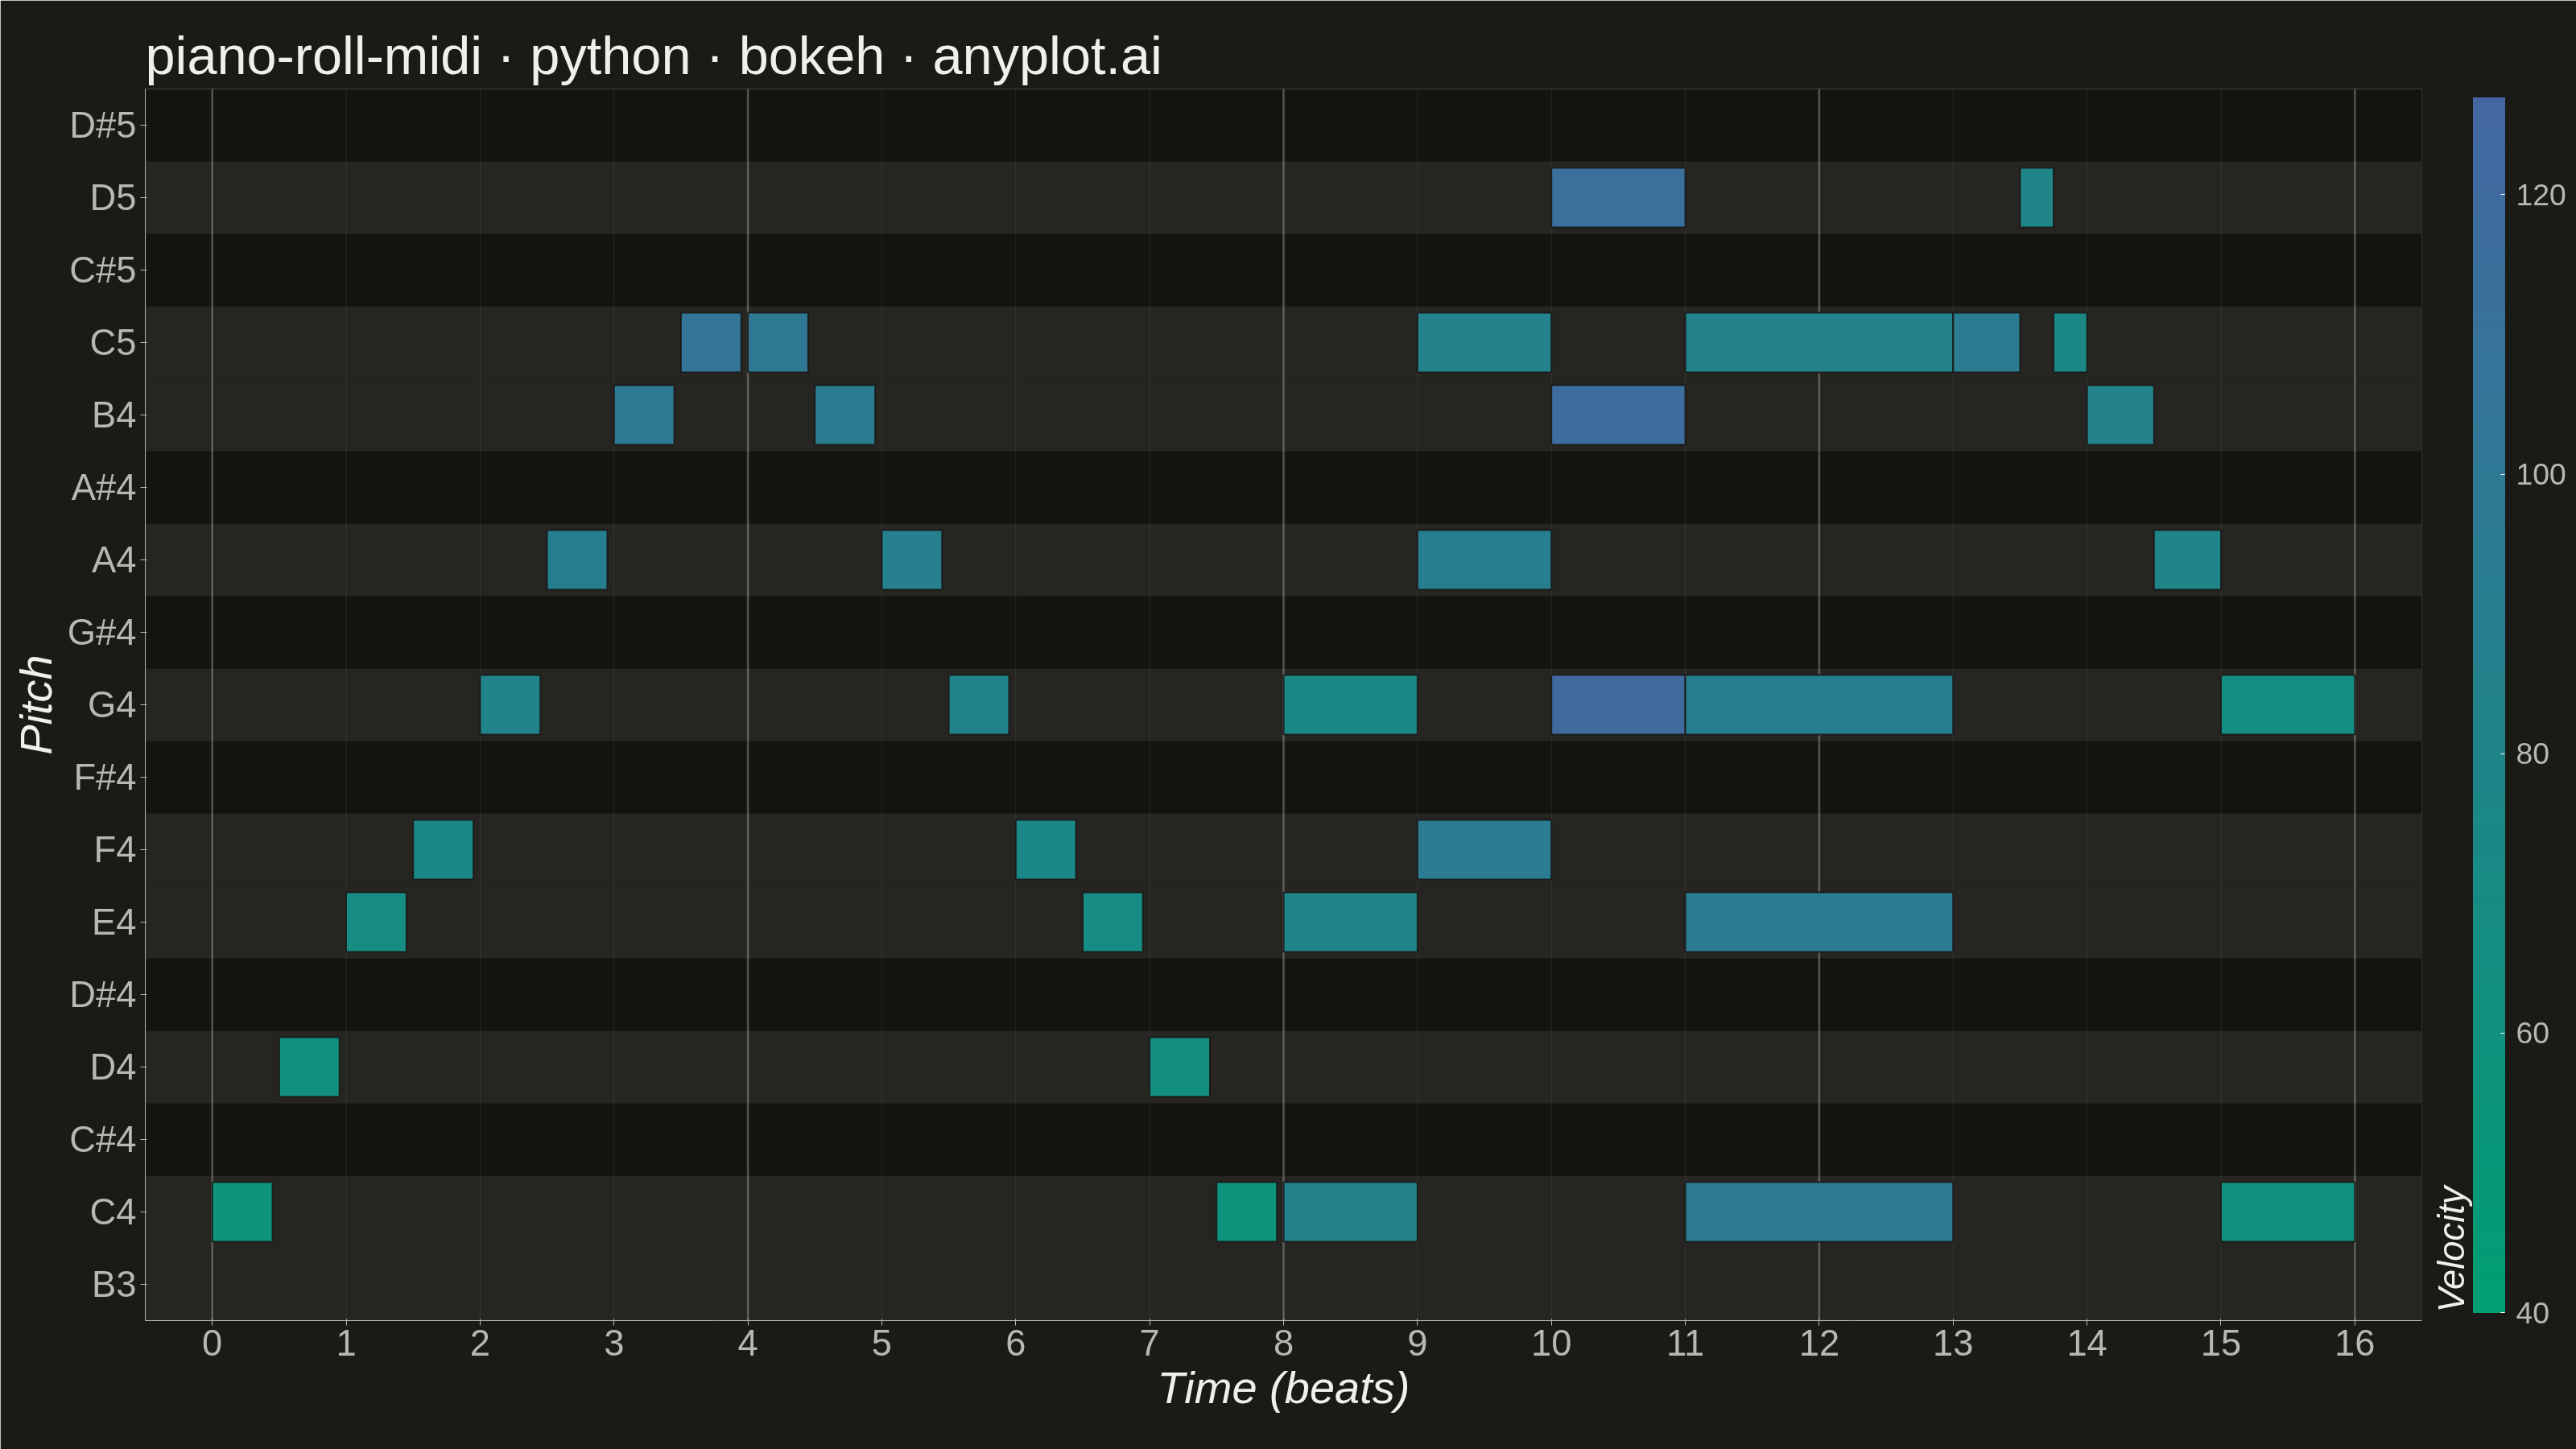
A grid-based visualization of musical notes over time, as seen in digital audio workstations (DAWs). Each note is represented as a horizontal rectangle positioned by pitch (y-axis) and time (x-axis), with bar length indicating note duration and color indicating velocity (dynamics). The background alternates between white and dark rows to mirror piano keyboard layout, with vertical grid lines marking beats and measures.
""" anyplot.ai
piano-roll-midi: MIDI Piano Roll Visualization
Library: bokeh 3.9.0 | Python 3.13.13
Quality: 91/100 | Updated: 2026-06-03
"""

import io
import os
import sys


# Prevent bokeh.py from shadowing the installed bokeh package
_this_dir = os.path.dirname(os.path.abspath(__file__))
sys.path = [p for p in sys.path if os.path.realpath(p) != os.path.realpath(_this_dir)]

import time
from pathlib import Path

import numpy as np
from bokeh.io import output_file, save
from bokeh.models import ColorBar, ColumnDataSource, FixedTicker, HoverTool, LinearColorMapper, Range1d
from bokeh.plotting import figure
from PIL import Image
from selenium import webdriver
from selenium.webdriver.chrome.options import Options


# Theme tokens
THEME = os.getenv("ANYPLOT_THEME", "light")
PAGE_BG = "#FAF8F1" if THEME == "light" else "#1A1A17"
ELEVATED_BG = "#FFFDF6" if THEME == "light" else "#242420"
INK = "#1A1A17" if THEME == "light" else "#F0EFE8"
INK_SOFT = "#4A4A44" if THEME == "light" else "#B8B7B0"
INK_MUTED = "#6B6A63" if THEME == "light" else "#A8A79F"


# imprint_seq: brand green (#009E73) → blue (#4467A3) — 256-stop pre-computed inline
VELOCITY_PALETTE = [
    f"#{round(68 * t / 255):02X}{round(158 - 55 * t / 255):02X}{round(115 + 48 * t / 255):02X}" for t in range(256)
]

# Data
note_names_map = {0: "C", 1: "C#", 2: "D", 3: "D#", 4: "E", 5: "F", 6: "F#", 7: "G", 8: "G#", 9: "A", 10: "A#", 11: "B"}
black_key_indices = {1, 3, 6, 8, 10}
note_names = [f"{note_names_map[p % 12]}{p // 12 - 1}" for p in range(128)]
black_keys = {p for p in range(128) if (p % 12) in black_key_indices}

# Musical phrase: C major scale runs + I-IV-V-I chord progression + melodic resolution
notes = []

# Measures 1-2: ascending C major scale with crescendo
for i, pitch in enumerate([60, 62, 64, 65, 67, 69, 71, 72]):
    notes.append({"start": i * 0.5, "duration": 0.45, "pitch": pitch, "velocity": 55 + i * 7})

# Measures 3-4: descending scale with decrescendo
for i, pitch in enumerate([72, 71, 69, 67, 65, 64, 62, 60]):
    notes.append({"start": 4.0 + i * 0.5, "duration": 0.45, "pitch": pitch, "velocity": 100 - i * 6})

# Measures 5-6: block chords building to fortissimo climax (I-IV-V-I)
for start, dur, pitch, vel in [
    (8.0, 1.0, 60, 85),
    (8.0, 1.0, 64, 80),
    (8.0, 1.0, 67, 75),
    (9.0, 1.0, 65, 95),
    (9.0, 1.0, 69, 90),
    (9.0, 1.0, 72, 85),
    (10.0, 1.0, 67, 120),
    (10.0, 1.0, 71, 118),
    (10.0, 1.0, 74, 115),
    (11.0, 2.0, 60, 100),
    (11.0, 2.0, 64, 95),
    (11.0, 2.0, 67, 90),
    (11.0, 2.0, 72, 85),
]:
    notes.append({"start": start, "duration": dur, "pitch": pitch, "velocity": vel})

# Measures 7-8: melodic phrase resolving gently
for start, dur, pitch, vel in [
    (13.0, 0.5, 72, 95),
    (13.5, 0.25, 74, 80),
    (13.75, 0.25, 72, 75),
    (14.0, 0.5, 71, 85),
    (14.5, 0.5, 69, 80),
    (15.0, 1.0, 67, 65),
    (15.0, 1.0, 60, 60),
]:
    notes.append({"start": start, "duration": dur, "pitch": pitch, "velocity": vel})

starts = np.array([n["start"] for n in notes])
durations = np.array([n["duration"] for n in notes])
pitches = np.array([n["pitch"] for n in notes])
velocities = np.array([n["velocity"] for n in notes])

rect_x = starts + durations / 2
rect_y = pitches.astype(float)
rect_w = durations
rect_h = np.full_like(durations, 0.82)

pitch_min = int(pitches.min()) - 1
pitch_max = int(pitches.max()) + 1

# Background key shading — theme-adaptive alternating rows for piano keyboard layout
if THEME == "light":
    white_key_color = "#FFFDF6"
    black_key_color = "#E5E1D8"
else:
    white_key_color = "#262521"
    black_key_color = "#131310"

bg_pitches = list(range(pitch_min, pitch_max + 1))
bg_source = ColumnDataSource(
    data={
        "x": [8.0] * len(bg_pitches),
        "y": [float(p) for p in bg_pitches],
        "w": [17.0] * len(bg_pitches),
        "h": [1.0] * len(bg_pitches),
        "color": [black_key_color if p in black_keys else white_key_color for p in bg_pitches],
    }
)

color_mapper = LinearColorMapper(palette=VELOCITY_PALETTE, low=40, high=127)

note_source = ColumnDataSource(
    data={
        "x": rect_x,
        "y": rect_y,
        "w": rect_w,
        "h": rect_h,
        "velocity": velocities,
        "pitch": pitches,
        "note_name": [note_names[p] for p in pitches],
        "start": starts,
        "duration": durations,
    }
)

# Title (45 chars < 67 baseline — use default 50pt)
title = "piano-roll-midi · python · bokeh · anyplot.ai"

# Plot — canvas 3200×1800, toolbar_location=None prevents extra height in PNG
p = figure(
    width=3200,
    height=1800,
    title=title,
    x_axis_label="Time (beats)",
    y_axis_label="Pitch",
    x_range=Range1d(-0.5, 16.5),
    y_range=Range1d(pitch_min - 0.5, pitch_max + 0.5),
    toolbar_location=None,
    min_border_bottom=160,
    min_border_left=180,
    min_border_top=110,
    min_border_right=80,
)

# Background piano key rows
p.rect(x="x", y="y", width="w", height="h", source=bg_source, fill_color="color", line_color=None, level="underlay")

# Custom beat/measure grid lines — measure boundaries stronger than beat lines
for beat in range(17):
    is_measure = beat % 4 == 0
    p.line(
        [beat, beat],
        [pitch_min - 0.5, pitch_max + 0.5],
        line_color=INK_SOFT,
        line_alpha=0.40 if is_measure else 0.12,
        line_width=2.5 if is_measure else 1.0,
    )

# Note rectangles colored by velocity
p.rect(
    x="x",
    y="y",
    width="w",
    height="h",
    source=note_source,
    fill_color={"field": "velocity", "transform": color_mapper},
    line_color=PAGE_BG,
    line_width=2,
    line_alpha=0.9,
)

# Hover tooltip for interactive HTML
hover = HoverTool(
    tooltips=[
        ("Note", "@note_name"),
        ("Start", "@start{0.00} beats"),
        ("Duration", "@duration{0.00} beats"),
        ("Velocity", "@velocity"),
    ]
)
p.add_tools(hover)

# Velocity color bar
color_bar = ColorBar(
    color_mapper=color_mapper,
    label_standoff=14,
    width=40,
    location=(0, 0),
    title="Velocity",
    title_text_font_size="34pt",
    title_text_color=INK,
    major_label_text_font_size="28pt",
    major_label_text_color=INK_SOFT,
    ticker=FixedTicker(ticks=[40, 60, 80, 100, 120]),
    background_fill_color=PAGE_BG,
    border_line_color=None,
)
p.add_layout(color_bar, "right")

# Style — text sizes per bokeh sizing guide
p.title.text_font_size = "50pt"
p.title.text_font_style = "normal"
p.title.text_color = INK

p.xaxis.axis_label_text_font_size = "42pt"
p.yaxis.axis_label_text_font_size = "42pt"
p.xaxis.axis_label_text_color = INK
p.yaxis.axis_label_text_color = INK

p.xaxis.major_label_text_font_size = "34pt"
p.yaxis.major_label_text_font_size = "34pt"
p.xaxis.major_label_text_color = INK_SOFT
p.yaxis.major_label_text_color = INK_SOFT

# Y-axis: note names instead of raw MIDI numbers
y_ticks = list(range(pitch_min, pitch_max + 1))
p.yaxis.ticker = FixedTicker(ticks=y_ticks)
p.yaxis.major_label_overrides = {p_val: note_names[p_val] for p_val in y_ticks}

# X-axis: integer beat numbers
p.xaxis.ticker = FixedTicker(ticks=list(range(17)))

# Theme-adaptive chrome
p.background_fill_color = PAGE_BG
p.border_fill_color = PAGE_BG
p.outline_line_color = None

p.xaxis.axis_line_color = INK_SOFT
p.yaxis.axis_line_color = INK_SOFT
p.xaxis.major_tick_line_color = INK_SOFT
p.yaxis.major_tick_line_color = INK_SOFT

p.xgrid.grid_line_color = None
p.ygrid.grid_line_color = None

# Save interactive HTML artifact
output_file(f"plot-{THEME}.html")
save(p)

# Screenshot with headless Chrome — window is H+200 tall so bokeh canvas fills
# exactly W×H; PIL crops to the target rect before saving.
W, H = 3200, 1800
opts = Options()
for arg in (
    "--headless=new",
    "--no-sandbox",
    "--disable-dev-shm-usage",
    "--disable-gpu",
    f"--window-size={W},{H + 200}",
    "--hide-scrollbars",
    "--force-device-scale-factor=1",
):
    opts.add_argument(arg)
driver = webdriver.Chrome(options=opts)
driver.set_window_size(W, H + 200)
driver.get(f"file://{Path(f'plot-{THEME}.html').resolve()}")
time.sleep(3)
raw = driver.get_screenshot_as_png()
driver.quit()
Image.open(io.BytesIO(raw)).crop((0, 0, W, H)).save(f"plot-{THEME}.png")
Runnable source as JSON, for any HTTP client: https://api.anyplot.ai/specs/piano-roll-midi/bokeh/code. Any spec id and library id listed in llms-full.txt fit the same URL shape; every URL below is complete and callable.
{
  "spec_id": "piano-roll-midi",
  "language": "python",
  "library": "bokeh",
  "page": "https://anyplot.ai/piano-roll-midi/python/bokeh",
  "hub": "https://anyplot.ai/piano-roll-midi",
  "code_json": "https://api.anyplot.ai/specs/piano-roll-midi/bokeh/code",
  "spec_json": "https://api.anyplot.ai/specs/piano-roll-midi",
  "render_light_png": "https://storage.googleapis.com/anyplot-images/plots/piano-roll-midi/python/bokeh/plot-light.png",
  "render_dark_png": "https://storage.googleapis.com/anyplot-images/plots/piano-roll-midi/python/bokeh/plot-dark.png",
  "interactive_light_html": "https://storage.googleapis.com/anyplot-images/plots/piano-roll-midi/python/bokeh/plot-light.html",
  "interactive_dark_html": "https://storage.googleapis.com/anyplot-images/plots/piano-roll-midi/python/bokeh/plot-dark.html",
  "quality_score": 91.0,
  "license": "MIT",
  "guide": "https://anyplot.ai/llms.txt"
}
Part of MIDI Piano Roll Visualization on anyplot.ai.