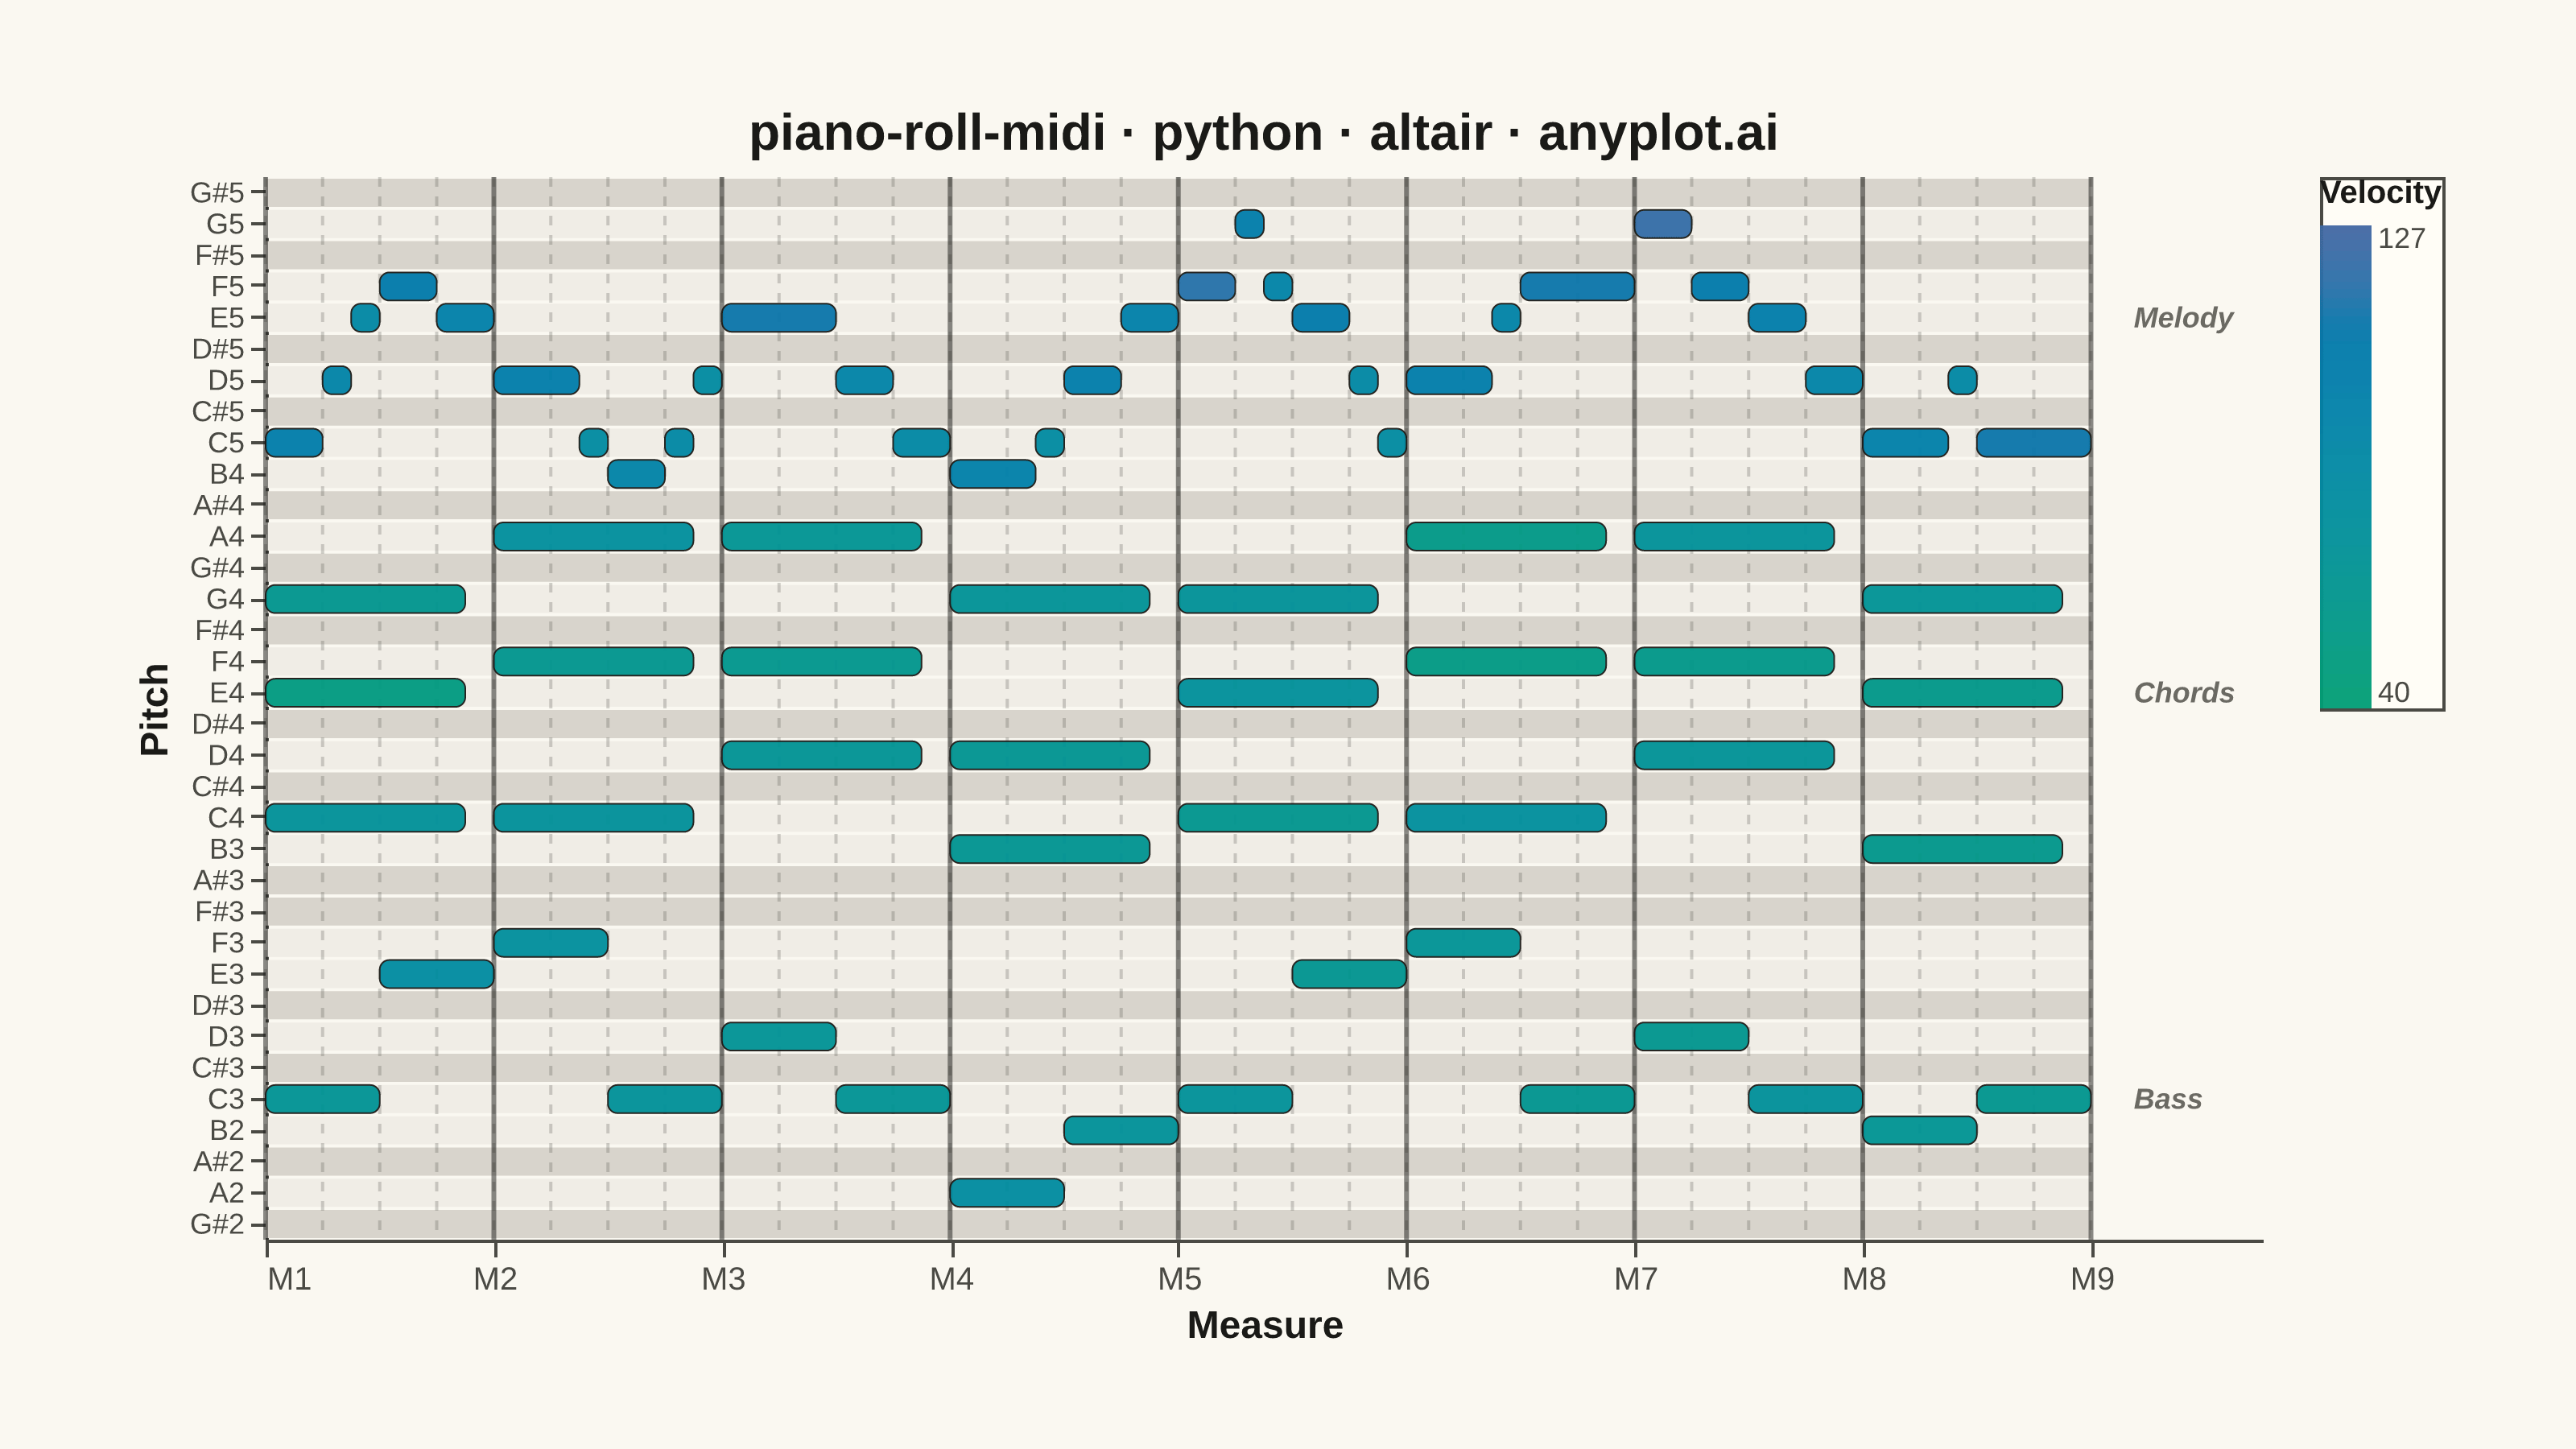
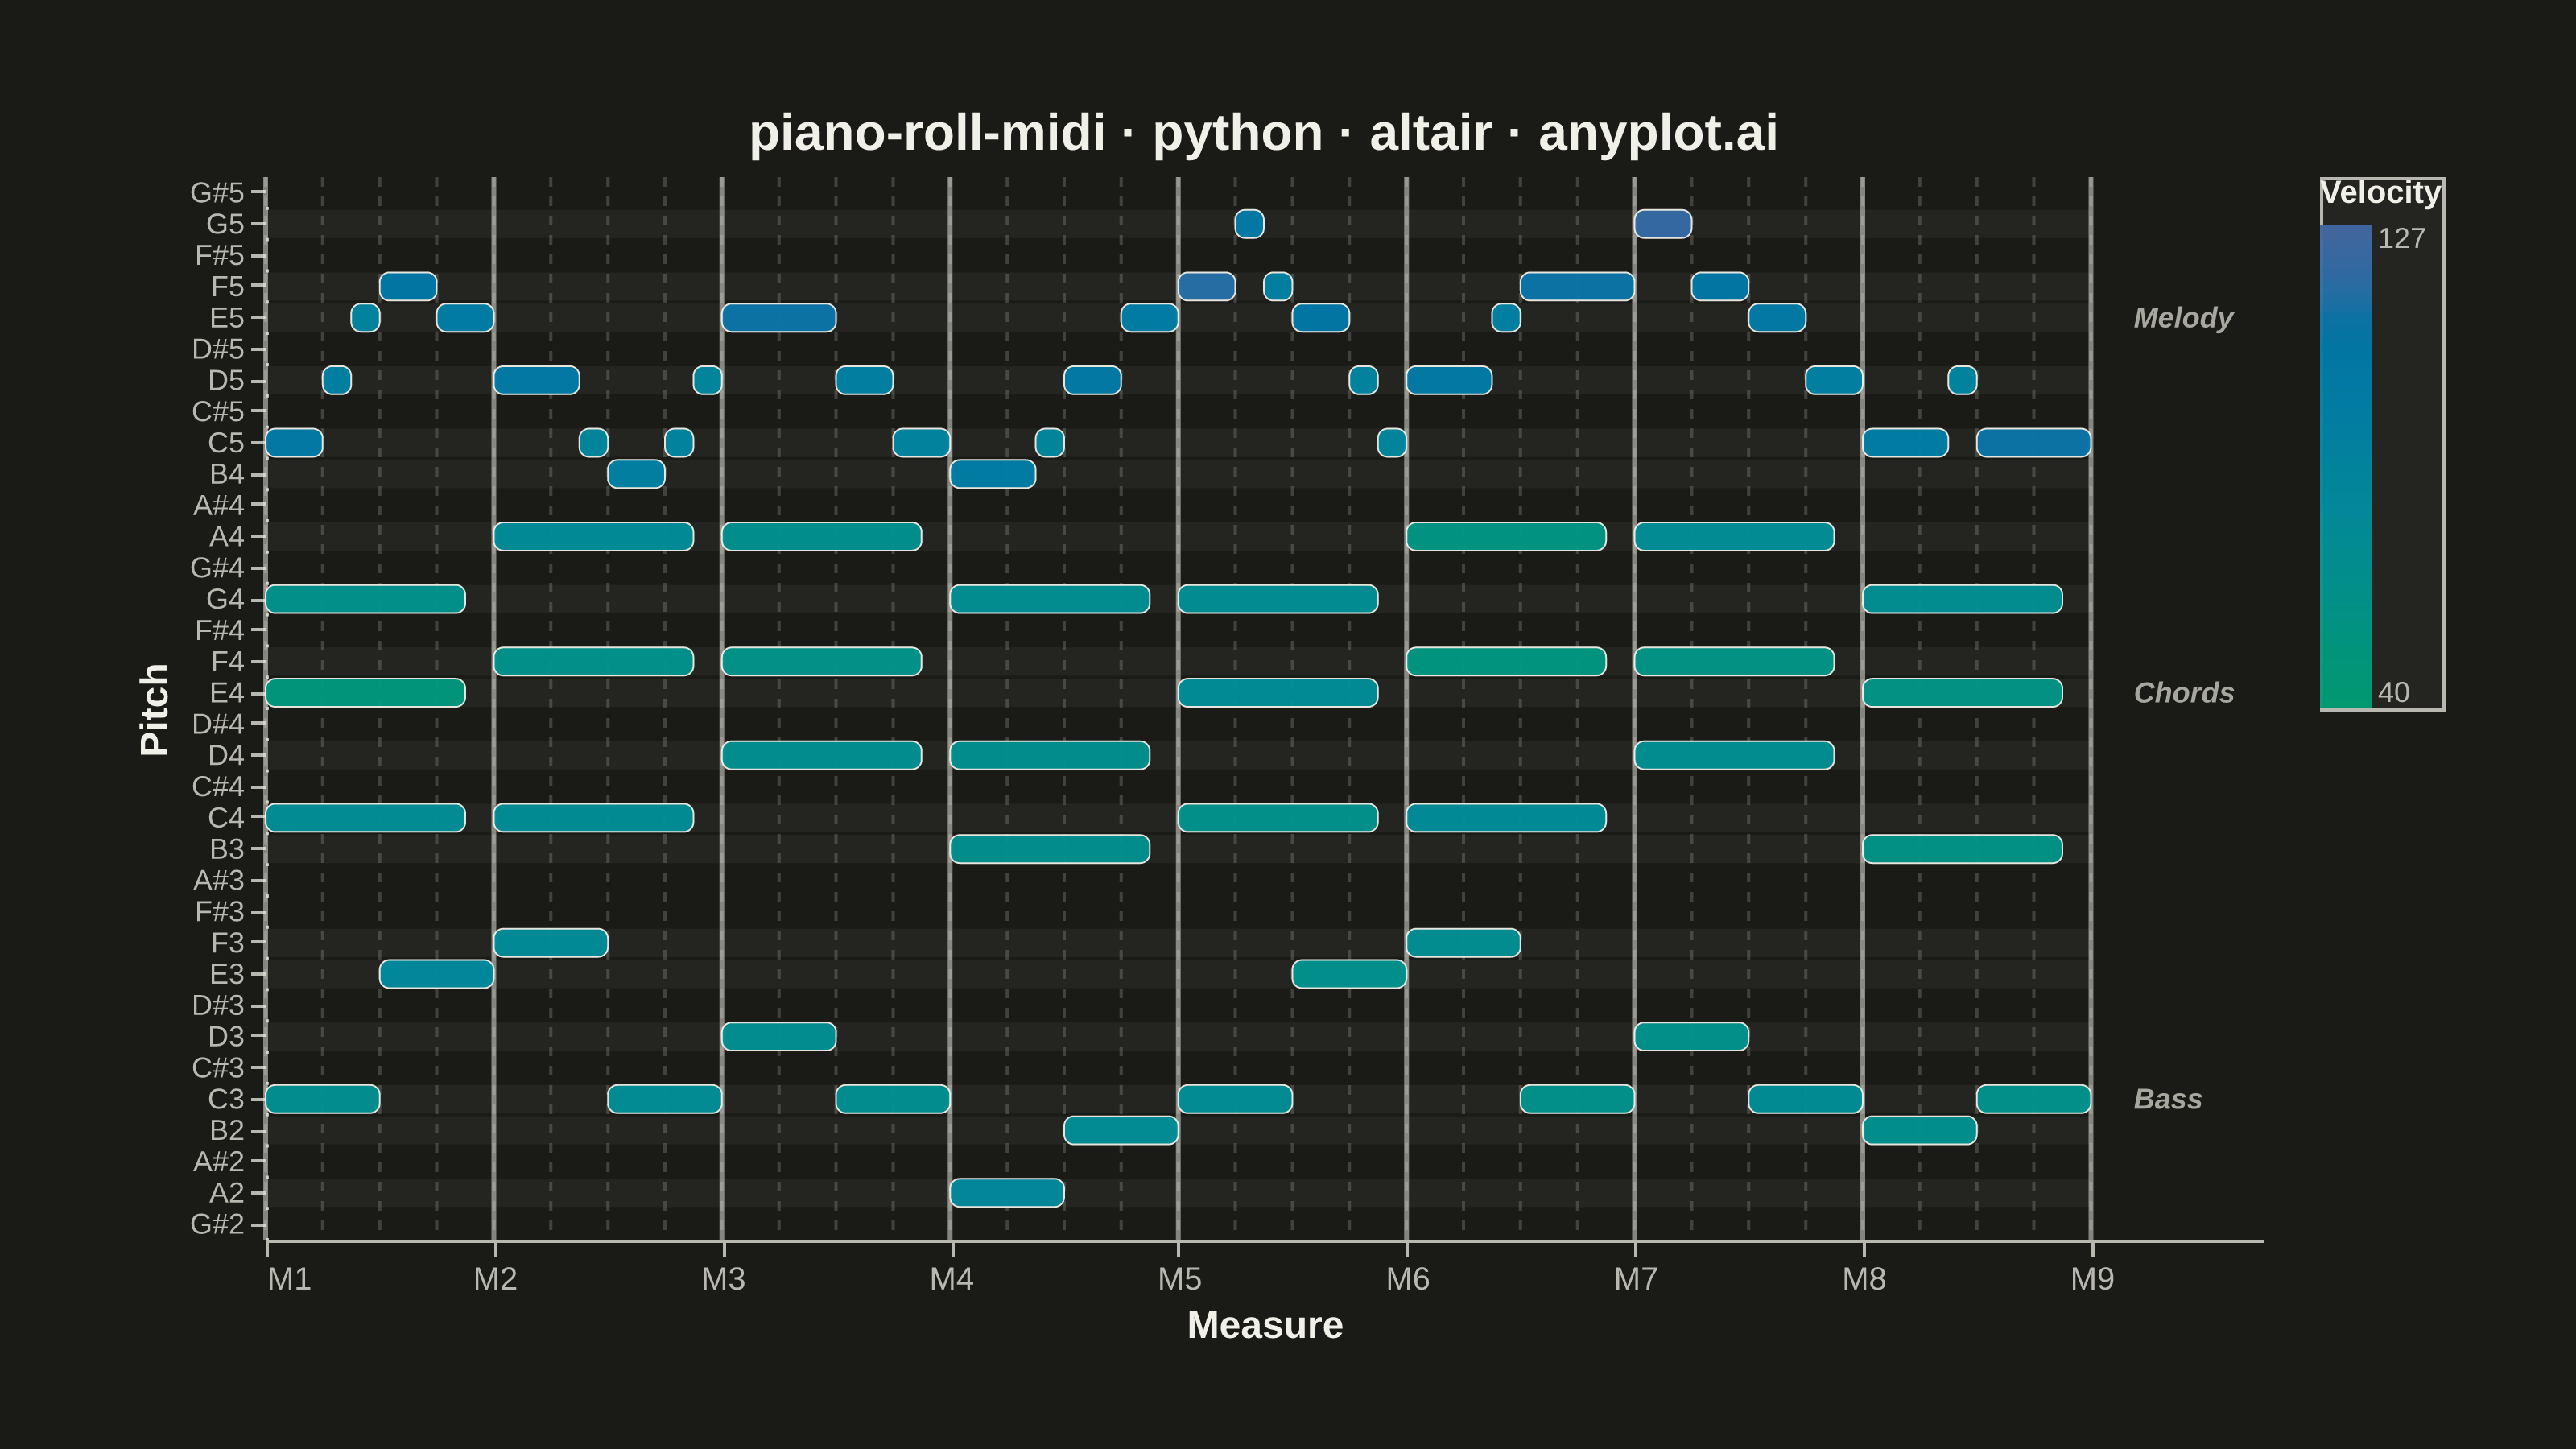
A grid-based visualization of musical notes over time, as seen in digital audio workstations (DAWs). Each note is represented as a horizontal rectangle positioned by pitch (y-axis) and time (x-axis), with bar length indicating note duration and color indicating velocity (dynamics). The background alternates between white and dark rows to mirror piano keyboard layout, with vertical grid lines marking beats and measures.
""" anyplot.ai
piano-roll-midi: MIDI Piano Roll Visualization
Library: altair 6.1.0 | Python 3.13.13
Quality: 91/100 | Updated: 2026-06-03
"""

import os
import sys


# Prevent this file from shadowing the installed altair package when run from its own directory
_thisdir = os.path.dirname(os.path.abspath(__file__))
sys.path = [p for p in sys.path if os.path.abspath(p or ".") != _thisdir]
del _thisdir

import altair as alt
import numpy as np
import pandas as pd
from PIL import Image


# Theme tokens (Imprint palette + theme-adaptive chrome)
THEME = os.getenv("ANYPLOT_THEME", "light")
PAGE_BG = "#FAF8F1" if THEME == "light" else "#1A1A17"
ELEVATED_BG = "#FFFDF6" if THEME == "light" else "#242420"
INK = "#1A1A17" if THEME == "light" else "#F0EFE8"
INK_SOFT = "#4A4A44" if THEME == "light" else "#B8B7B0"
INK_MUTED = "#6B6A63" if THEME == "light" else "#A8A79F"

# Piano key row shading (theme-adaptive alternating background)
WHITE_KEY_BG = "#F0EDE6" if THEME == "light" else "#242420"
BLACK_KEY_BG = "#D8D4CC" if THEME == "light" else "#1A1A17"

# Data: C major progression with melody over 8 measures (32 beats)
np.random.seed(42)
NOTE_NAMES = ["C", "C#", "D", "D#", "E", "F", "F#", "G", "G#", "A", "A#", "B"]

notes = []

# Bass line (A2–F3)
bass_pattern = [
    (0, 2, 48),
    (2, 2, 52),
    (4, 2, 53),
    (6, 2, 48),
    (8, 2, 50),
    (10, 2, 48),
    (12, 2, 45),
    (14, 2, 47),
    (16, 2, 48),
    (18, 2, 52),
    (20, 2, 53),
    (22, 2, 48),
    (24, 2, 50),
    (26, 2, 48),
    (28, 2, 47),
    (30, 2, 48),
]
for start, dur, pitch in bass_pattern:
    notes.append({"start": start, "duration": dur, "pitch": pitch, "velocity": np.random.randint(60, 80)})

# Chord voicings (B3–A4)
chord_hits = [
    (0, [60, 64, 67]),
    (4, [60, 65, 69]),
    (8, [62, 65, 69]),
    (12, [59, 62, 67]),
    (16, [60, 64, 67]),
    (20, [60, 65, 69]),
    (24, [62, 65, 69]),
    (28, [59, 64, 67]),
]
for start, pitches in chord_hits:
    for p in pitches:
        notes.append({"start": start, "duration": 3.5, "pitch": p, "velocity": np.random.randint(50, 75)})

# Melody (B4–G5, varying rhythms and dynamics)
melody = [
    (0, 1, 72, 100),
    (1, 0.5, 74, 90),
    (1.5, 0.5, 76, 85),
    (2, 1, 77, 105),
    (3, 1, 76, 95),
    (4, 1.5, 74, 100),
    (5.5, 0.5, 72, 80),
    (6, 1, 71, 90),
    (7, 0.5, 72, 85),
    (7.5, 0.5, 74, 80),
    (8, 2, 76, 110),
    (10, 1, 74, 90),
    (11, 1, 72, 85),
    (12, 1.5, 71, 95),
    (13.5, 0.5, 72, 80),
    (14, 1, 74, 100),
    (15, 1, 76, 95),
    (16, 1, 77, 115),
    (17, 0.5, 79, 100),
    (17.5, 0.5, 77, 90),
    (18, 1, 76, 105),
    (19, 0.5, 74, 85),
    (19.5, 0.5, 72, 80),
    (20, 1.5, 74, 100),
    (21.5, 0.5, 76, 90),
    (22, 2, 77, 110),
    (24, 1, 79, 120),
    (25, 1, 77, 105),
    (26, 1, 76, 100),
    (27, 1, 74, 90),
    (28, 1.5, 72, 95),
    (29.5, 0.5, 74, 85),
    (30, 2, 72, 110),
]
for start, dur, pitch, vel in melody:
    notes.append({"start": start, "duration": dur, "pitch": pitch, "velocity": vel})

df = pd.DataFrame(notes)
df["end"] = df["start"] + df["duration"]
df["note_name"] = df["pitch"].apply(lambda p: f"{NOTE_NAMES[p % 12]}{p // 12 - 1}")

# Display pitch range: used pitches ± 1 semitone for piano key context
used_pitches = set(df["pitch"].unique())
pitch_min = df["pitch"].min() - 1
pitch_max = df["pitch"].max() + 1
display_pitches = set()
for p in used_pitches:
    display_pitches.update([p - 1, p, p + 1])
all_pitches = sorted([p for p in display_pitches if pitch_min <= p <= pitch_max])

# Sort order: low pitch at bottom (descending list for Altair nominal axis)
pitch_labels = [f"{NOTE_NAMES[p % 12]}{p // 12 - 1}" for p in reversed(all_pitches)]

# Piano key background rows (black semitones: C#, D#, F#, G#, A#)
BLACK_SEMITONES = {1, 3, 6, 8, 10}
bg_rows = [
    {
        "pitch": p,
        "note_name": f"{NOTE_NAMES[p % 12]}{p // 12 - 1}",
        "is_black": (p % 12) in BLACK_SEMITONES,
        "start": 0.0,
        "end": 32.0,
    }
    for p in all_pitches
]
bg_df = pd.DataFrame(bg_rows)

# Musical layer classification for legend-bound selection
df["layer"] = df["pitch"].apply(lambda p: "Bass" if p < 55 else ("Chords" if p < 70 else "Melody"))

# Selections: layer toggle (legend) + measure brush (HTML only)
layer_selection = alt.selection_point(fields=["layer"], bind="legend")
brush = alt.selection_interval(encodings=["x"])

# Layer 1: Alternating piano key row shading
background = (
    alt.Chart(bg_df)
    .mark_bar()
    .encode(
        x=alt.X("start:Q", scale=alt.Scale(domain=[0, 32])),
        x2="end:Q",
        y=alt.Y("note_name:N", sort=pitch_labels),
        color=alt.condition(alt.datum.is_black, alt.value(BLACK_KEY_BG), alt.value(WHITE_KEY_BG)),
    )
)

# Layer 2: Beat grid lines (dashed, subtle)
beat_positions = pd.DataFrame({"beat": list(range(33))})
beat_grid = (
    alt.Chart(beat_positions).mark_rule(strokeDash=[3, 3], opacity=0.25, color=INK_SOFT).encode(x=alt.X("beat:Q"))
)

# Layer 3: Measure boundary lines (solid, stronger)
measure_positions = pd.DataFrame({"beat": list(range(0, 33, 4))})
measure_grid = alt.Chart(measure_positions).mark_rule(opacity=0.5, color=INK, strokeWidth=1.5).encode(x=alt.X("beat:Q"))

# Layer 4: Note bars — Imprint sequential velocity (soft=green #009E73, loud=blue #4467A3)
note_bars = (
    alt.Chart(df)
    .mark_bar(cornerRadius=3, stroke=INK, strokeWidth=0.5)
    .encode(
        x=alt.X(
            "start:Q",
            title="Measure",
            axis=alt.Axis(
                labelFontSize=10,
                titleFontSize=12,
                values=list(range(0, 33, 4)),
                labelExpr="'M' + (datum.value / 4 + 1)",
            ),
        ),
        x2="end:Q",
        y=alt.Y("note_name:N", sort=pitch_labels, title="Pitch", axis=alt.Axis(labelFontSize=9, titleFontSize=12)),
        color=alt.Color(
            "velocity:Q",
            title="Velocity",
            scale=alt.Scale(range=["#009E73", "#4467A3"], domain=[40, 127]),
            legend=alt.Legend(titleFontSize=10, labelFontSize=9, orient="right", gradientLength=150),
        ),
        opacity=alt.condition(layer_selection, alt.value(0.95), alt.value(0.15)),
        tooltip=[
            alt.Tooltip("note_name:N", title="Note"),
            alt.Tooltip("layer:N", title="Layer"),
            alt.Tooltip("start:Q", title="Start (beat)"),
            alt.Tooltip("duration:Q", title="Duration"),
            alt.Tooltip("velocity:Q", title="Velocity"),
        ],
    )
    .add_params(layer_selection)
)

# Layer 5: Musical layer labels at right margin
layer_label_data = pd.DataFrame(
    [
        {"x": 32.3, "note_name": "C3", "label": "Bass"},
        {"x": 32.3, "note_name": "E4", "label": "Chords"},
        {"x": 32.3, "note_name": "E5", "label": "Melody"},
    ]
)
layer_labels = (
    alt.Chart(layer_label_data)
    .mark_text(align="left", dx=8, fontSize=9, fontWeight="bold", color=INK_MUTED, fontStyle="italic")
    .encode(x=alt.X("x:Q"), y=alt.Y("note_name:N", sort=pitch_labels), text="label:N")
)

# Title: 46 chars < 67 baseline → fontSize=16 (no scaling needed)
title = "piano-roll-midi · python · altair · anyplot.ai"

# Compose all five layers with full theme-adaptive configuration
chart = (
    (background + beat_grid + measure_grid + note_bars + layer_labels)
    .properties(
        width=620, height=330, background=PAGE_BG, title=alt.Title(text=title, fontSize=16, anchor="middle", color=INK)
    )
    .configure_view(fill=PAGE_BG, strokeWidth=0)
    .configure_axis(grid=False, domainColor=INK_SOFT, tickColor=INK_SOFT, labelColor=INK_SOFT, titleColor=INK)
    .configure_legend(fillColor=ELEVATED_BG, strokeColor=INK_SOFT, labelColor=INK_SOFT, titleColor=INK)
)

# Save PNG and pad to exact canvas target (3200 × 1800)
TW, TH = 3200, 1800
chart.save(f"plot-{THEME}.png", scale_factor=4.0)

_img = Image.open(f"plot-{THEME}.png").convert("RGB")
_w, _h = _img.size
if _w > TW or _h > TH:
    raise SystemExit(
        f"altair vl-convert produced {_w}×{_h}, exceeds target {TW}×{TH}. "
        "Shrink chart .properties(width=, height=) values and re-render."
    )
if _w < TW or _h < TH:
    _canvas = Image.new("RGB", (TW, TH), PAGE_BG)
    _canvas.paste(_img, ((TW - _w) // 2, (TH - _h) // 2))
    _canvas.save(f"plot-{THEME}.png")

# Save interactive HTML (adds measure brush selection)
chart.add_params(brush).save(f"plot-{THEME}.html")
Runnable source as JSON, for any HTTP client: https://api.anyplot.ai/specs/piano-roll-midi/altair/code. Any spec id and library id listed in llms-full.txt fit the same URL shape; every URL below is complete and callable.
{
  "spec_id": "piano-roll-midi",
  "language": "python",
  "library": "altair",
  "page": "https://anyplot.ai/piano-roll-midi/python/altair",
  "hub": "https://anyplot.ai/piano-roll-midi",
  "code_json": "https://api.anyplot.ai/specs/piano-roll-midi/altair/code",
  "spec_json": "https://api.anyplot.ai/specs/piano-roll-midi",
  "render_light_png": "https://storage.googleapis.com/anyplot-images/plots/piano-roll-midi/python/altair/plot-light.png",
  "render_dark_png": "https://storage.googleapis.com/anyplot-images/plots/piano-roll-midi/python/altair/plot-dark.png",
  "interactive_light_html": "https://storage.googleapis.com/anyplot-images/plots/piano-roll-midi/python/altair/plot-light.html",
  "interactive_dark_html": "https://storage.googleapis.com/anyplot-images/plots/piano-roll-midi/python/altair/plot-dark.html",
  "quality_score": 91.0,
  "license": "MIT",
  "guide": "https://anyplot.ai/llms.txt"
}
Part of MIDI Piano Roll Visualization on anyplot.ai.