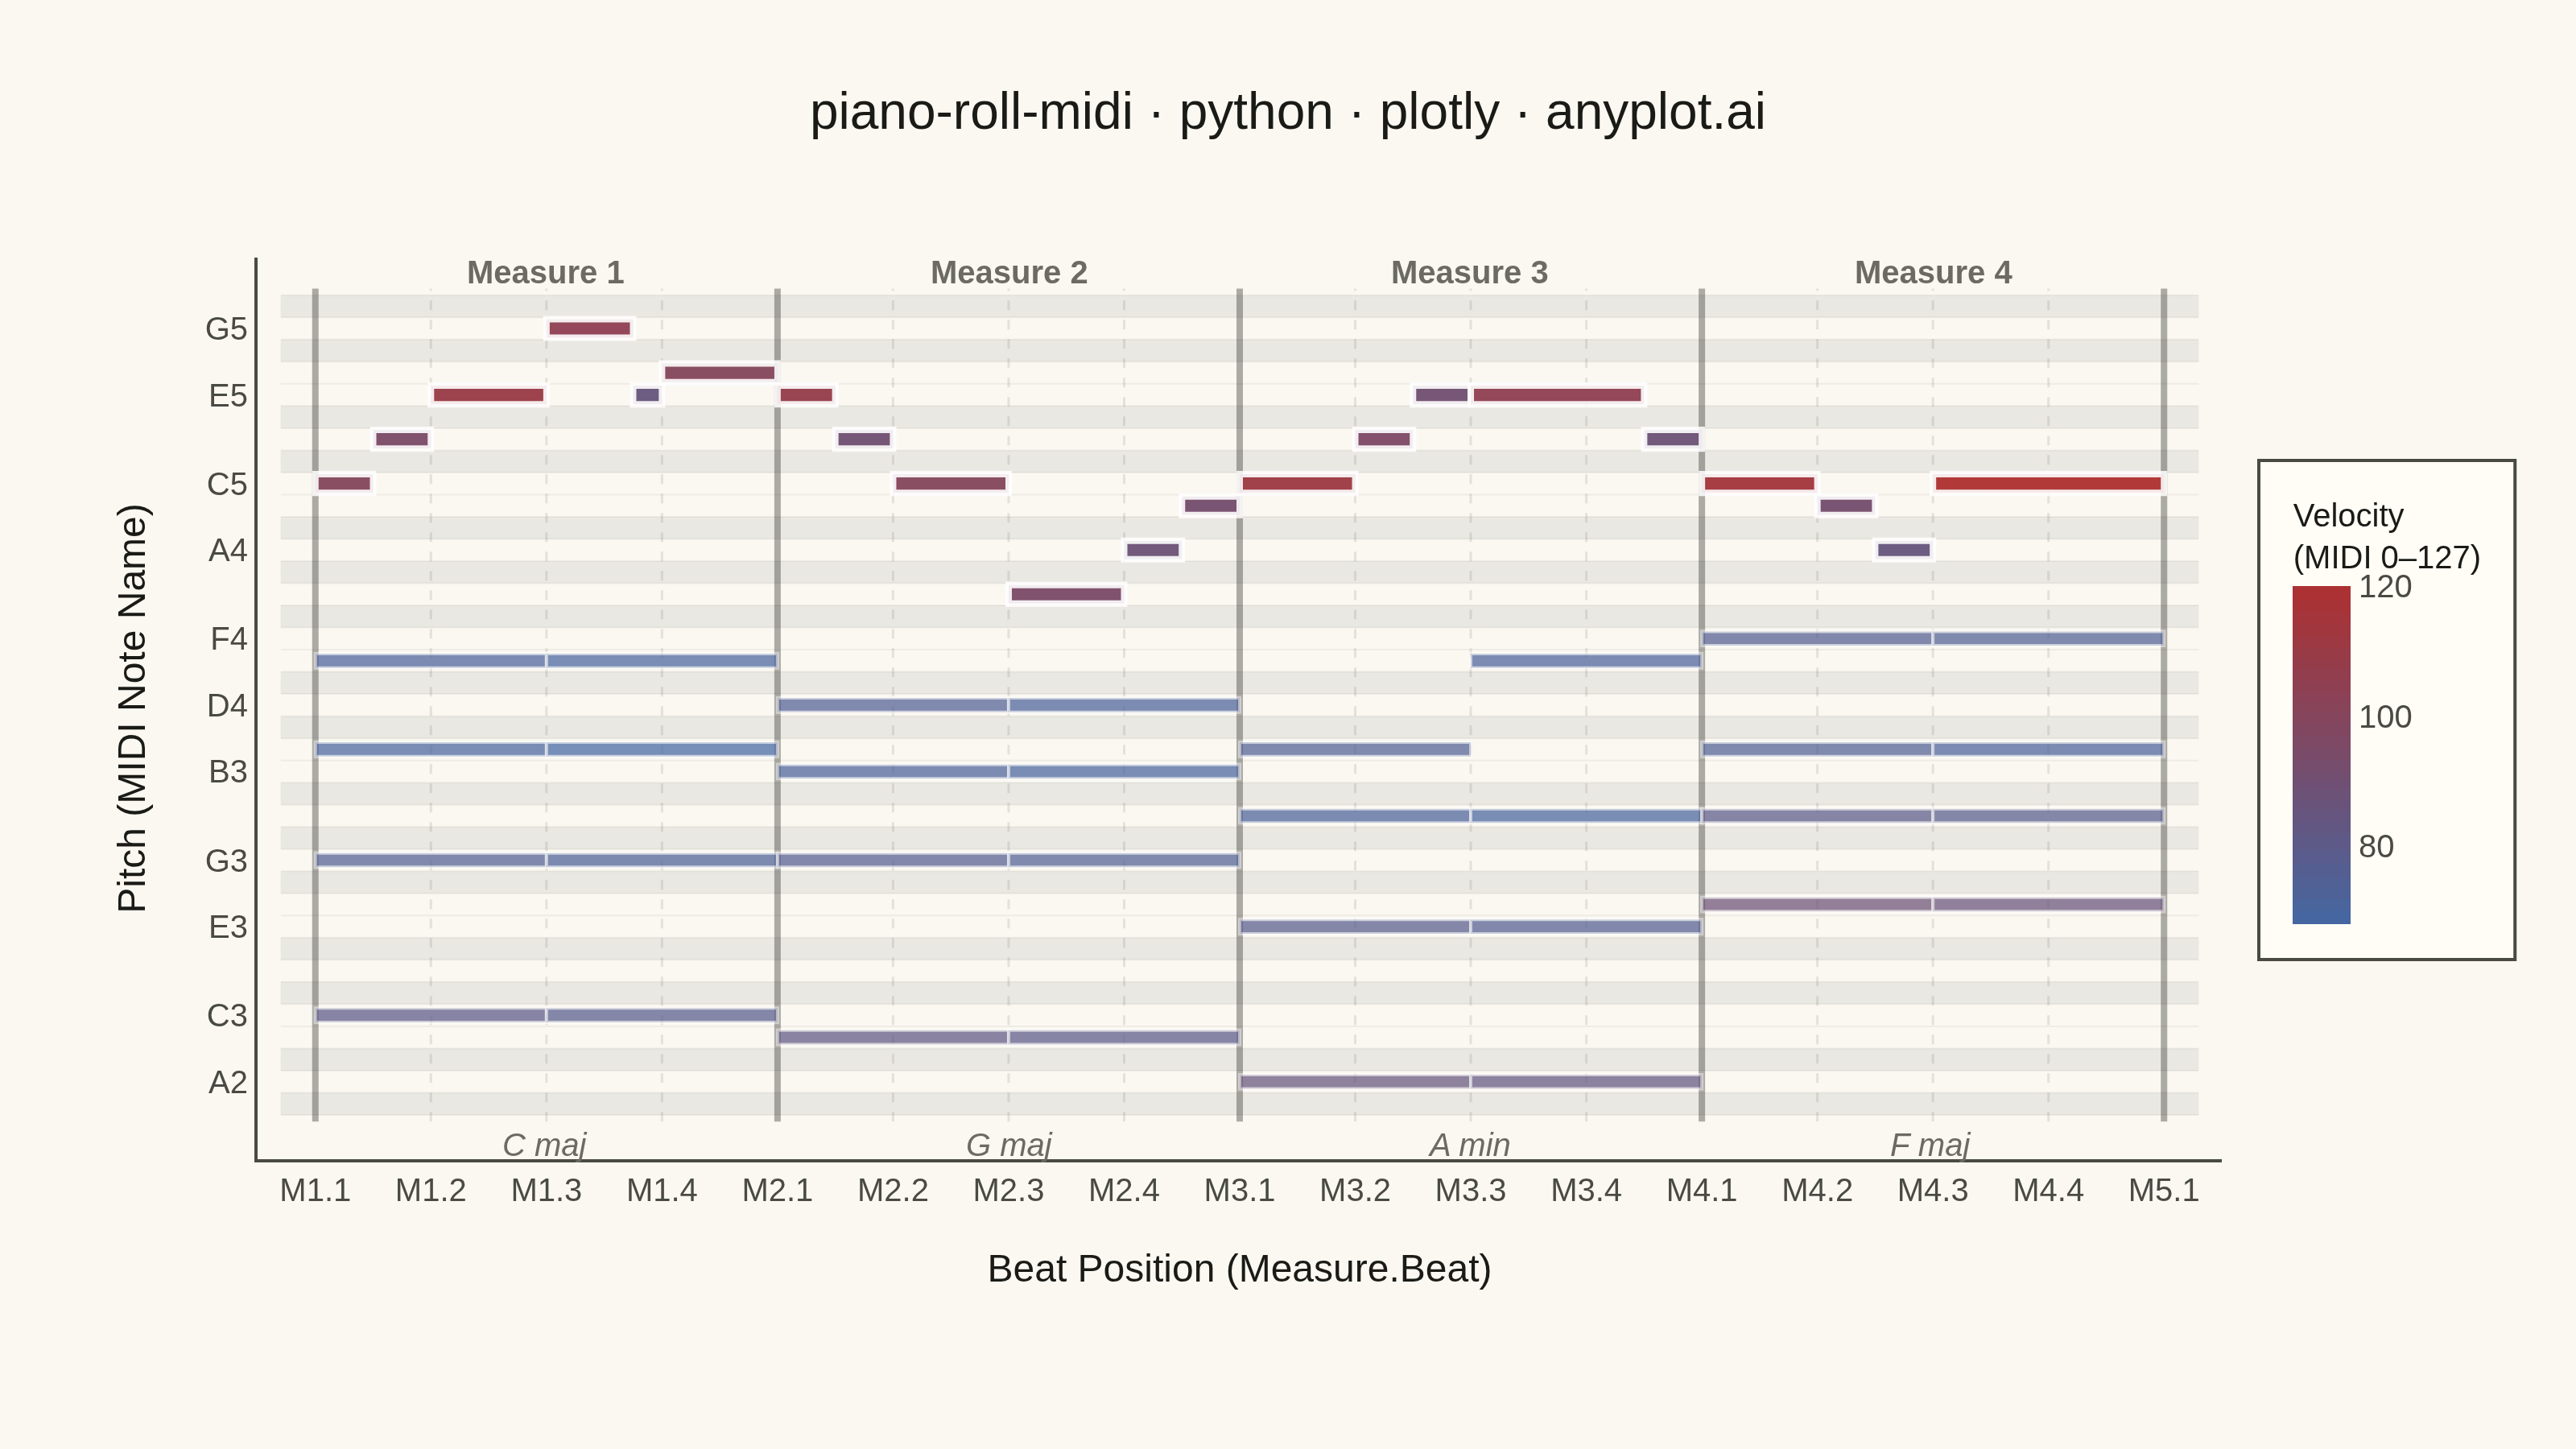
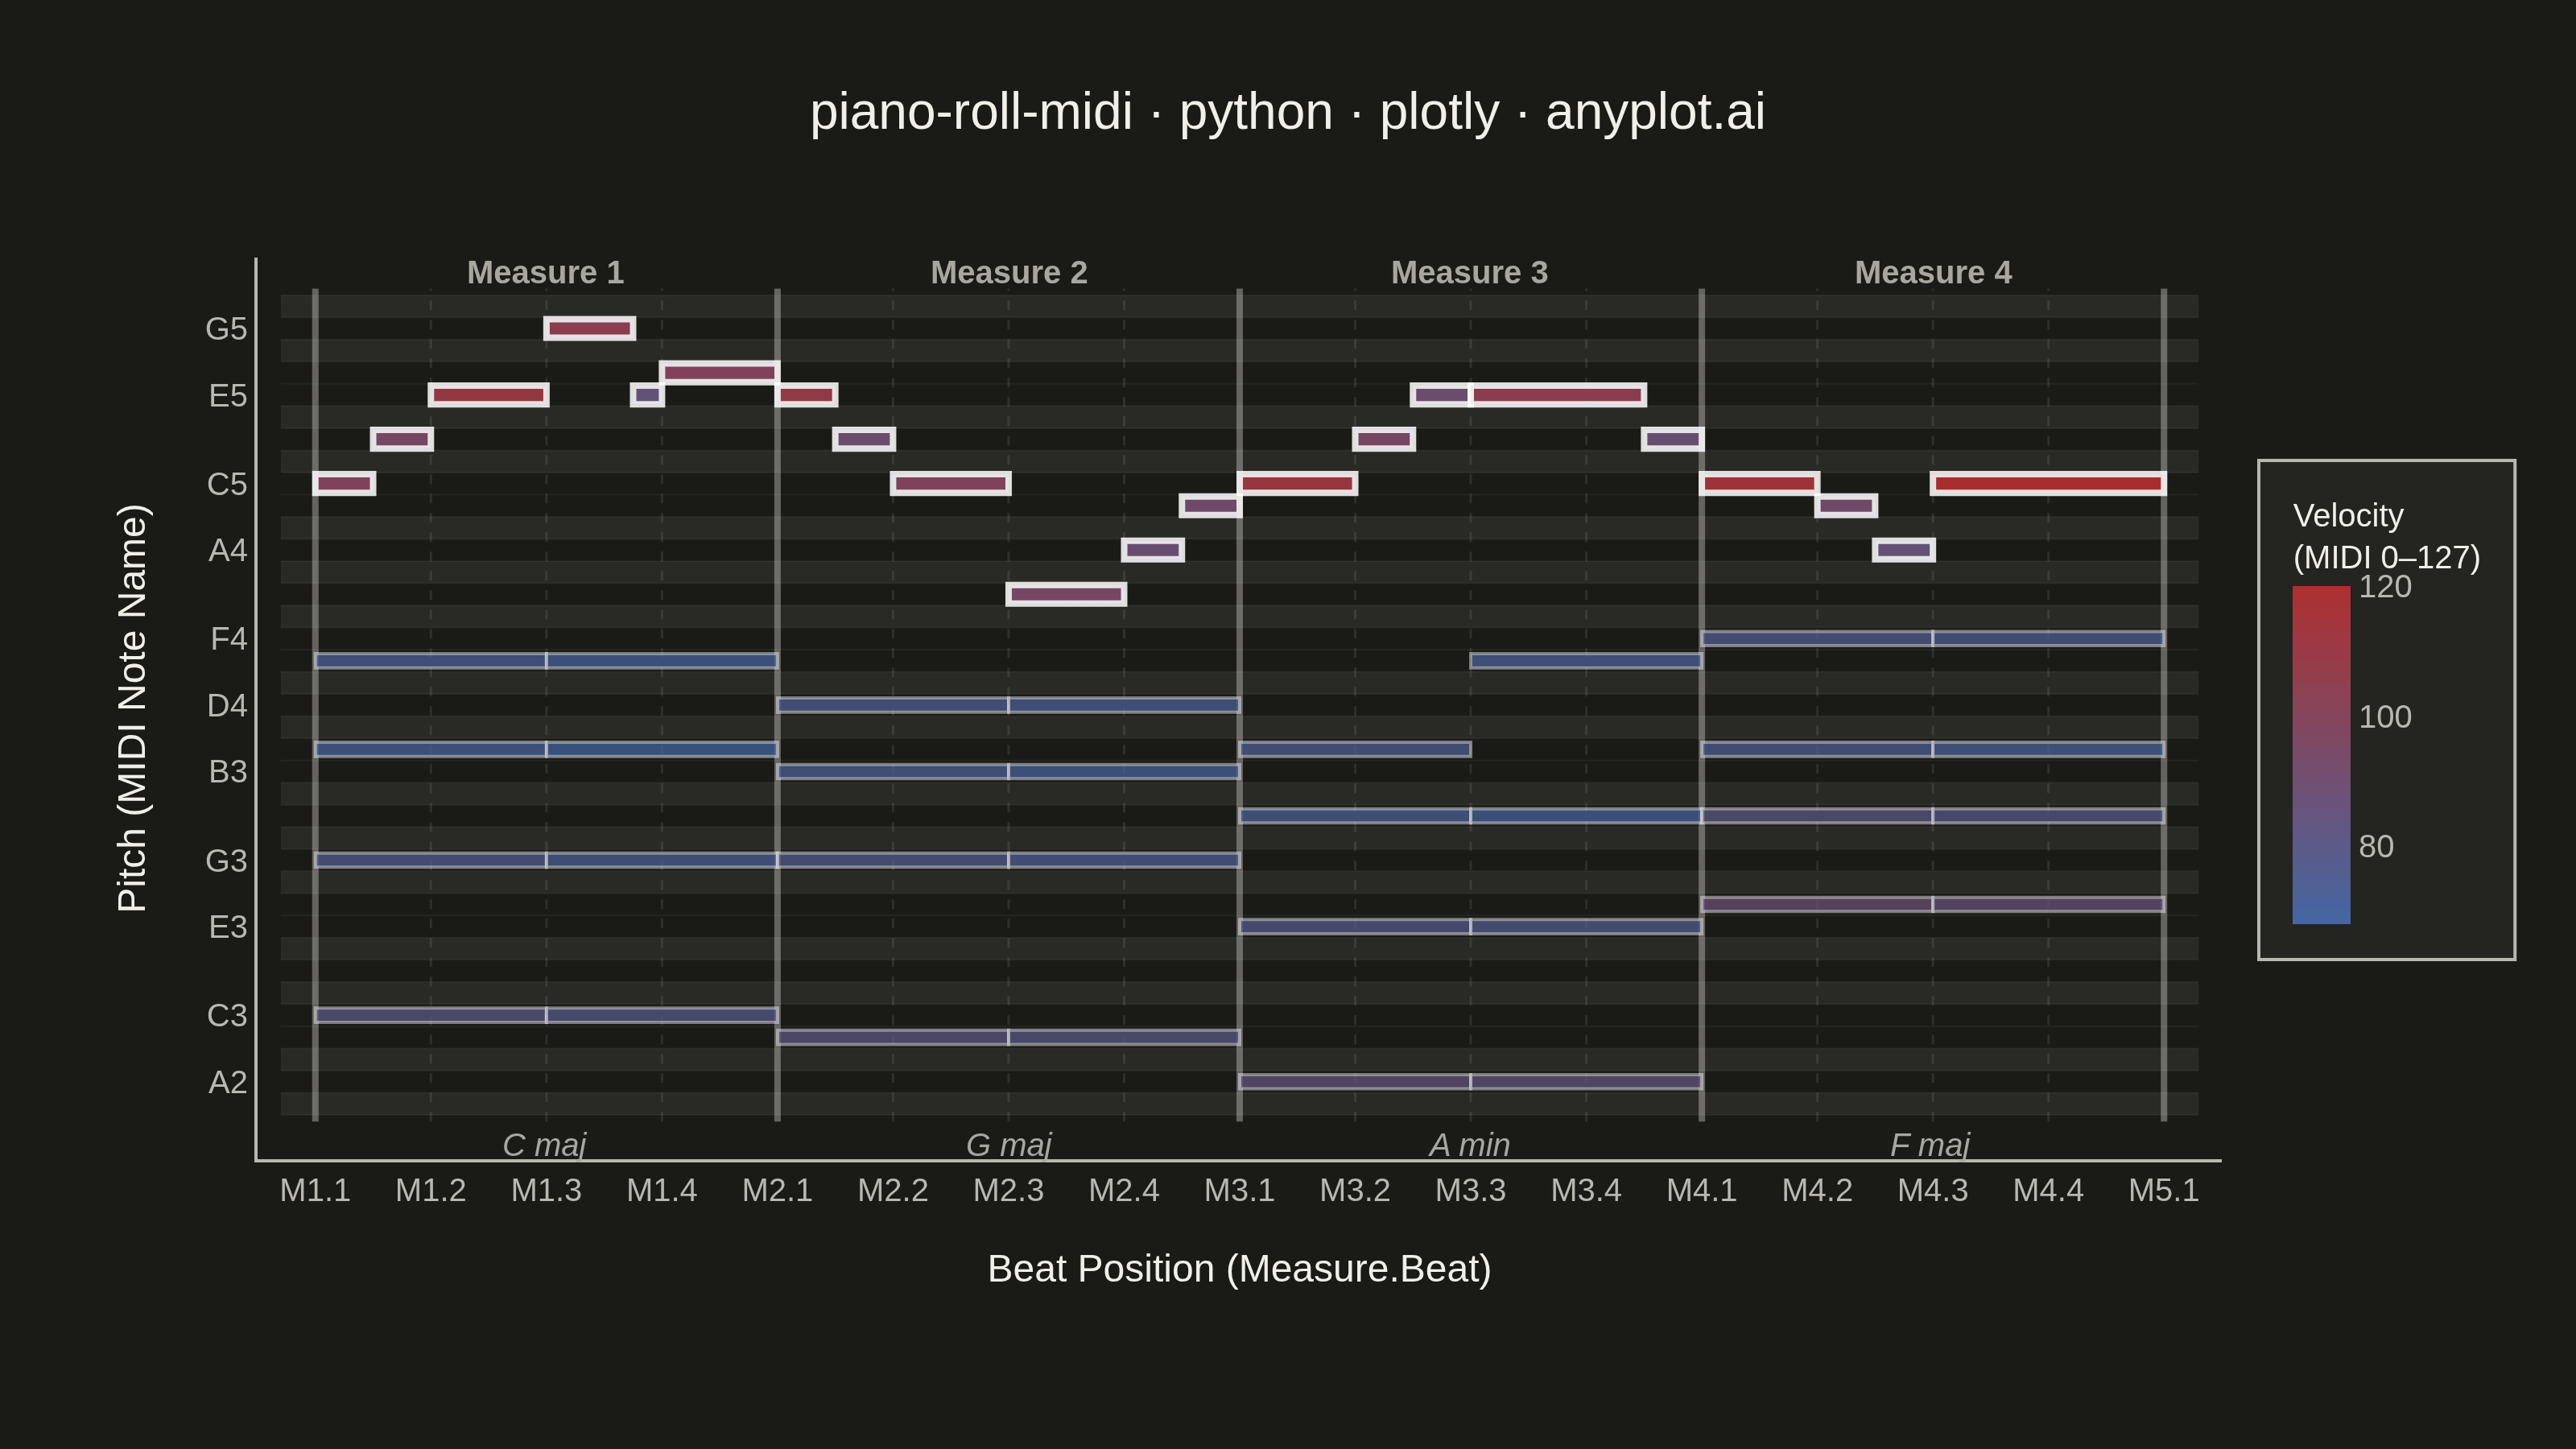
A grid-based visualization of musical notes over time, as seen in digital audio workstations (DAWs). Each note is represented as a horizontal rectangle positioned by pitch (y-axis) and time (x-axis), with bar length indicating note duration and color indicating velocity (dynamics). The background alternates between white and dark rows to mirror piano keyboard layout, with vertical grid lines marking beats and measures.
""" anyplot.ai
piano-roll-midi: MIDI Piano Roll Visualization
Library: plotly 6.7.0 | Python 3.13.13
Quality: 90/100 | Updated: 2026-06-03
"""

import os
import sys


# Prevent this file from shadowing the plotly package (same-name script workaround)
sys.path = [p for p in sys.path if p != os.path.dirname(os.path.abspath(__file__))]

import numpy as np
import plotly.graph_objects as go


# Theme tokens
THEME = os.getenv("ANYPLOT_THEME", "light")
PAGE_BG = "#FAF8F1" if THEME == "light" else "#1A1A17"
ELEVATED_BG = "#FFFDF6" if THEME == "light" else "#242420"
INK = "#1A1A17" if THEME == "light" else "#F0EFE8"
INK_SOFT = "#4A4A44" if THEME == "light" else "#B8B7B0"
INK_MUTED = "#6B6A63" if THEME == "light" else "#A8A79F"

# Velocity colorscale: Imprint blue (soft/piano) → Imprint red (forte/loud)
VEL_SCALE = [[0.0, "#4467A3"], [1.0, "#AE3030"]]

# Data - C major chord progression (I-V-vi-IV) with melody over 4 measures
NOTE_NAMES = ["C", "C#", "D", "D#", "E", "F", "F#", "G", "G#", "A", "A#", "B"]
BLACK_KEY_INDICES = {1, 3, 6, 8, 10}

notes = [
    # (start_beat, duration, midi_pitch, velocity)
    # Measure 1 - C major chord
    (0.0, 2.0, 48, 80),
    (0.0, 2.0, 55, 75),
    (0.0, 2.0, 60, 70),
    (0.0, 2.0, 64, 72),
    (0.0, 0.5, 72, 100),
    (0.5, 0.5, 74, 95),
    (1.0, 1.0, 76, 110),
    (2.0, 2.0, 48, 78),
    (2.0, 2.0, 55, 73),
    (2.0, 2.0, 60, 68),
    (2.0, 2.0, 64, 70),
    (2.0, 0.75, 79, 105),
    (2.75, 0.25, 76, 85),
    (3.0, 1.0, 77, 100),
    # Measure 2 - G major chord
    (4.0, 2.0, 47, 82),
    (4.0, 2.0, 55, 76),
    (4.0, 2.0, 59, 72),
    (4.0, 2.0, 62, 74),
    (4.0, 0.5, 76, 108),
    (4.5, 0.5, 74, 90),
    (5.0, 1.0, 72, 100),
    (6.0, 2.0, 47, 80),
    (6.0, 2.0, 55, 74),
    (6.0, 2.0, 59, 70),
    (6.0, 2.0, 62, 72),
    (6.0, 1.0, 67, 95),
    (7.0, 0.5, 69, 88),
    (7.5, 0.5, 71, 92),
    # Measure 3 - A minor chord
    (8.0, 2.0, 45, 85),
    (8.0, 2.0, 52, 78),
    (8.0, 2.0, 57, 72),
    (8.0, 2.0, 60, 74),
    (8.0, 1.0, 72, 112),
    (9.0, 0.5, 74, 96),
    (9.5, 0.5, 76, 90),
    (10.0, 2.0, 45, 83),
    (10.0, 2.0, 52, 76),
    (10.0, 2.0, 57, 70),
    (10.0, 2.0, 64, 72),
    (10.0, 1.5, 76, 105),
    (11.5, 0.5, 74, 88),
    # Measure 4 - F major chord
    (12.0, 2.0, 53, 88),
    (12.0, 2.0, 57, 80),
    (12.0, 2.0, 60, 74),
    (12.0, 2.0, 65, 76),
    (12.0, 1.0, 72, 115),
    (13.0, 0.5, 71, 92),
    (13.5, 0.5, 69, 85),
    (14.0, 2.0, 53, 86),
    (14.0, 2.0, 57, 78),
    (14.0, 2.0, 60, 72),
    (14.0, 2.0, 65, 74),
    (14.0, 2.0, 72, 120),
]

starts = np.array([n[0] for n in notes])
durations = np.array([n[1] for n in notes])
pitches = np.array([n[2] for n in notes])
velocities = np.array([n[3] for n in notes])

pitch_min = int(pitches.min()) - 1
pitch_max = int(pitches.max()) + 1
total_beats = 16
beats_per_measure = 4

# Classify notes: melody (highest pitch per onset) vs accompaniment
is_melody = np.zeros(len(notes), dtype=bool)
for s in np.unique(starts):
    mask = starts == s
    idx = np.where(mask)[0]
    is_melody[idx[np.argmax(pitches[idx])]] = True

# Velocity → color: Imprint blue (#4467A3 = soft) → Imprint red (#AE3030 = loud)
vel_min, vel_max = float(velocities.min()), float(velocities.max())
vel_norm = (velocities - vel_min) / (vel_max - vel_min)
_r0, _g0, _b0 = 0x44, 0x67, 0xA3
_r1, _g1, _b1 = 0xAE, 0x30, 0x30
note_colors = [
    f"rgb({int(_r0 + v * (_r1 - _r0))},{int(_g0 + v * (_g1 - _g0))},{int(_b0 + v * (_b1 - _b0))})" for v in vel_norm
]

# Theme-adaptive structural colors
black_key_fill = "rgba(26,26,23,0.07)" if THEME == "light" else "rgba(240,239,232,0.07)"
measure_line = "rgba(26,26,23,0.35)" if THEME == "light" else "rgba(240,239,232,0.35)"
beat_line = "rgba(26,26,23,0.10)" if THEME == "light" else "rgba(240,239,232,0.10)"
pitch_line = "rgba(26,26,23,0.05)" if THEME == "light" else "rgba(240,239,232,0.05)"

MIN_VIS_WIDTH = 0.12

# Plot
fig = go.Figure()

# Black key row shading
for p in range(pitch_min, pitch_max + 1):
    if (p % 12) in BLACK_KEY_INDICES:
        fig.add_shape(
            type="rect",
            x0=-0.3,
            x1=total_beats + 0.3,
            y0=p - 0.5,
            y1=p + 0.5,
            fillcolor=black_key_fill,
            line={"width": 0},
            layer="below",
        )

# Measure boundary lines
for m in range(total_beats // beats_per_measure + 1):
    fig.add_shape(
        type="line",
        x0=m * beats_per_measure,
        x1=m * beats_per_measure,
        y0=pitch_min - 0.8,
        y1=pitch_max + 0.8,
        line={"color": measure_line, "width": 2},
        layer="below",
    )

# Beat subdivision grid lines
for b in range(total_beats + 1):
    if b % beats_per_measure != 0:
        fig.add_shape(
            type="line",
            x0=b,
            x1=b,
            y0=pitch_min - 0.8,
            y1=pitch_max + 0.8,
            line={"color": beat_line, "width": 0.75, "dash": "dot"},
            layer="below",
        )

# Horizontal pitch separator lines
for p in range(pitch_min, pitch_max + 2):
    fig.add_shape(
        type="line",
        x0=-0.3,
        x1=total_beats + 0.3,
        y0=p - 0.5,
        y1=p - 0.5,
        line={"color": pitch_line, "width": 0.5},
        layer="below",
    )

# Measure number labels
for m in range(total_beats // beats_per_measure):
    fig.add_annotation(
        x=m * beats_per_measure + beats_per_measure / 2,
        y=pitch_max + 1.5,
        text=f"<b>Measure {m + 1}</b>",
        showarrow=False,
        font={"size": 10, "color": INK_MUTED, "family": "Arial"},
        yref="y",
    )

# Chord labels below the roll
chord_names = ["C maj", "G maj", "A min", "F maj"]
for m, chord in enumerate(chord_names):
    fig.add_annotation(
        x=m * beats_per_measure + beats_per_measure / 2,
        y=pitch_min - 1.8,
        text=f"<i>{chord}</i>",
        showarrow=False,
        font={"size": 10, "color": INK_MUTED, "family": "Arial"},
        yref="y",
    )

# Note rectangles — melody notes taller/more opaque for visual hierarchy
for i in range(len(notes)):
    vis_dur = max(durations[i], MIN_VIS_WIDTH)
    height = 0.42 if is_melody[i] else 0.32
    opacity = 0.95 if is_melody[i] else 0.72
    border_w = 2.0 if is_melody[i] else 1.0
    border_col = "rgba(255,255,255,0.9)" if is_melody[i] else "rgba(255,255,255,0.6)"
    fig.add_shape(
        type="rect",
        x0=starts[i],
        x1=starts[i] + vis_dur,
        y0=pitches[i] - height,
        y1=pitches[i] + height,
        fillcolor=note_colors[i],
        line={"color": border_col, "width": border_w},
        layer="above",
        opacity=opacity,
    )

# Invisible scatter: hover tooltips + colorbar
hover_labels = [
    f"{'♪ ' if is_melody[i] else ''}{NOTE_NAMES[p % 12]}{p // 12 - 1}"
    f"<br>Beat: {s:.1f}<br>Duration: {d:.2g} beats<br>Velocity: {v}"
    f"<br>{'Melody' if is_melody[i] else 'Accompaniment'}"
    for i, (s, d, p, v) in enumerate(notes)
]
fig.add_trace(
    go.Scatter(
        x=starts + durations / 2,
        y=pitches,
        mode="markers",
        marker={
            "size": 1,
            "opacity": 0,
            "color": velocities,
            "colorscale": VEL_SCALE,
            "colorbar": {
                "title": {"text": "Velocity<br>(MIDI 0–127)", "font": {"size": 10, "color": INK}},
                "tickfont": {"size": 10, "color": INK_SOFT},
                "thickness": 18,
                "len": 0.55,
                "outlinewidth": 0,
                "y": 0.5,
                "bgcolor": ELEVATED_BG,
                "bordercolor": INK_SOFT,
                "borderwidth": 1,
            },
            "cmin": int(vel_min),
            "cmax": int(vel_max),
        },
        text=hover_labels,
        hoverinfo="text",
        showlegend=False,
    )
)

# Y-axis: every other white key to avoid crowding at half-step pairs
pitch_range = list(range(pitch_min, pitch_max + 1))
white_keys = [p for p in pitch_range if (p % 12) not in BLACK_KEY_INDICES]
display_pitches = white_keys[::2]
display_labels = [f"{NOTE_NAMES[p % 12]}{p // 12 - 1}" for p in display_pitches]

# X-axis: measure.beat labels
beat_ticks = list(range(total_beats + 1))
beat_labels = [f"M{b // beats_per_measure + 1}.{b % beats_per_measure + 1}" for b in beat_ticks]

title_text = "piano-roll-midi · python · plotly · anyplot.ai"
title_n = len(title_text)
title_fontsize = round(16 * 67 / title_n) if title_n > 67 else 16

# Style
fig.update_layout(
    autosize=False,
    title={
        "text": title_text,
        "font": {"size": title_fontsize, "family": "Arial, sans-serif", "color": INK},
        "x": 0.5,
        "xanchor": "center",
    },
    xaxis={
        "title": {"text": "Beat Position (Measure.Beat)", "font": {"size": 12, "color": INK}},
        "tickvals": beat_ticks,
        "ticktext": beat_labels,
        "tickfont": {"size": 10, "color": INK_SOFT},
        "range": [-0.5, total_beats + 0.5],
        "showgrid": False,
        "zeroline": False,
        "linecolor": INK_SOFT,
    },
    yaxis={
        "title": {"text": "Pitch (MIDI Note Name)", "font": {"size": 12, "color": INK}},
        "tickvals": display_pitches,
        "ticktext": display_labels,
        "tickfont": {"size": 10, "color": INK_SOFT},
        "range": [pitch_min - 2.5, pitch_max + 2.2],
        "showgrid": False,
        "zeroline": False,
        "linecolor": INK_SOFT,
    },
    paper_bgcolor=PAGE_BG,
    plot_bgcolor=PAGE_BG,
    font={"family": "Arial, Helvetica, sans-serif", "color": INK},
    margin={"l": 80, "r": 110, "t": 80, "b": 90},
)

# Save
fig.write_image(f"plot-{THEME}.png", width=800, height=450, scale=4)
fig.write_html(f"plot-{THEME}.html", include_plotlyjs="cdn")
Runnable source as JSON, for any HTTP client: https://api.anyplot.ai/specs/piano-roll-midi/plotly/code. Any spec id and library id listed in llms-full.txt fit the same URL shape; every URL below is complete and callable.
{
  "spec_id": "piano-roll-midi",
  "language": "python",
  "library": "plotly",
  "page": "https://anyplot.ai/piano-roll-midi/python/plotly",
  "hub": "https://anyplot.ai/piano-roll-midi",
  "code_json": "https://api.anyplot.ai/specs/piano-roll-midi/plotly/code",
  "spec_json": "https://api.anyplot.ai/specs/piano-roll-midi",
  "render_light_png": "https://storage.googleapis.com/anyplot-images/plots/piano-roll-midi/python/plotly/plot-light.png",
  "render_dark_png": "https://storage.googleapis.com/anyplot-images/plots/piano-roll-midi/python/plotly/plot-dark.png",
  "interactive_light_html": "https://storage.googleapis.com/anyplot-images/plots/piano-roll-midi/python/plotly/plot-light.html",
  "interactive_dark_html": "https://storage.googleapis.com/anyplot-images/plots/piano-roll-midi/python/plotly/plot-dark.html",
  "quality_score": 90.0,
  "license": "MIT",
  "guide": "https://anyplot.ai/llms.txt"
}
Part of MIDI Piano Roll Visualization on anyplot.ai.