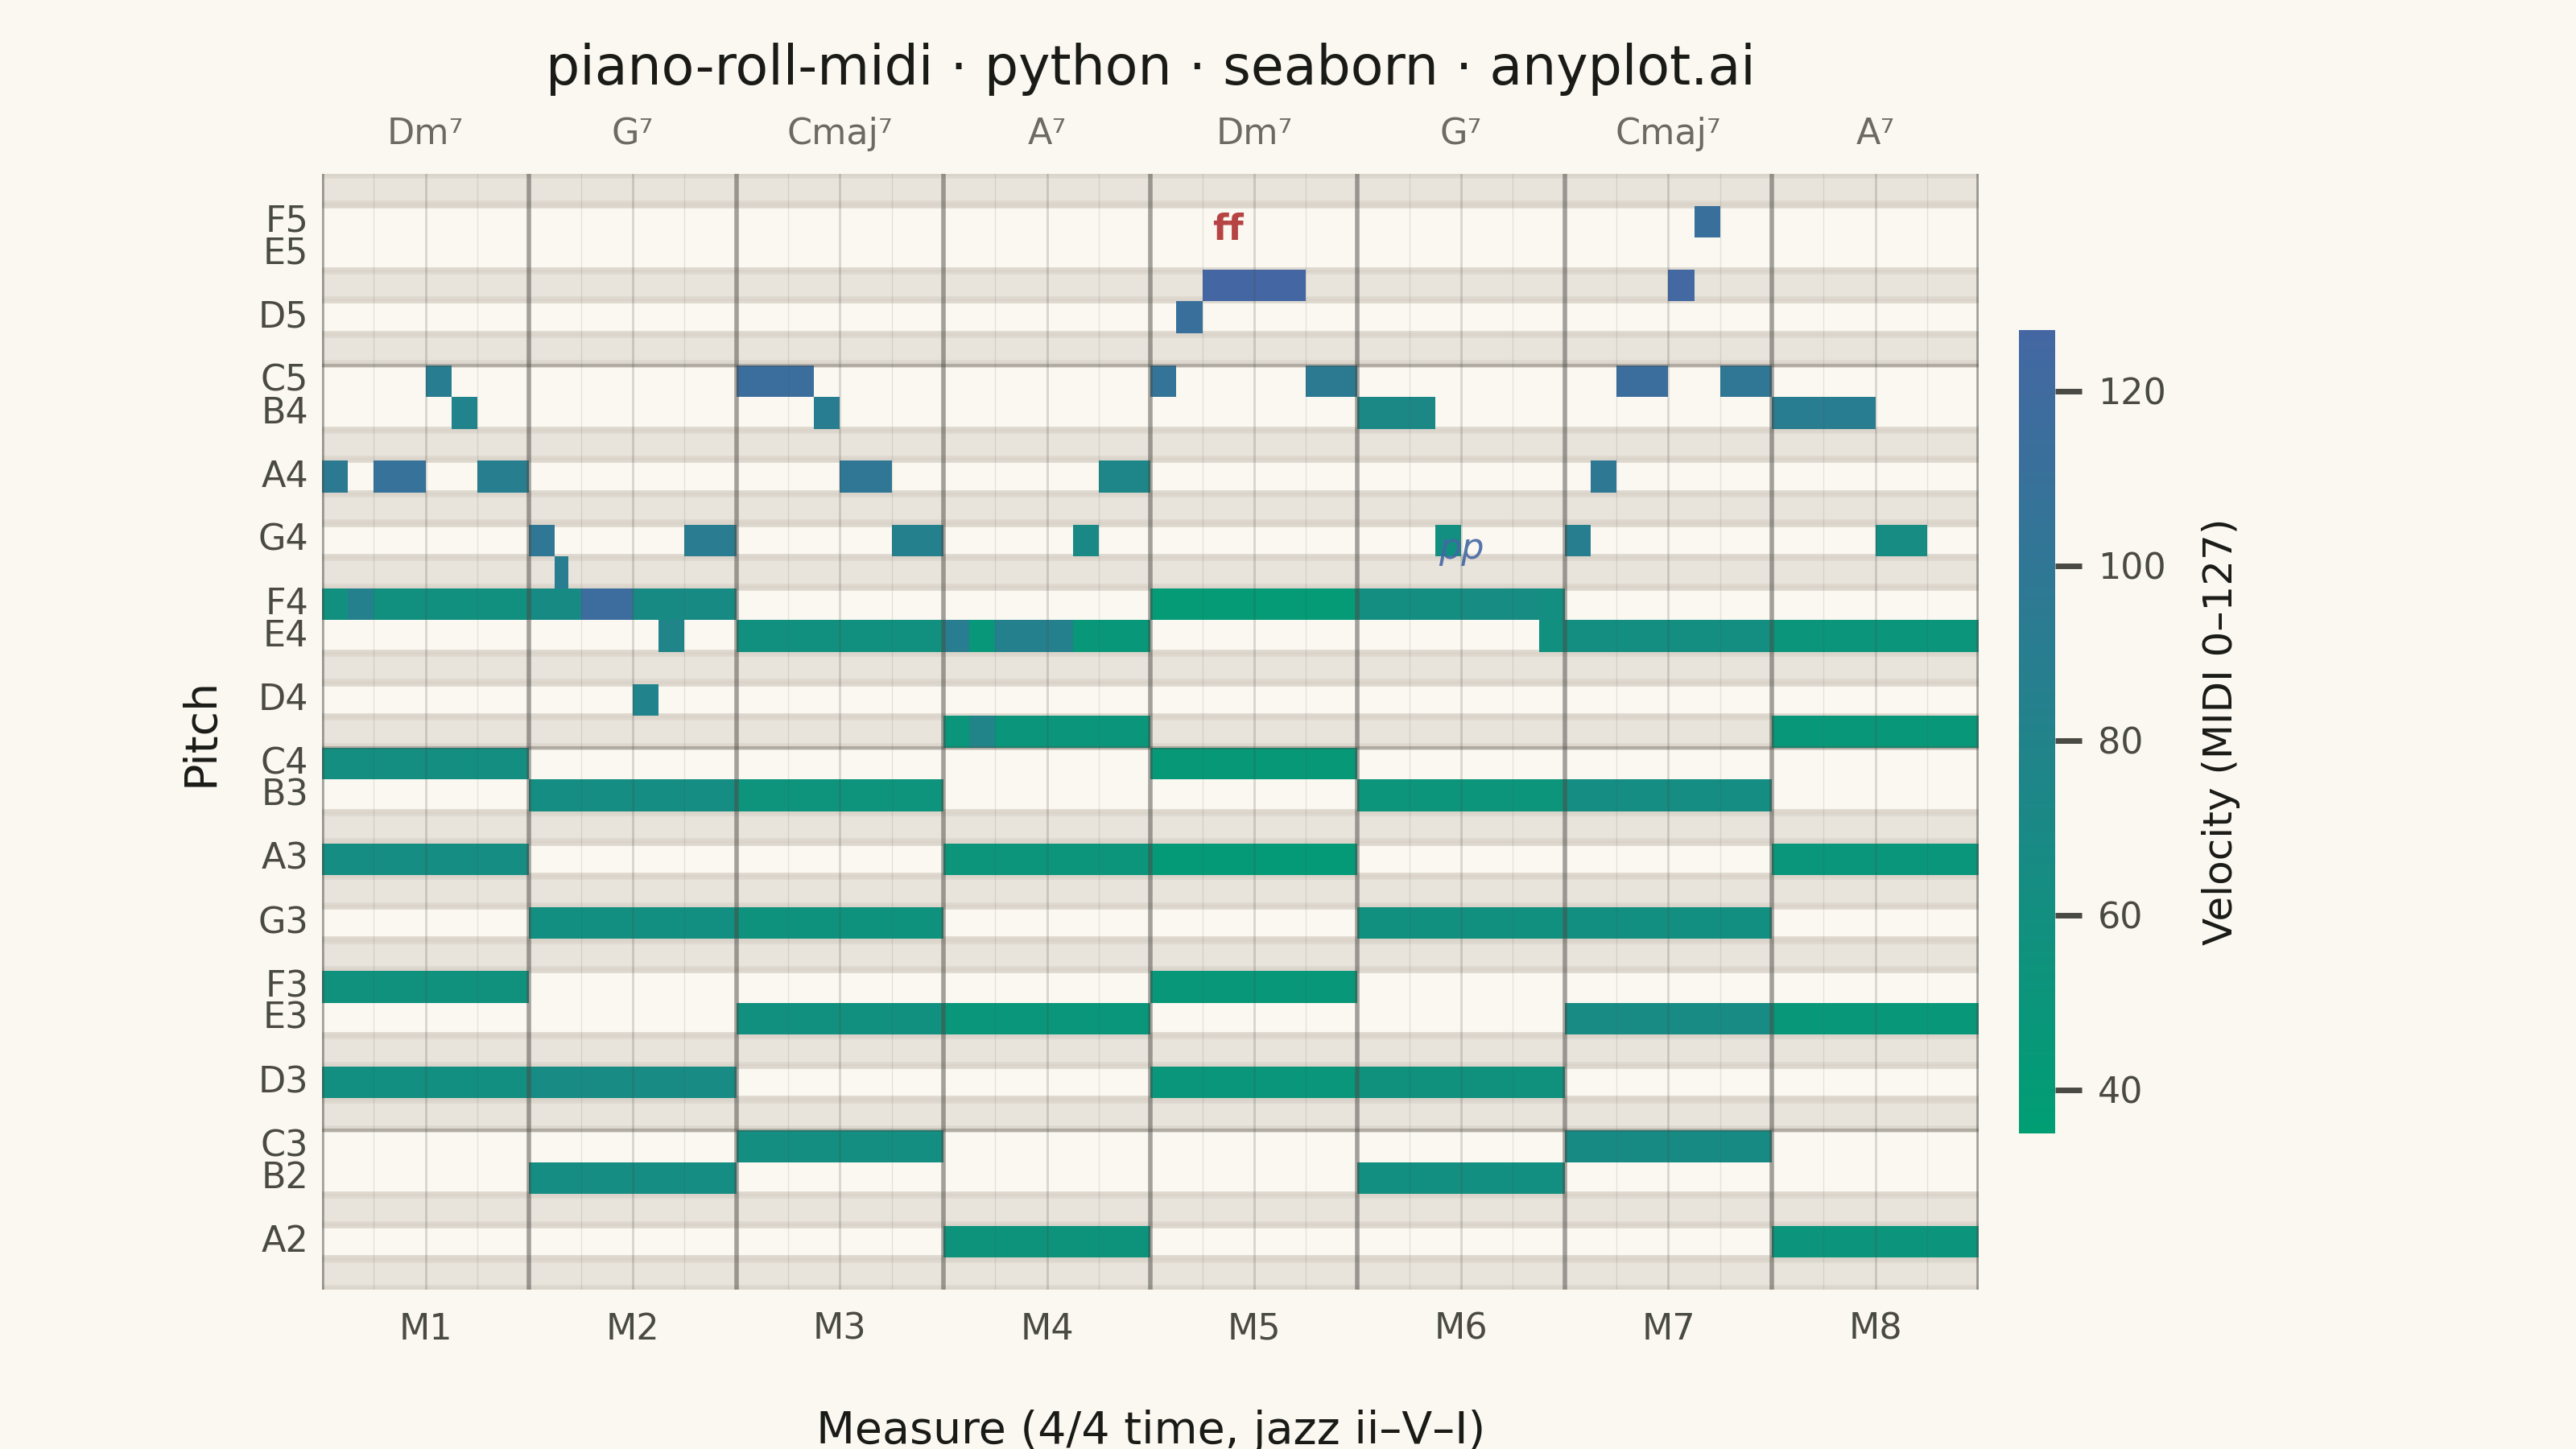
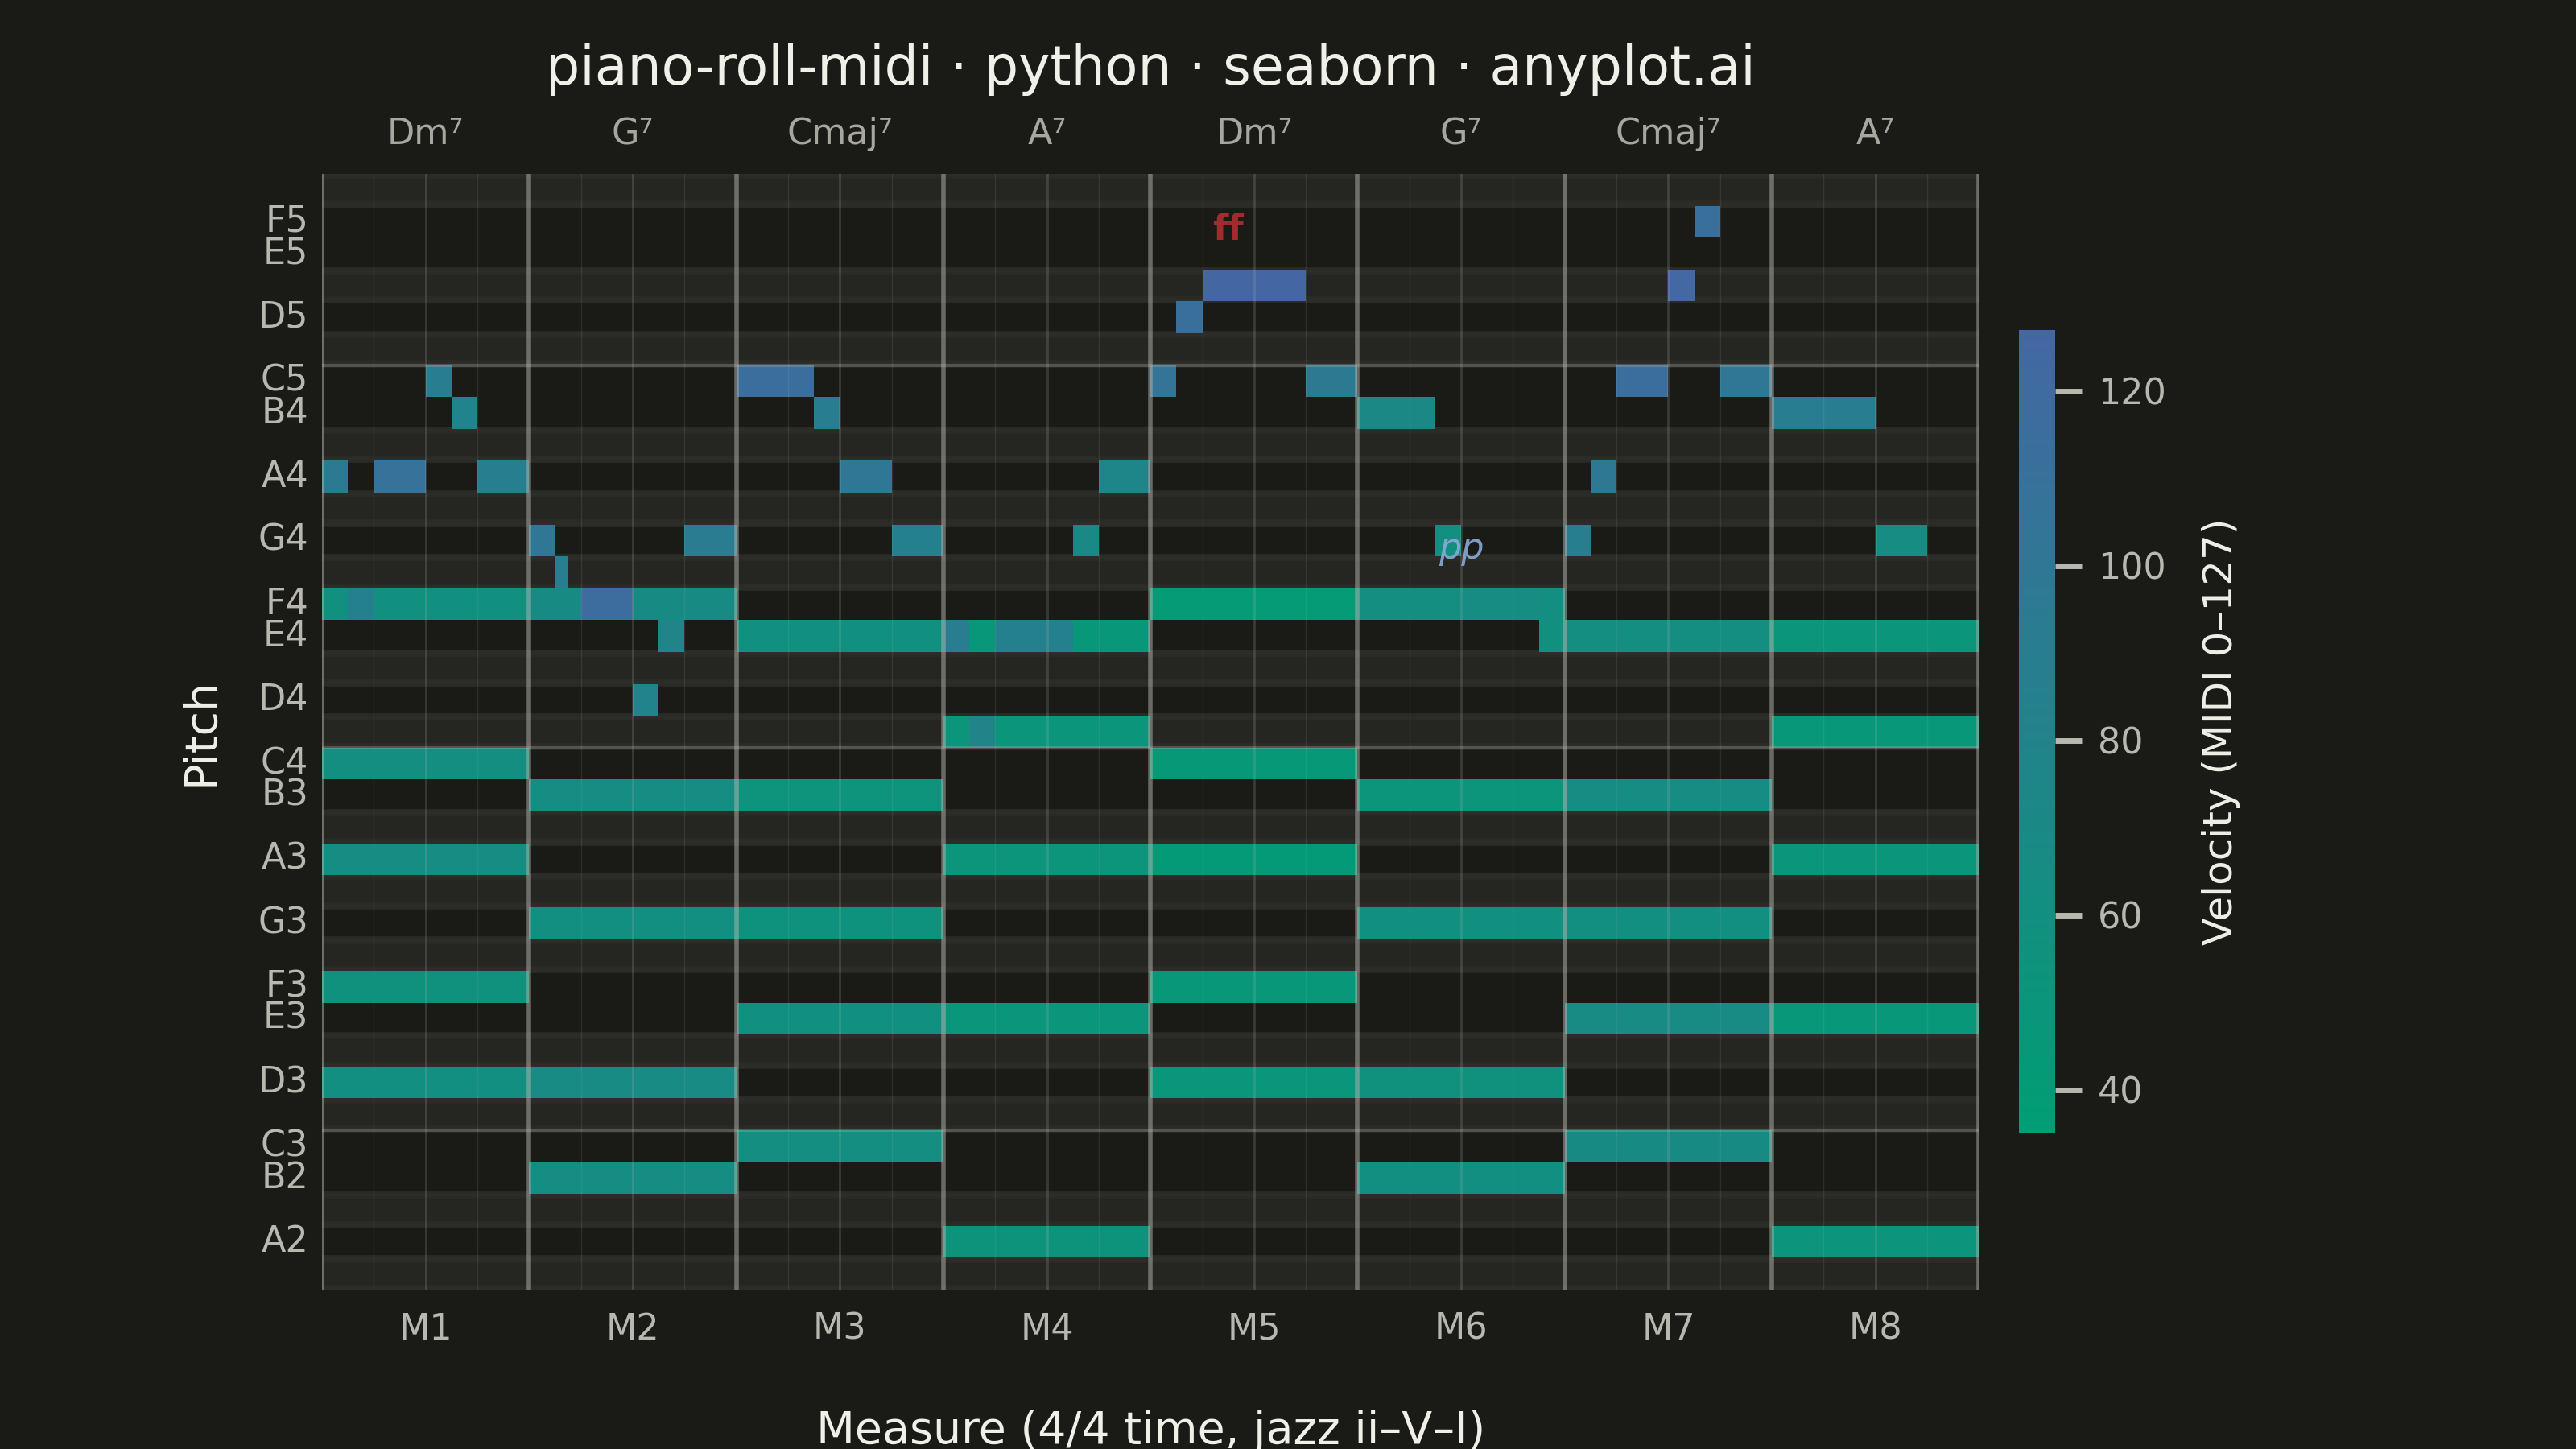
A grid-based visualization of musical notes over time, as seen in digital audio workstations (DAWs). Each note is represented as a horizontal rectangle positioned by pitch (y-axis) and time (x-axis), with bar length indicating note duration and color indicating velocity (dynamics). The background alternates between white and dark rows to mirror piano keyboard layout, with vertical grid lines marking beats and measures.
""" anyplot.ai
piano-roll-midi: MIDI Piano Roll Visualization
Library: seaborn 0.13.2 | Python 3.13.13
Quality: 93/100 | Updated: 2026-06-03
"""

import os

import matplotlib.colors as mcolors
import matplotlib.pyplot as plt
import numpy as np
import pandas as pd
import seaborn as sns


# Theme setup
THEME = os.getenv("ANYPLOT_THEME", "light")
PAGE_BG = "#FAF8F1" if THEME == "light" else "#1A1A17"
ELEVATED_BG = "#FFFDF6" if THEME == "light" else "#242420"
INK = "#1A1A17" if THEME == "light" else "#F0EFE8"
INK_SOFT = "#4A4A44" if THEME == "light" else "#B8B7B0"
INK_MUTED = "#6B6A63" if THEME == "light" else "#A8A79F"
PP_COLOR = "#4467A3" if THEME == "light" else "#8AAAD6"

# Imprint sequential colormap for MIDI velocity (single-polarity continuous data)
imprint_seq = mcolors.LinearSegmentedColormap.from_list("imprint_seq", ["#009E73", "#4467A3"])

sns.set_theme(
    style="ticks",
    rc={
        "figure.facecolor": PAGE_BG,
        "axes.facecolor": PAGE_BG,
        "axes.edgecolor": INK_SOFT,
        "axes.labelcolor": INK,
        "text.color": INK,
        "xtick.color": INK_SOFT,
        "ytick.color": INK_SOFT,
        "grid.color": INK,
        "grid.alpha": 0.15,
        "legend.facecolor": ELEVATED_BG,
        "legend.edgecolor": INK_SOFT,
    },
)

# MIDI helpers
NOTE_NAMES = ["C", "C#", "D", "D#", "E", "F", "F#", "G", "G#", "A", "A#", "B"]
BLACK_KEY_INDICES = {1, 3, 6, 8, 10}
WHITE_KEY_NAMES = {"C", "D", "E", "F", "G", "A", "B"}

# Jazz ii-V-I-turnaround: Dm7 - G7 - Cmaj7 - A7
np.random.seed(42)

notes_data = []

chords = {
    "Dm7": [50, 53, 57, 60, 65],  # D3, F3, A3, C4, F4
    "G7": [47, 50, 55, 59, 65],  # B2, D3, G3, B3, F4 (tritone)
    "Cmaj7": [48, 52, 55, 59, 64],  # C3, E3, G3, B3, E4
    "A7": [45, 52, 57, 61, 64],  # A2, E3, A3, C#4, E4
}
progression = ["Dm7", "G7", "Cmaj7", "A7"]

# Dynamic arc: tension → resolution → relaxation → turnaround
chord_velocity_contour = [58, 62, 55, 50, 45, 55, 62, 48]

for measure in range(8):
    chord_name = progression[measure % 4]
    beat_offset = measure * 4
    base_vel = chord_velocity_contour[measure]

    for pitch in chords[chord_name]:
        velocity = base_vel + np.random.randint(-4, 7)
        velocity = np.clip(velocity, 35, 72)
        notes_data.append({"start": beat_offset, "duration": 4.0, "pitch": pitch, "velocity": int(velocity)})

# Melody with jazz phrasing — swung feel, chromatic approach notes, wider intervals
melody = [
    # M1 (Dm7): rising, jazz phrasing
    (0, 0.5, 69, 95),  # A4
    (0.5, 0.5, 65, 85),  # F4
    (1.0, 1.0, 69, 108),  # A4 accent
    (2.0, 0.5, 72, 90),  # C5
    (2.5, 0.5, 71, 80),  # B4 (chromatic approach)
    (3.0, 1.0, 69, 88),  # A4
    # M2 (G7): tension — tritone leap
    (4, 0.5, 67, 100),  # G4
    (4.5, 0.25, 66, 90),  # F#4 (chromatic)
    (5.0, 1.0, 65, 118),  # F4 (tritone of G7) — peak
    (6.0, 0.5, 62, 80),  # D4
    (6.5, 0.5, 64, 78),  # E4
    (7.0, 1.0, 67, 92),  # G4
    # M3 (Cmaj7): resolution, flowing
    (8, 1.5, 72, 115),  # C5 — landed
    (9.5, 0.5, 71, 90),  # B4 (maj7)
    (10.0, 1.0, 69, 100),  # A4
    (11.0, 1.0, 67, 85),  # G4
    # M4 (A7): darker, blues-tinged
    (12, 0.5, 64, 90),  # E4
    (12.5, 0.5, 61, 78),  # C#4 (3rd of A7)
    (13.0, 1.5, 64, 85),  # E4
    (14.5, 0.5, 67, 70),  # G4 (7th of A7)
    (15.0, 1.0, 69, 75),  # A4
    # M5 (Dm7 repeat): fortissimo climax — blue note peak
    (16, 0.5, 72, 105),  # C5
    (16.5, 0.5, 74, 112),  # D5
    (17.0, 2.0, 75, 127),  # Eb5 — blue note fortissimo
    (19.0, 1.0, 72, 95),  # C5
    # M6 (G7): softer, reflective
    (20, 1.5, 71, 72),  # B4
    (21.5, 0.5, 67, 60),  # G4
    (22.0, 1.5, 65, 65),  # F4
    (23.5, 0.5, 64, 58),  # E4
    # M7 (Cmaj7): crescendo to second climax
    (24, 0.5, 67, 88),  # G4
    (24.5, 0.5, 69, 98),  # A4
    (25.0, 1.0, 72, 115),  # C5
    (26.0, 0.5, 75, 125),  # Eb5 (blue note)
    (26.5, 0.5, 77, 112),  # F5
    (27.0, 1.0, 72, 100),  # C5
    # M8 (A7 turnaround): ritardando diminuendo
    (28, 2.0, 71, 90),  # B4
    (30.0, 1.0, 67, 65),  # G4
    (31.0, 1.0, 57, 45),  # A3 — resolves to low A, very soft
]

for start, dur, pitch, vel in melody:
    notes_data.append({"start": start, "duration": dur, "pitch": pitch, "velocity": vel})

df = pd.DataFrame(notes_data)

# Pitch range with margin
pitch_min = df["pitch"].min() - 1
pitch_max = df["pitch"].max() + 1
pitches = list(range(pitch_min, pitch_max + 1))
n_pitches = len(pitches)

# Time-pitch matrix (sixteenth-note resolution)
resolution = 0.25
total_beats = 32
n_steps = int(total_beats / resolution)
matrix = np.full((n_pitches, n_steps), np.nan)

for _, row in df.iterrows():
    pitch_idx = int(row["pitch"]) - pitch_min
    start_step = int(row["start"] / resolution)
    end_step = int((row["start"] + row["duration"]) / resolution)
    end_step = min(end_step, n_steps)
    for t in range(start_step, end_step):
        existing = matrix[pitch_idx, t]
        if np.isnan(existing) or row["velocity"] > existing:
            matrix[pitch_idx, t] = row["velocity"]

# Flip so highest pitch is at the top
matrix_flipped = matrix[::-1]
pitches_flipped = pitches[::-1]

# Pitch labels: white keys labeled, black keys empty
pitch_labels = []
for p in pitches_flipped:
    name = NOTE_NAMES[p % 12]
    octave = p // 12 - 1
    pitch_labels.append(f"{name}{octave}" if name in WHITE_KEY_NAMES else "")

heatmap_df = pd.DataFrame(matrix_flipped, index=pitch_labels)

# Black key mask for background shading
black_key_mask = np.array([p % 12 in BLACK_KEY_INDICES for p in pitches_flipped])
BLACK_KEY_BG = "#E8E3DB" if THEME == "light" else "#252522"
BLACK_KEY_EDGE = "#D8D2C8" if THEME == "light" else "#2E2E2A"

# Canvas: landscape 3200 × 1800 (figsize=(8, 4.5) × dpi=400)
fig, ax = plt.subplots(figsize=(8, 4.5), dpi=400)
fig.patch.set_facecolor(PAGE_BG)
ax.set_facecolor(PAGE_BG)

# Background shading for black key rows — slightly darker edge gives subtle depth
for i, is_black in enumerate(black_key_mask):
    if is_black:
        ax.axhspan(i, i + 1, color=BLACK_KEY_BG, zorder=0)
        ax.axhspan(i, i + 0.08, color=BLACK_KEY_EDGE, zorder=0, alpha=0.6)
        ax.axhspan(i + 0.92, i + 1, color=BLACK_KEY_EDGE, zorder=0, alpha=0.6)

# Seaborn heatmap with Imprint sequential colormap
sns.heatmap(
    heatmap_df,
    ax=ax,
    cmap=imprint_seq,
    vmin=35,
    vmax=127,
    cbar_kws={"label": "Velocity (MIDI 0–127)", "shrink": 0.72, "aspect": 22, "pad": 0.02},
    xticklabels=False,
    yticklabels=1,
    linewidths=0,
    mask=np.isnan(matrix_flipped),
    square=False,
)

# Hierarchical beat grid lines
for beat in range(total_beats + 1):
    x_pos = beat / resolution
    if beat % 4 == 0:
        ax.axvline(x_pos, color=INK_SOFT, linewidth=1.0, alpha=0.5, zorder=3)
    elif beat % 2 == 0:
        ax.axvline(x_pos, color=INK_SOFT, linewidth=0.5, alpha=0.2, zorder=3)
    else:
        ax.axvline(x_pos, color=INK_SOFT, linewidth=0.25, alpha=0.12, zorder=3)

# Octave boundary lines at C notes
for i, p in enumerate(pitches_flipped):
    if p % 12 == 0:
        ax.axhline(i, color=INK_SOFT, linewidth=0.7, alpha=0.3, zorder=3)

# X-axis measure labels
measure_positions = [int(b / resolution) for b in range(0, total_beats, 4)]
ax.set_xticks([pos + 2 / resolution for pos in measure_positions])
ax.set_xticklabels([f"M{i + 1}" for i in range(len(measure_positions))], fontsize=8, color=INK_SOFT)

# Chord name labels just above the heatmap top (y < 0 in heatmap data coords)
chord_sequence = ["Dm⁷", "G⁷", "Cmaj⁷", "A⁷", "Dm⁷", "G⁷", "Cmaj⁷", "A⁷"]
for measure_idx, chord_label in enumerate(chord_sequence):
    x_center = measure_idx * 4 / resolution + 2 / resolution
    ax.text(x_center, -0.7, chord_label, ha="center", va="bottom", fontsize=8, color=INK_MUTED, clip_on=False)

ax.tick_params(axis="y", labelsize=8, length=0, pad=3, colors=INK_SOFT)
ax.tick_params(axis="x", length=0, pad=5, colors=INK_SOFT)

# Colorbar styling
cbar = ax.collections[0].colorbar
cbar.ax.tick_params(labelsize=8, colors=INK_SOFT)
cbar.set_label("Velocity (MIDI 0–127)", fontsize=9, labelpad=8, color=INK)
cbar.outline.set_visible(False)

# Dynamic annotations — ff at fortissimo peak, pp at soft passage
ff_pitch = 75  # Eb5 peak
pp_pitch = 65  # F4 soft passage
ff_y = next((i for i, p in enumerate(pitches_flipped) if p == ff_pitch), None)
pp_y = next((i for i, p in enumerate(pitches_flipped) if p == pp_pitch), None)
if ff_y is not None:
    ax.annotate(
        "ff",
        xy=(17.5 / resolution, ff_y - 0.7),
        fontsize=8,
        fontweight="bold",
        color="#AE3030",
        ha="center",
        va="bottom",
        alpha=0.9,
    )
if pp_y is not None:
    ax.annotate(
        "pp",
        xy=(22 / resolution, pp_y - 0.7),
        fontsize=8,
        fontstyle="italic",
        color=PP_COLOR,
        ha="center",
        va="bottom",
        alpha=0.9,
    )

ax.set_xlabel("Measure (4/4 time, jazz ii–V–I)", fontsize=10, labelpad=14, color=INK)
ax.set_ylabel("Pitch", fontsize=10, labelpad=8, color=INK)
ax.set_title("piano-roll-midi · python · seaborn · anyplot.ai", fontsize=12, fontweight="medium", pad=20, color=INK)

sns.despine(ax=ax, left=True, bottom=True)
for spine in ax.spines.values():
    spine.set_visible(False)

plt.savefig(f"plot-{THEME}.png", dpi=400, facecolor=PAGE_BG)
plt.close()
Runnable source as JSON, for any HTTP client: https://api.anyplot.ai/specs/piano-roll-midi/seaborn/code. Any spec id and library id listed in llms-full.txt fit the same URL shape; every URL below is complete and callable.
{
  "spec_id": "piano-roll-midi",
  "language": "python",
  "library": "seaborn",
  "page": "https://anyplot.ai/piano-roll-midi/python/seaborn",
  "hub": "https://anyplot.ai/piano-roll-midi",
  "code_json": "https://api.anyplot.ai/specs/piano-roll-midi/seaborn/code",
  "spec_json": "https://api.anyplot.ai/specs/piano-roll-midi",
  "render_light_png": "https://storage.googleapis.com/anyplot-images/plots/piano-roll-midi/python/seaborn/plot-light.png",
  "render_dark_png": "https://storage.googleapis.com/anyplot-images/plots/piano-roll-midi/python/seaborn/plot-dark.png",
  "quality_score": 93.0,
  "license": "MIT",
  "guide": "https://anyplot.ai/llms.txt"
}
Part of MIDI Piano Roll Visualization on anyplot.ai.