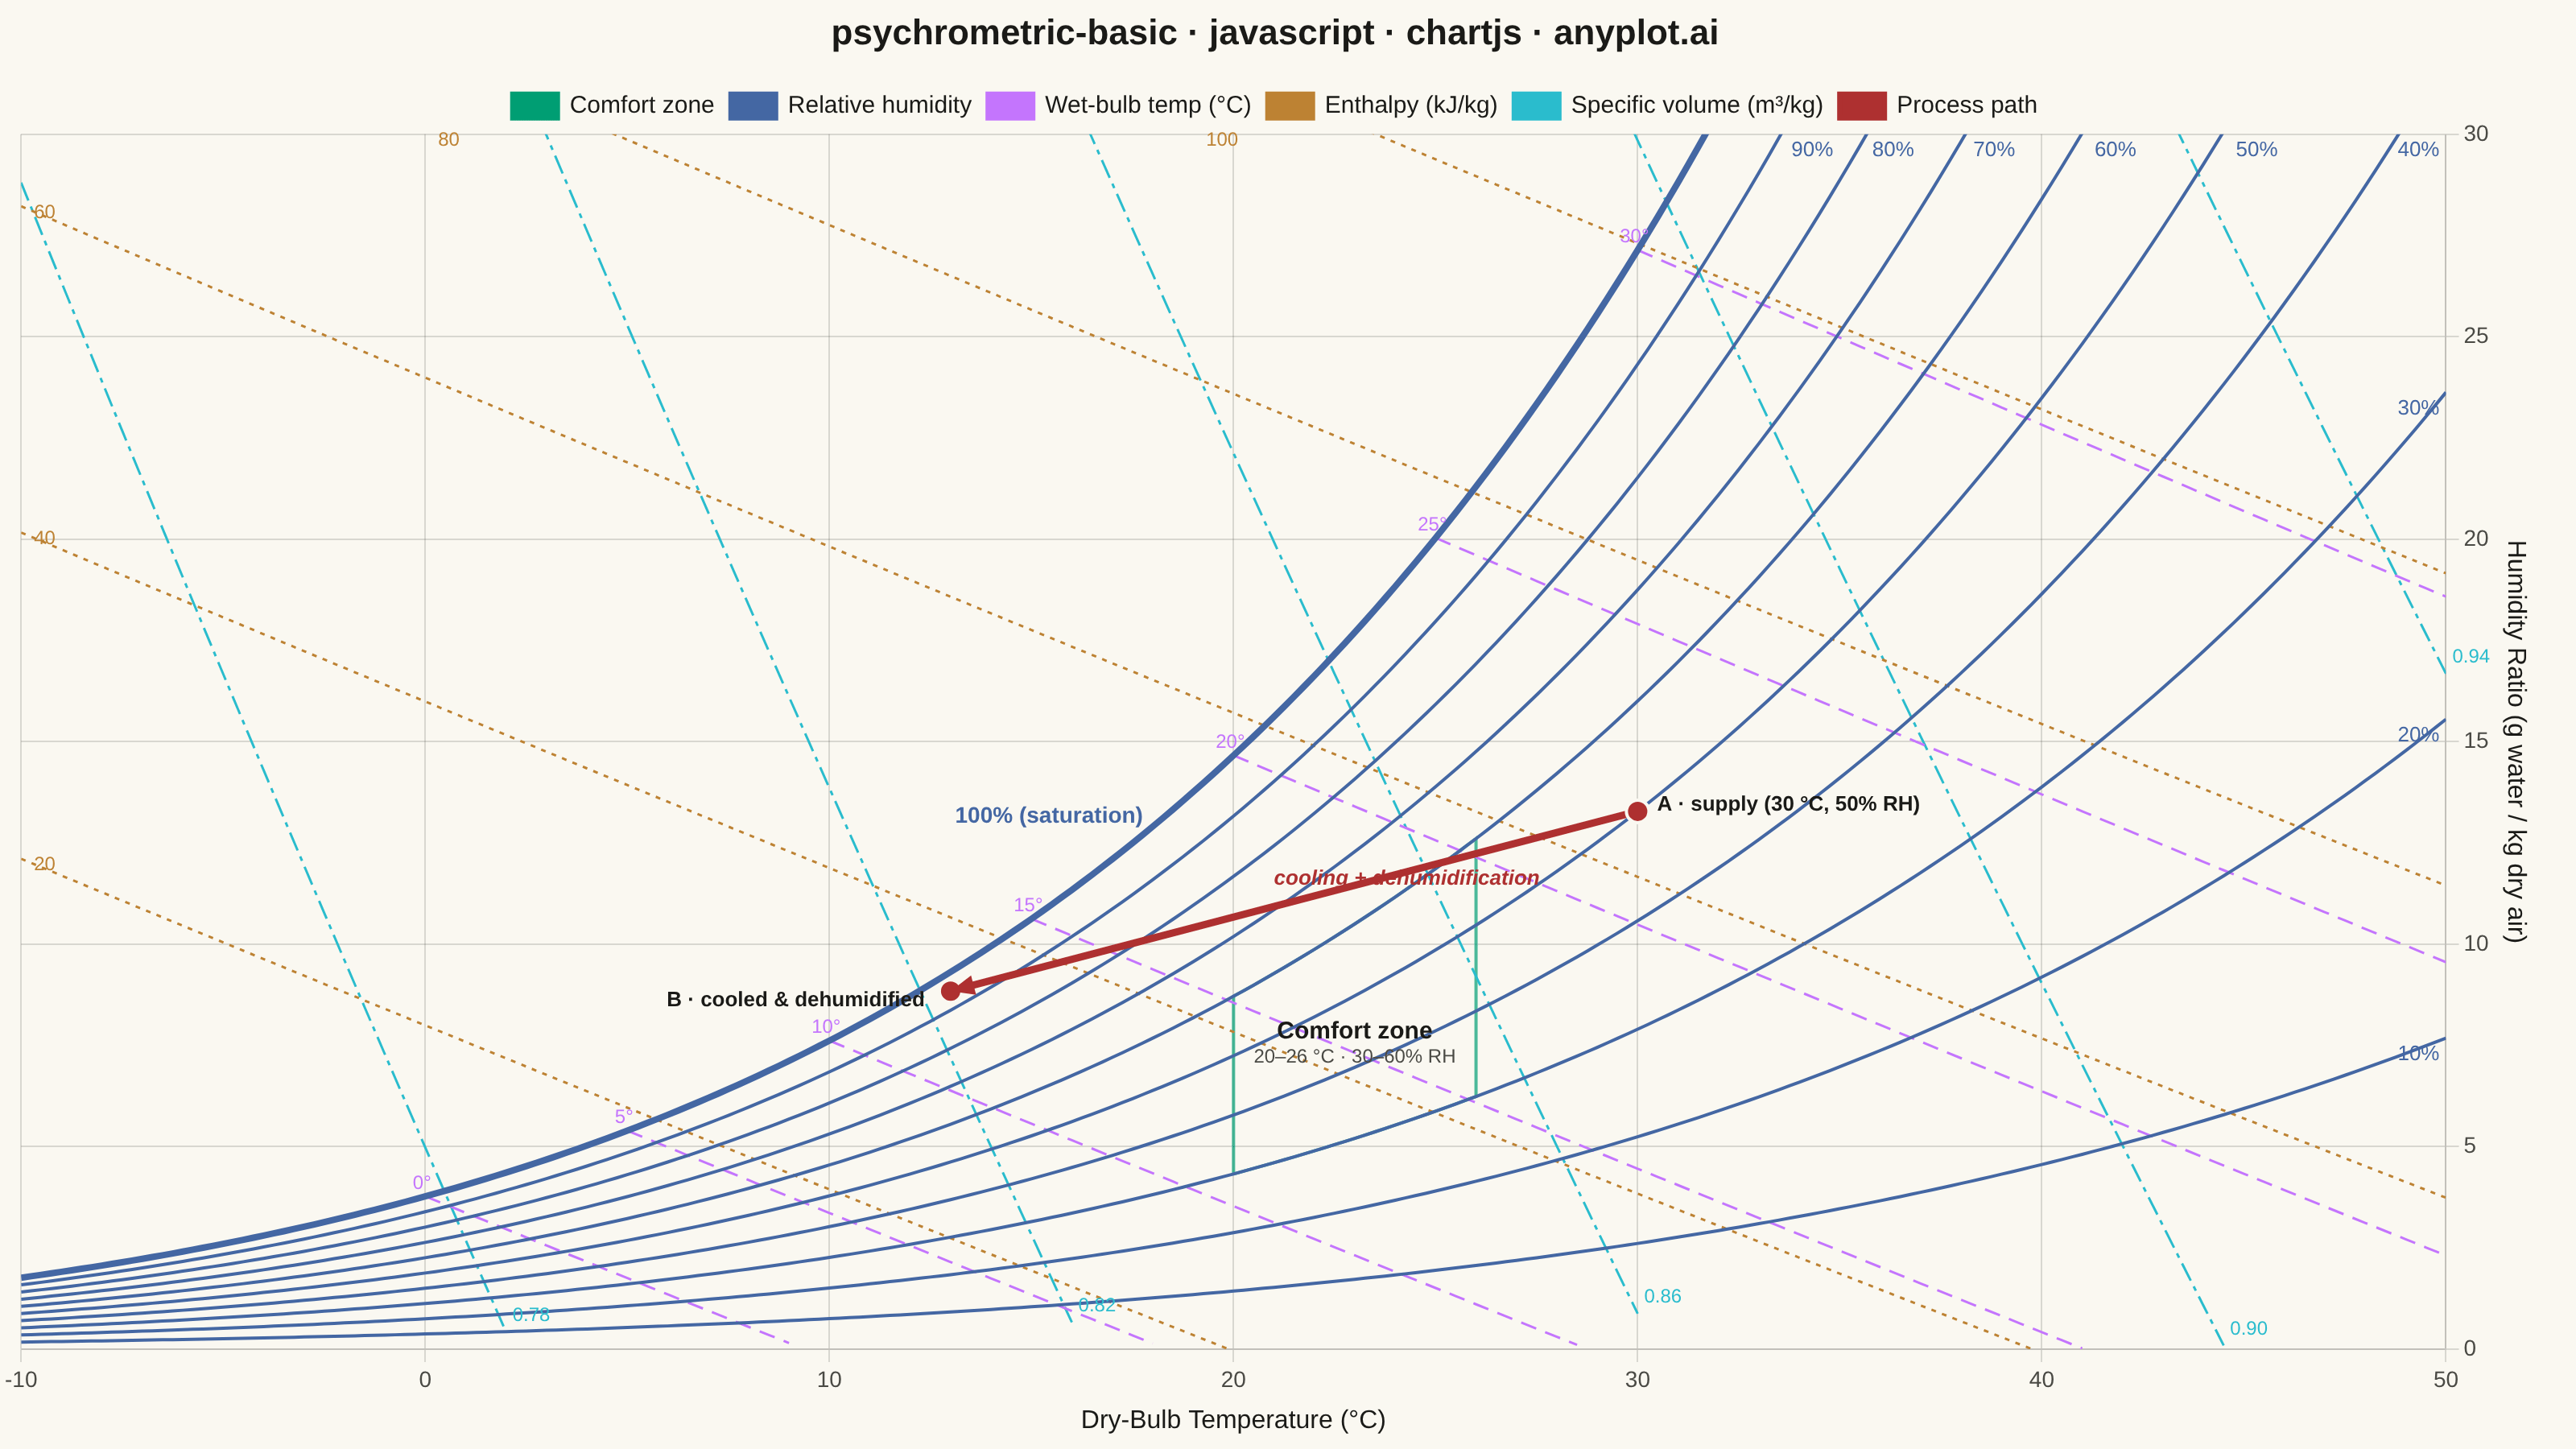
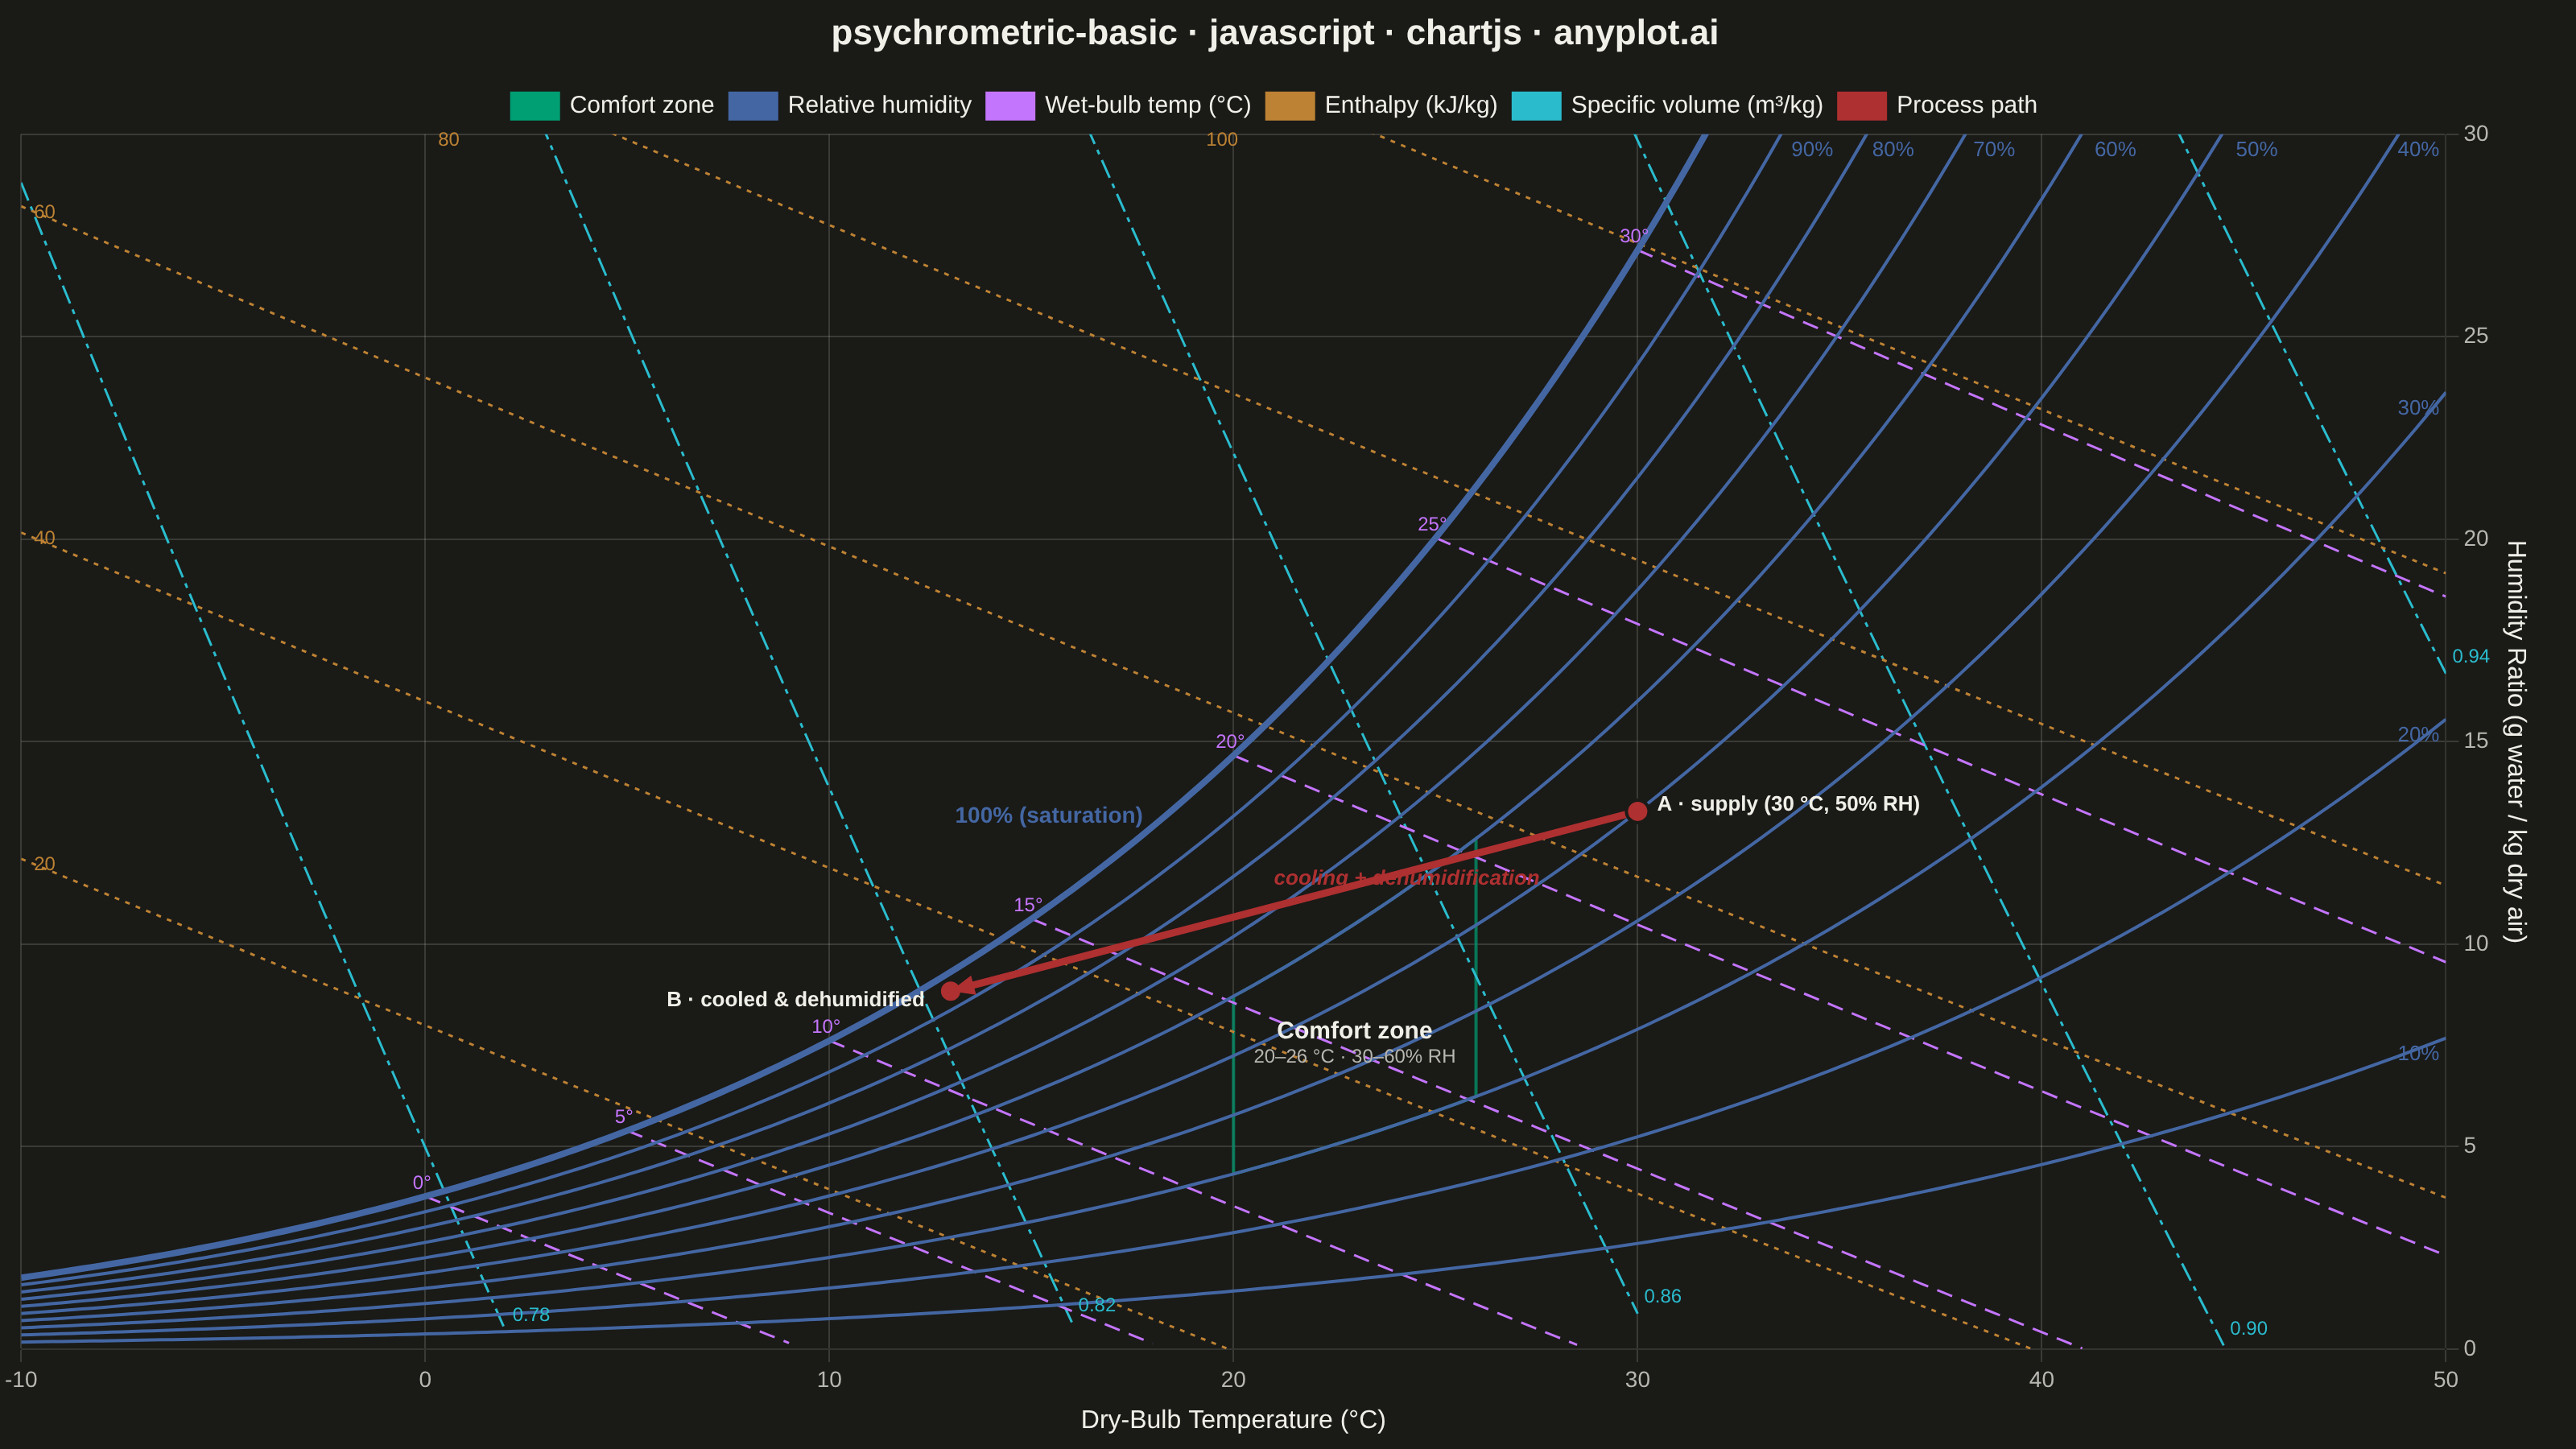
A psychrometric chart plots dry-bulb temperature against humidity ratio, overlaid with curves for relative humidity, wet-bulb temperature, enthalpy, and specific volume. It is the fundamental tool for HVAC system design and air conditioning process analysis. The chart reveals the thermodynamic properties of moist air at a glance, enabling engineers to trace heating, cooling, humidification, and dehumidification processes as paths on the diagram.
// anyplot.ai
// psychrometric-basic: Psychrometric Chart for HVAC
// Library: chartjs 4.4.7 | JavaScript 22.22.3
// Quality: 90/100 | Created: 2026-06-16
//# anyplot-orientation: landscape

const t = window.ANYPLOT_TOKENS;
const THEME = window.ANYPLOT_THEME;

// Imprint palette roles (data colors identical across themes; only chrome flips)
const C_COMFORT = t.palette[0]; // #009E73 brand green — comfort / good (first series)
const C_RH = t.palette[2]; //      #4467A3 blue   — water / humidity
const C_WETBULB = t.palette[1]; // #C475FD lavender — wet-bulb temperature
const C_ENTHALPY = t.palette[3]; // #BD8233 ochre  — energy / enthalpy
const C_VOLUME = t.palette[5]; //  #2ABCCD cyan   — specific volume
const C_PROCESS = t.palette[4]; // #AE3030 red    — highlighted process path

// --- Psychrometrics at sea-level standard pressure (ASHRAE) -----------------
const P = 101.325; // total atmospheric pressure, kPa
const X_MIN = -10,
  X_MAX = 50; // dry-bulb range, °C
const Y_MAX = 30; // humidity ratio cap, g water / kg dry air

// Saturation vapor pressure over water (kPa) — Magnus form
const pws = (tdb) => 0.61094 * Math.exp((17.625 * tdb) / (tdb + 243.04));

// Humidity ratio (g/kg) from dry-bulb (°C) and relative humidity (fraction)
const humRatio = (tdb, rh) => {
  const pw = rh * pws(tdb);
  return (0.62198 * pw) / (P - pw) * 1000;
};

// --- Build the property-line families ---------------------------------------
const labels = []; // {text, x, y, color, dx, dy, align, size, weight}
const datasets = [];

const lineDataset = (data, color, width, dash) => ({
  data,
  borderColor: color,
  borderWidth: width,
  borderDash: dash || [],
  pointRadius: 0,
  fill: false,
  tension: 0,
  order: 5,
});

// Relative-humidity curves: 10% … 100% (saturation). 100% is the prominent boundary.
const rhCurve = (rh) => {
  const pts = [];
  for (let tdb = X_MIN; tdb <= X_MAX + 0.001; tdb += 0.5) {
    const w = humRatio(tdb, rh);
    pts.push({ x: tdb, y: w });
    if (w > Y_MAX + 2) break; // let the line reach the top edge, then stop
  }
  return pts;
};

for (let rhPct = 10; rhPct <= 90; rhPct += 10) {
  const pts = rhCurve(rhPct / 100);
  const ds = lineDataset(pts, C_RH, 2, []);
  ds.tension = 0.3;
  datasets.push(ds);
  const anchor = pts[pts.length - 1];
  labels.push({
    text: `${rhPct}%`,
    x: anchor.x,
    y: Math.min(anchor.y, Y_MAX),
    color: C_RH,
    dx: -4,
    dy: 10,
    align: "right",
    size: 13,
  });
}

// Saturation curve (100% RH) — visually prominent upper boundary
const satPts = rhCurve(1.0);
const satDs = lineDataset(satPts, C_RH, 4, []);
satDs.tension = 0.3;
satDs.order = 3;
datasets.push(satDs);
labels.push({
  text: "100% (saturation)",
  x: 18,
  y: humRatio(18, 1.0),
  color: C_RH,
  dx: -6,
  dy: -6,
  align: "right",
  size: 14,
  weight: "600",
});

// Wet-bulb temperature lines (diagonal, anchored on the saturation curve)
for (const twb of [0, 5, 10, 15, 20, 25, 30]) {
  const wsWb = humRatio(twb, 1.0) / 1000; // kg/kg at saturation
  const pts = [];
  for (let tdb = twb; tdb <= X_MAX + 0.001; tdb += 0.5) {
    const w =
      ((2501 - 2.326 * twb) * wsWb - 1.006 * (tdb - twb)) /
      (2501 + 1.86 * tdb - 4.186 * twb);
    const wg = w * 1000;
    if (wg < 0) break;
    if (wg <= Y_MAX + 2) pts.push({ x: tdb, y: wg });
  }
  if (pts.length < 2) continue;
  datasets.push(lineDataset(pts, C_WETBULB, 1.5, [10, 6]));
  labels.push({
    text: `${twb}°`,
    x: pts[0].x,
    y: Math.min(pts[0].y, Y_MAX),
    color: C_WETBULB,
    dx: -2,
    dy: -8,
    align: "center",
    size: 12,
  });
}

// Constant-enthalpy lines (oblique, kJ/kg of dry air)
for (const h of [20, 40, 60, 80, 100]) {
  const pts = [];
  for (let tdb = X_MIN; tdb <= X_MAX + 0.001; tdb += 0.5) {
    const w = (h - 1.006 * tdb) / (2501 + 1.86 * tdb); // kg/kg
    const wg = w * 1000;
    if (wg >= -0.5 && wg <= Y_MAX + 2) pts.push({ x: tdb, y: wg });
  }
  if (pts.length < 2) continue;
  datasets.push(lineDataset(pts, C_ENTHALPY, 1.5, [3, 4]));
  const top = pts[0]; // upper-left end
  labels.push({
    text: `${h}`,
    x: top.x,
    y: Math.min(top.y, Y_MAX),
    color: C_ENTHALPY,
    dx: 8,
    dy: 4,
    align: "left",
    size: 12,
  });
}

// Constant-specific-volume lines (steep diagonal, m³/kg of dry air)
for (const v of [0.78, 0.82, 0.86, 0.9, 0.94]) {
  const pts = [];
  for (let tdb = X_MIN; tdb <= X_MAX + 0.001; tdb += 0.5) {
    const w = ((v * P) / (0.287042 * (tdb + 273.15)) - 1) / 1.6078; // kg/kg
    const wg = w * 1000;
    if (wg >= 0 && wg <= Y_MAX + 2) pts.push({ x: tdb, y: wg });
  }
  if (pts.length < 2) continue;
  datasets.push(lineDataset(pts, C_VOLUME, 1.5, [12, 4, 3, 4]));
  const bottom = pts[pts.length - 1]; // near the x-axis
  labels.push({
    text: `${v.toFixed(2)}`,
    x: bottom.x,
    y: bottom.y,
    color: C_VOLUME,
    dx: 4,
    dy: -10,
    align: "left",
    size: 12,
  });
}

// --- Comfort zone (≈20–26 °C, 30–60% RH), traced along the RH curves --------
const comfortPts = [];
for (let tdb = 20; tdb <= 26 + 0.001; tdb += 0.5) comfortPts.push({ x: tdb, y: humRatio(tdb, 0.3) });
for (let tdb = 26; tdb >= 20 - 0.001; tdb -= 0.5) comfortPts.push({ x: tdb, y: humRatio(tdb, 0.6) });
comfortPts.push({ x: 20, y: humRatio(20, 0.3) });
datasets.unshift({
  data: comfortPts,
  borderColor: "rgba(0,158,115,0.7)",
  backgroundColor: "rgba(0,158,115,0.2)",
  borderWidth: 2,
  pointRadius: 0,
  fill: true,
  tension: 0,
  order: 6,
});

// --- Example HVAC process: cooling + dehumidification -----------------------
const stateA = { x: 30, y: humRatio(30, 0.5) }; // warm humid supply air
const stateB = { x: 13, y: humRatio(13, 0.95) }; // cooled, near-saturated air
datasets.push({
  data: [stateA, stateB],
  borderColor: C_PROCESS,
  backgroundColor: C_PROCESS,
  borderWidth: 4.5,
  pointRadius: [7, 7],
  pointBackgroundColor: C_PROCESS,
  pointBorderColor: t.pageBg,
  pointBorderWidth: 2,
  fill: false,
  tension: 0,
  order: 1,
});

// --- Direct-label + process-arrow plugin (canvas drawing, no extra deps) -----
const annotations = {
  id: "annotations",
  afterDatasetsDraw(chart) {
    const { ctx, scales, chartArea } = chart;
    const px = (x) => scales.x.getPixelForValue(x);
    const py = (y) => scales.y.getPixelForValue(y);

    ctx.save();
    ctx.textBaseline = "middle";

    // property-line labels
    for (const l of labels) {
      const X = px(l.x) + (l.dx || 0);
      const Y = py(l.y) + (l.dy || 0);
      if (X < chartArea.left - 60 || X > chartArea.right + 60) continue;
      ctx.fillStyle = l.color;
      ctx.font = `${l.weight || "500"} ${l.size || 12}px sans-serif`;
      ctx.textAlign = l.align || "left";
      ctx.fillText(l.text, X, Y);
    }

    // comfort-zone label
    ctx.fillStyle = t.ink;
    ctx.textAlign = "center";
    ctx.font = "600 15px sans-serif";
    ctx.fillText("Comfort zone", px(23), py(humRatio(23, 0.45)));
    ctx.font = "400 12px sans-serif";
    ctx.fillStyle = t.inkSoft;
    ctx.fillText("20–26 °C · 30–60% RH", px(23), py(humRatio(23, 0.45)) + 16);

    // process arrowhead at state B
    const ax = px(stateA.x),
      ay = py(stateA.y);
    const bx = px(stateB.x),
      by = py(stateB.y);
    const ang = Math.atan2(by - ay, bx - ax);
    const head = 16;
    ctx.fillStyle = C_PROCESS;
    ctx.beginPath();
    ctx.moveTo(bx, by);
    ctx.lineTo(bx - head * Math.cos(ang - 0.4), by - head * Math.sin(ang - 0.4));
    ctx.lineTo(bx - head * Math.cos(ang + 0.4), by - head * Math.sin(ang + 0.4));
    ctx.closePath();
    ctx.fill();

    // process endpoint labels
    ctx.fillStyle = t.ink;
    ctx.font = "600 13px sans-serif";
    ctx.textAlign = "left";
    ctx.fillText("A · supply (30 °C, 50% RH)", ax + 12, ay - 4);
    ctx.textAlign = "right";
    ctx.fillText("B · cooled & dehumidified", bx - 16, by + 6);
    ctx.fillStyle = C_PROCESS;
    ctx.font = "italic 600 13px sans-serif";
    ctx.textAlign = "center";
    ctx.fillText(
      "cooling + dehumidification",
      (ax + bx) / 2 + 70,
      (ay + by) / 2 - 14,
    );

    ctx.restore();
  },
};

// --- Mount ------------------------------------------------------------------
const canvas = document.createElement("canvas");
document.getElementById("container").appendChild(canvas);

// --- Chart ------------------------------------------------------------------
const legendFamilies = [
  { text: "Comfort zone", color: C_COMFORT },
  { text: "Relative humidity", color: C_RH },
  { text: "Wet-bulb temp (°C)", color: C_WETBULB },
  { text: "Enthalpy (kJ/kg)", color: C_ENTHALPY },
  { text: "Specific volume (m³/kg)", color: C_VOLUME },
  { text: "Process path", color: C_PROCESS },
];

new Chart(canvas, {
  type: "scatter",
  data: { datasets },
  options: {
    responsive: true,
    maintainAspectRatio: false,
    animation: false,
    layout: { padding: { top: 8, right: 24, bottom: 4, left: 8 } },
    showLine: true,
    plugins: {
      title: {
        display: true,
        text: "psychrometric-basic · javascript · chartjs · anyplot.ai",
        color: t.ink,
        font: { size: 22, weight: "600" },
        padding: { bottom: 14 },
      },
      tooltip: { enabled: true },
      legend: {
        position: "top",
        onClick: () => {},
        labels: {
          color: t.ink,
          font: { size: 15 },
          boxWidth: 28,
          usePointStyle: false,
          generateLabels: () =>
            legendFamilies.map((f) => ({
              text: f.text,
              fillStyle: f.color,
              strokeStyle: f.color,
              lineWidth: 3,
              fontColor: t.ink,
              hidden: false,
            })),
        },
      },
    },
    scales: {
      x: {
        type: "linear",
        min: X_MIN,
        max: X_MAX,
        ticks: { color: t.inkSoft, font: { size: 14 }, stepSize: 10 },
        grid: { color: t.grid },
        title: {
          display: true,
          text: "Dry-Bulb Temperature (°C)",
          color: t.ink,
          font: { size: 16 },
        },
      },
      y: {
        type: "linear",
        position: "right",
        min: 0,
        max: Y_MAX,
        ticks: { color: t.inkSoft, font: { size: 14 }, stepSize: 5 },
        grid: { color: t.grid },
        title: {
          display: true,
          text: "Humidity Ratio (g water / kg dry air)",
          color: t.ink,
          font: { size: 16 },
        },
      },
    },
  },
  plugins: [annotations],
});
Runnable source as JSON, for any HTTP client: https://api.anyplot.ai/specs/psychrometric-basic/chartjs/code. Any spec id and library id listed in llms-full.txt fit the same URL shape; every URL below is complete and callable.
{
  "spec_id": "psychrometric-basic",
  "language": "javascript",
  "library": "chartjs",
  "page": "https://anyplot.ai/psychrometric-basic/javascript/chartjs",
  "hub": "https://anyplot.ai/psychrometric-basic",
  "code_json": "https://api.anyplot.ai/specs/psychrometric-basic/chartjs/code",
  "spec_json": "https://api.anyplot.ai/specs/psychrometric-basic",
  "render_light_png": "https://storage.googleapis.com/anyplot-images/plots/psychrometric-basic/javascript/chartjs/plot-light.png",
  "render_dark_png": "https://storage.googleapis.com/anyplot-images/plots/psychrometric-basic/javascript/chartjs/plot-dark.png",
  "interactive_light_html": "https://storage.googleapis.com/anyplot-images/plots/psychrometric-basic/javascript/chartjs/plot-light.html",
  "interactive_dark_html": "https://storage.googleapis.com/anyplot-images/plots/psychrometric-basic/javascript/chartjs/plot-dark.html",
  "quality_score": 90.0,
  "license": "MIT",
  "guide": "https://anyplot.ai/llms.txt"
}
Part of Psychrometric Chart for HVAC on anyplot.ai.