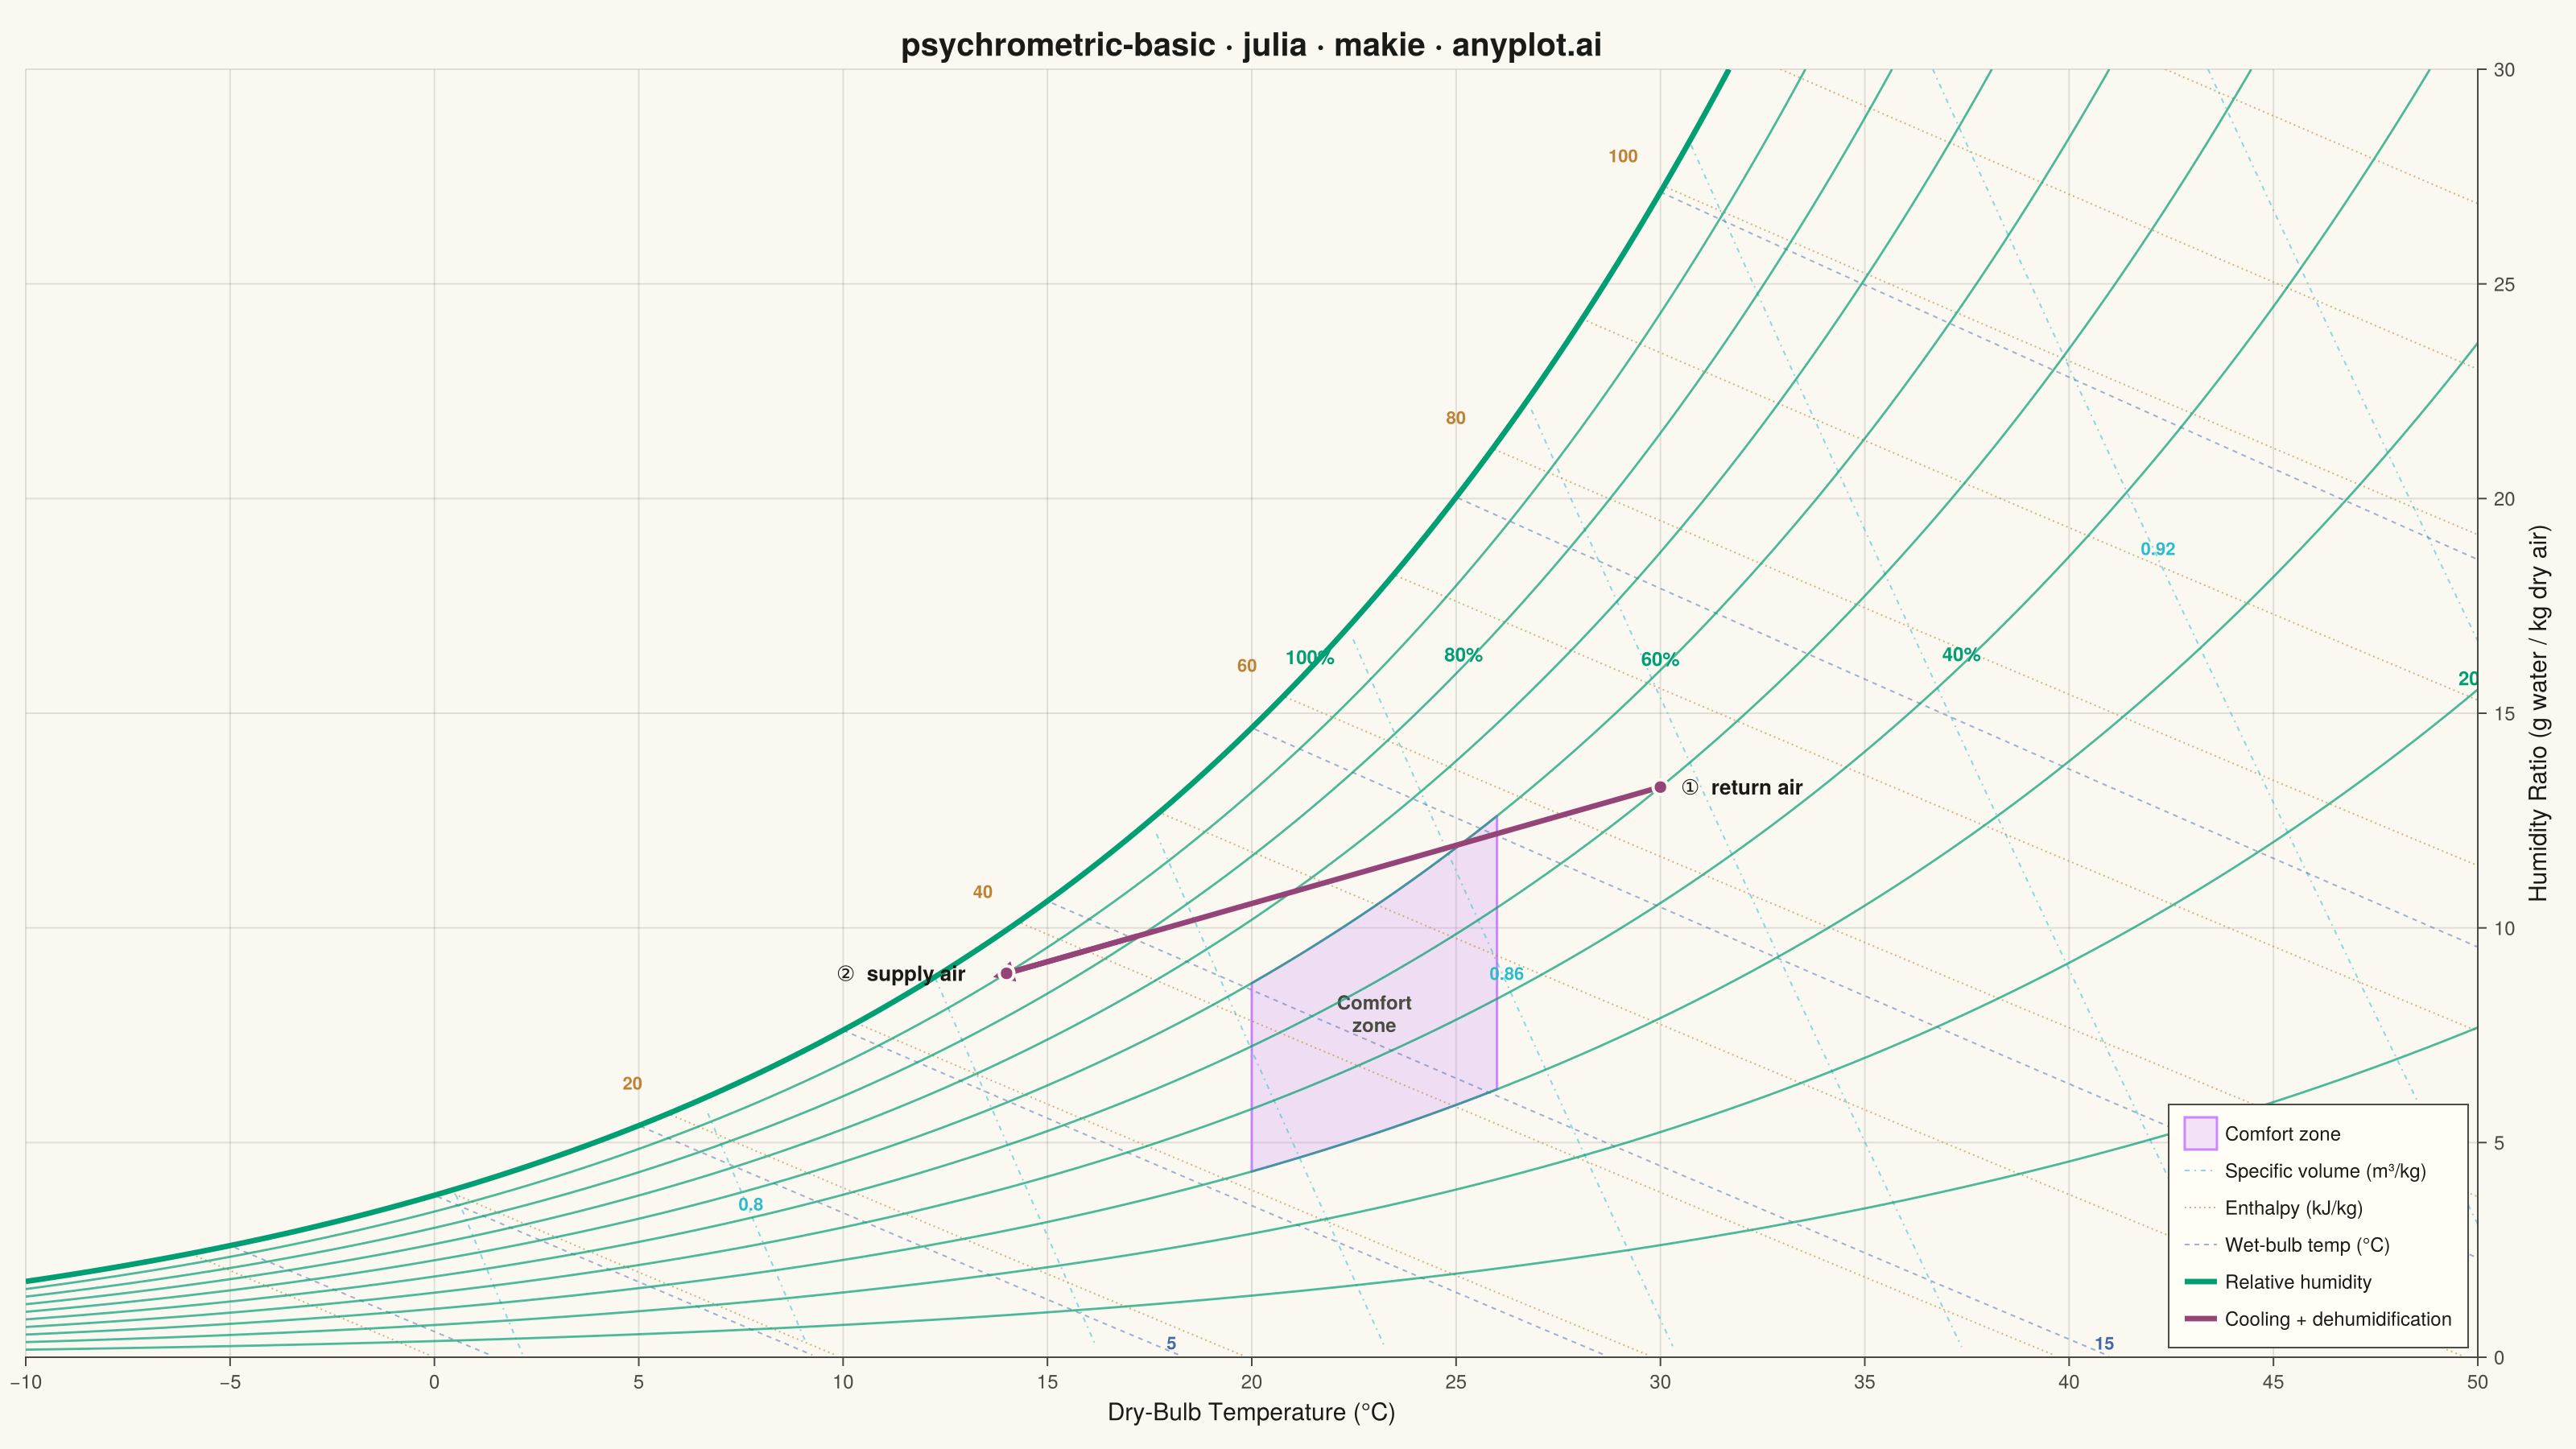
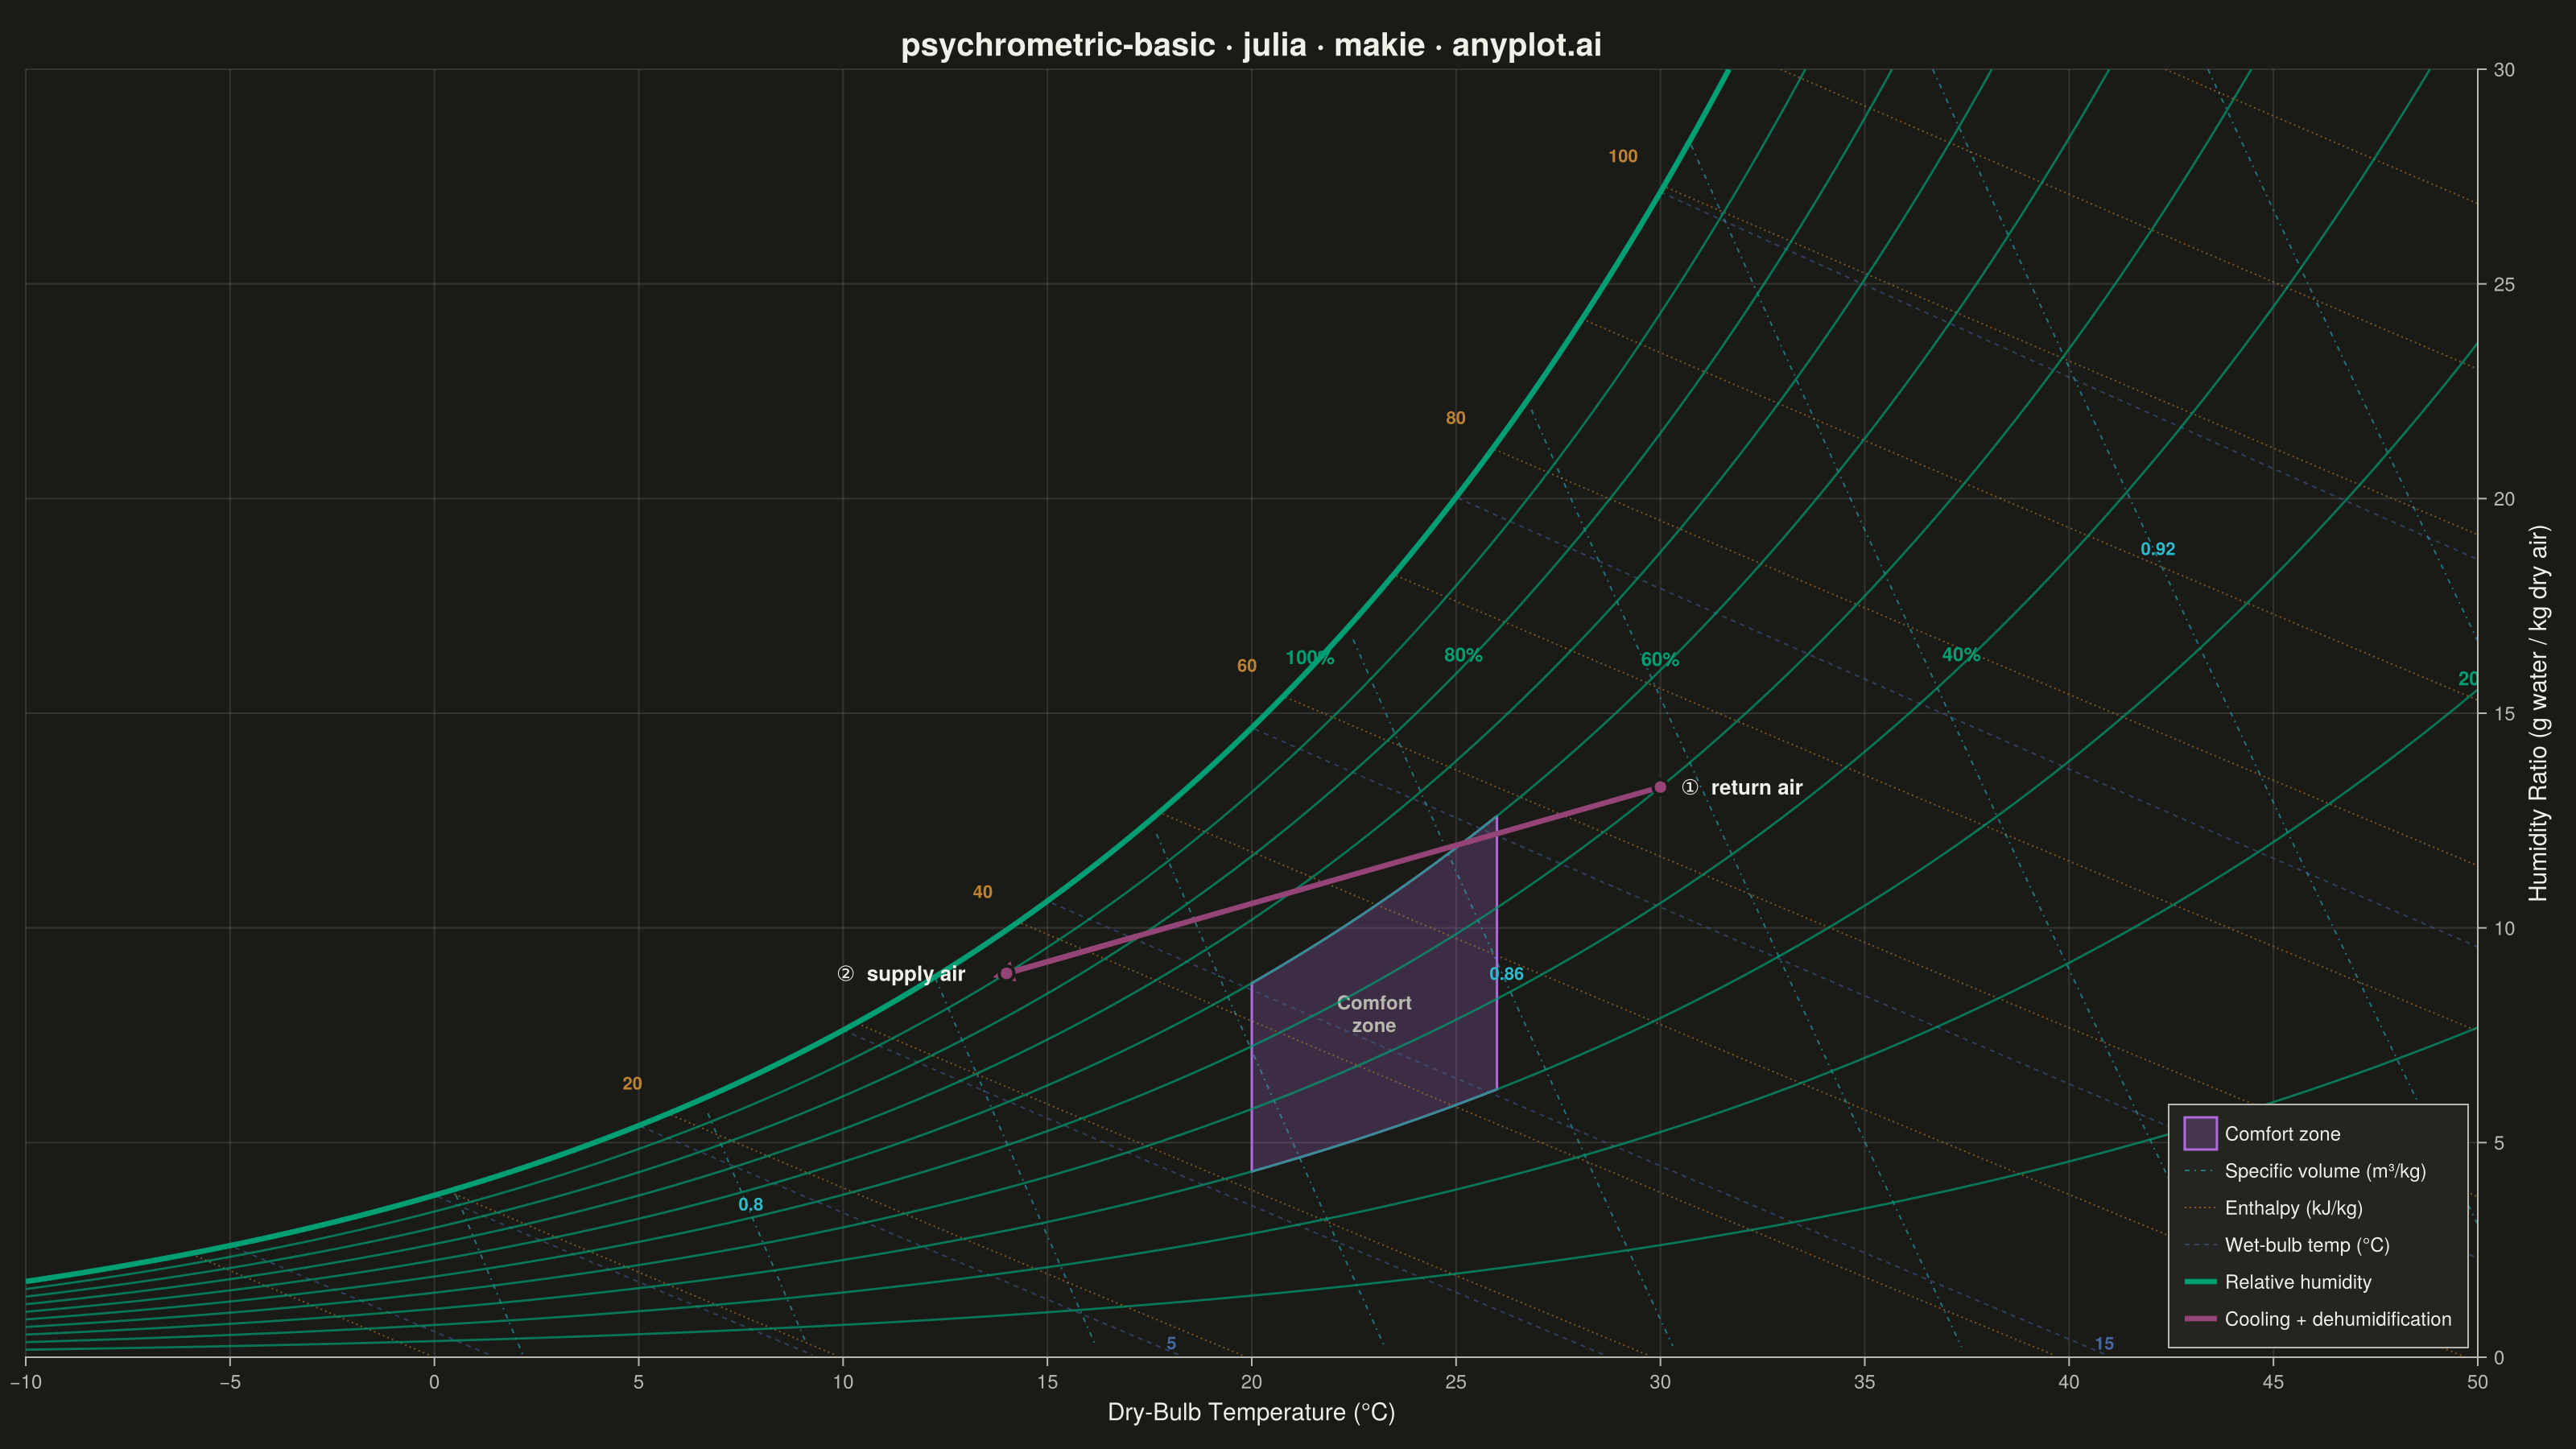
A psychrometric chart plots dry-bulb temperature against humidity ratio, overlaid with curves for relative humidity, wet-bulb temperature, enthalpy, and specific volume. It is the fundamental tool for HVAC system design and air conditioning process analysis. The chart reveals the thermodynamic properties of moist air at a glance, enabling engineers to trace heating, cooling, humidification, and dehumidification processes as paths on the diagram.
# anyplot.ai
# psychrometric-basic: Psychrometric Chart for HVAC
# Library: makie 0.22.10 | Julia 1.11.9
# Quality: 88/100 | Created: 2026-06-16

using CairoMakie
using Colors

# --- Theme tokens (see prompts/default-style-guide.md) -----------------------
const THEME       = get(ENV, "ANYPLOT_THEME", "light")
const PAGE_BG     = THEME == "light" ? colorant"#FAF8F1" : colorant"#1A1A17"
const ELEVATED_BG = THEME == "light" ? colorant"#FFFDF6" : colorant"#242420"
const INK         = THEME == "light" ? colorant"#1A1A17" : colorant"#F0EFE8"
const INK_SOFT    = THEME == "light" ? colorant"#4A4A44" : colorant"#B8B7B0"
const GRID        = RGBAf(INK.r, INK.g, INK.b, 0.12)

# Imprint palette — one hue per psychrometric property family
const RH_GREEN  = colorant"#009E73"  # 1 — relative humidity / saturation curve
const COMF_LAV  = colorant"#C475FD"  # 2 — comfort zone fill
const WB_BLUE   = colorant"#4467A3"  # 3 — wet-bulb temperature
const ENT_OCHRE = colorant"#BD8233"  # 4 — enthalpy (energy)
const VOL_CYAN  = colorant"#2ABCCD"  # 6 — specific volume
const PROC_ROSE = colorant"#954477"  # 7 — HVAC process path

# --- Psychrometric model at sea-level pressure (101.325 kPa) ------------------
# Standard atmosphere moist-air properties from the ASHRAE relations.
const P = 101325.0                              # Pa
dry_bulb = collect(range(-10.0, 50.0, length = 400))   # °C, x-axis primary

# Magnus saturation vapour pressure over water (Pa)
p_ws  = 610.94 .* exp.(17.625 .* dry_bulb ./ (dry_bulb .+ 243.04))
# Saturation humidity ratio (g water / kg dry air)
W_sat = 1000 .* 0.621945 .* p_ws ./ (P .- p_ws)

# --- Figure ------------------------------------------------------------------
fig = Figure(
    resolution      = (1600, 900),
    fontsize        = 14,
    backgroundcolor = PAGE_BG,
)

ax = Axis(
    fig[1, 1];
    title             = "psychrometric-basic · julia · makie · anyplot.ai",
    titlesize         = 20,
    titlecolor        = INK,
    xlabel            = "Dry-Bulb Temperature (°C)",
    ylabel            = "Humidity Ratio (g water / kg dry air)",
    xlabelsize        = 15,
    ylabelsize        = 15,
    xlabelcolor       = INK,
    ylabelcolor       = INK,
    xticklabelsize    = 12,
    yticklabelsize    = 12,
    xticklabelcolor   = INK_SOFT,
    yticklabelcolor   = INK_SOFT,
    xtickcolor        = INK_SOFT,
    ytickcolor        = INK_SOFT,
    xticks            = -10:5:50,
    yticks            = 0:5:30,
    yaxisposition     = :right,          # humidity ratio reads on the right, as on a real chart
    backgroundcolor   = PAGE_BG,
    leftspinevisible  = false,
    topspinevisible   = false,
    rightspinecolor   = INK_SOFT,
    bottomspinecolor  = INK_SOFT,
    xgridcolor        = GRID,
    ygridcolor        = GRID,
    xminorgridvisible = false,
    yminorgridvisible = false,
    limits            = (-10, 50, 0, 30),
)

# --- Comfort zone (≈ 20–26 °C, 30–60 % RH) -----------------------------------
comfort_T   = range(20.0, 26.0, length = 40)
comf_bottom = [Point2f(t, 1000 * 0.621945 * (0.30 * pw) / (P - 0.30 * pw))
               for (t, pw) in zip(comfort_T,
                   610.94 .* exp.(17.625 .* comfort_T ./ (comfort_T .+ 243.04)))]
comf_top    = [Point2f(t, 1000 * 0.621945 * (0.60 * pw) / (P - 0.60 * pw))
               for (t, pw) in zip(reverse(comfort_T),
                   610.94 .* exp.(17.625 .* reverse(comfort_T) ./ (reverse(comfort_T) .+ 243.04)))]
poly!(ax, vcat(comf_bottom, comf_top); color = (COMF_LAV, 0.20),
      strokecolor = (COMF_LAV, 0.85), strokewidth = 1.5, label = "Comfort zone")
text!(ax, 23.0, 8.0; text = "Comfort\nzone", color = INK_SOFT, fontsize = 12,
      align = (:center, :center), font = :bold)

# --- Lines of constant specific volume (m³/kg) -------------------------------
# Thinned family + lower alpha so the RH/saturation hierarchy reads cleanly upper-right.
for (k, v) in enumerate(0.80:0.03:0.95)
    Wv = 1000 .* ((v .* 101.325 ./ (0.287042 .* (dry_bulb .+ 273.15))) .- 1) ./ 1.607858
    Wc = [(0.0 <= w <= ws) ? w : NaN for (w, ws) in zip(Wv, W_sat)]
    lines!(ax, dry_bulb, Wc; color = (VOL_CYAN, 0.45), linewidth = 1.0,
           linestyle = :dashdot, label = k == 1 ? "Specific volume (m³/kg)" : nothing)
end

# --- Lines of constant enthalpy (kJ/kg) --------------------------------------
for (k, h) in enumerate(0.0:10.0:120.0)
    Wh = 1000 .* (h .- 1.006 .* dry_bulb) ./ (2501 .+ 1.86 .* dry_bulb)
    Wc = [(0.0 <= w <= ws) ? w : NaN for (w, ws) in zip(Wh, W_sat)]
    lines!(ax, dry_bulb, Wc; color = (ENT_OCHRE, 0.6), linewidth = 1.0,
           linestyle = :dot, label = k == 1 ? "Enthalpy (kJ/kg)" : nothing)
end

# --- Lines of constant wet-bulb temperature (°C) -----------------------------
for (k, twb) in enumerate(-5.0:5.0:30.0)
    pws_wb = 610.94 * exp(17.625 * twb / (twb + 243.04))
    Ws_wb  = 0.621945 * pws_wb / (P - pws_wb)
    Ww = 1000 .* ((2501 .- 2.326 * twb) .* Ws_wb .- 1.006 .* (dry_bulb .- twb)) ./
         (2501 .+ 1.86 .* dry_bulb .- 4.186 * twb)
    Wc = [(0.0 <= w <= ws) ? w : NaN for (w, ws) in zip(Ww, W_sat)]
    lines!(ax, dry_bulb, Wc; color = (WB_BLUE, 0.5), linewidth = 1.0,
           linestyle = :dash, label = k == 1 ? "Wet-bulb temp (°C)" : nothing)
end

# --- Relative-humidity curves (10 %–100 %), saturation prominent -------------
for rh in 0.1:0.1:1.0
    Wr = 1000 .* 0.621945 .* (rh .* p_ws) ./ (P .- rh .* p_ws)
    saturated = rh == 1.0
    lines!(ax, dry_bulb, Wr;
           color     = saturated ? RH_GREEN : (RH_GREEN, 0.7),
           linewidth = saturated ? 3.4 : 1.4,
           label     = saturated ? "Relative humidity" : nothing)
end

# --- Direct property labels --------------------------------------------------
# Relative humidity: along the W ≈ 16 g/kg reading line; curves that never reach it
# (the drier 20 % line) are anchored a few °C inside the right edge so the label
# clears the right spine.
for rh in (0.2, 0.4, 0.6, 0.8, 1.0)
    Wr = 1000 .* 0.621945 .* (rh .* p_ws) ./ (P .- rh .* p_ws)
    i = findfirst(>=(16.0), Wr)
    if i === nothing
        i = findlast(<=(47.0), dry_bulb)
        text!(ax, dry_bulb[i], Wr[i]; text = "$(round(Int, rh * 100))%",
              color = RH_GREEN, fontsize = 12, align = (:right, :bottom), font = :bold)
    else
        text!(ax, dry_bulb[i], Wr[i]; text = "$(round(Int, rh * 100))%",
              color = RH_GREEN, fontsize = 12, align = (:center, :bottom), font = :bold)
    end
end

# Enthalpy: in the empty triangle just outside the saturation curve
for h in (20.0, 40.0, 60.0, 80.0, 100.0)
    Wh = 1000 .* (h .- 1.006 .* dry_bulb) ./ (2501 .+ 1.86 .* dry_bulb)
    Wc = [(0.0 <= w <= ws) ? w : -Inf for (w, ws) in zip(Wh, W_sat)]
    j = argmax(Wc)
    text!(ax, dry_bulb[j] - 0.7, Wc[j] + 0.5; text = "$(round(Int, h))",
          color = ENT_OCHRE, fontsize = 11, align = (:right, :bottom), font = :bold)
end

# Wet-bulb: at the dry end (lower right) of each line
for twb in (5.0, 15.0, 25.0)
    pws_wb = 610.94 * exp(17.625 * twb / (twb + 243.04))
    Ws_wb  = 0.621945 * pws_wb / (P - pws_wb)
    Ww = 1000 .* ((2501 .- 2.326 * twb) .* Ws_wb .- 1.006 .* (dry_bulb .- twb)) ./
         (2501 .+ 1.86 .* dry_bulb .- 4.186 * twb)
    Wc = [(0.3 <= w <= ws) ? w : Inf for (w, ws) in zip(Ww, W_sat)]
    j = argmin(Wc)
    text!(ax, dry_bulb[j] + 0.4, Wc[j]; text = "$(round(Int, twb))",
          color = WB_BLUE, fontsize = 11, align = (:left, :center), font = :bold)
end

# Specific volume: at the mid-point of each valid segment
for v in (0.80, 0.86, 0.92)
    Wv = 1000 .* ((v .* 101.325 ./ (0.287042 .* (dry_bulb .+ 273.15))) .- 1) ./ 1.607858
    valid = findall(i -> 0.5 <= Wv[i] <= W_sat[i], eachindex(dry_bulb))
    isempty(valid) && continue
    m = valid[cld(length(valid), 2)]
    text!(ax, dry_bulb[m], Wv[m]; text = "$(v)", color = VOL_CYAN, fontsize = 11,
          align = (:center, :bottom), font = :bold)
end

# --- Example HVAC process: cooling + dehumidification ------------------------
# State 1: warm humid return air (30 °C, 50 % RH) → State 2: cool supply air (14 °C, 90 % RH)
pw1 = 0.50 * 610.94 * exp(17.625 * 30 / (30 + 243.04))
pw2 = 0.90 * 610.94 * exp(17.625 * 14 / (14 + 243.04))
W1  = 1000 * 0.621945 * pw1 / (P - pw1)
W2  = 1000 * 0.621945 * pw2 / (P - pw2)

lines!(ax, [30.0, 14.0], [W1, W2]; color = PROC_ROSE, linewidth = 3.4,
       label = "Cooling + dehumidification")
arrows!(ax, [30.0 + 0.8 * (14.0 - 30.0)], [W1 + 0.8 * (W2 - W1)],
        [0.2 * (14.0 - 30.0)], [0.2 * (W2 - W1)];
        color = PROC_ROSE, linewidth = 3.4, arrowsize = 18)
scatter!(ax, [30.0, 14.0], [W1, W2]; color = PROC_ROSE, markersize = 13,
         strokecolor = PAGE_BG, strokewidth = 2)
text!(ax, 30.5, W1; text = "①  return air", color = INK, fontsize = 13,
      align = (:left, :center), font = :bold)
text!(ax, 13.0, W2 - 1.7; text = "②  supply air", color = INK, fontsize = 13,
      align = (:right, :top), font = :bold)

# --- Legend ------------------------------------------------------------------
axislegend(ax; position = :rb, labelsize = 12, labelcolor = INK,
           backgroundcolor = ELEVATED_BG, framecolor = INK_SOFT,
           framevisible = true, padding = (10, 10, 8, 8), rowgap = 3)

# --- Save --------------------------------------------------------------------
save("plot-$(THEME).png", fig; px_per_unit = 2)
Runnable source as JSON, for any HTTP client: https://api.anyplot.ai/specs/psychrometric-basic/makie/code. Any spec id and library id listed in llms-full.txt fit the same URL shape; every URL below is complete and callable.
{
  "spec_id": "psychrometric-basic",
  "language": "julia",
  "library": "makie",
  "page": "https://anyplot.ai/psychrometric-basic/julia/makie",
  "hub": "https://anyplot.ai/psychrometric-basic",
  "code_json": "https://api.anyplot.ai/specs/psychrometric-basic/makie/code",
  "spec_json": "https://api.anyplot.ai/specs/psychrometric-basic",
  "render_light_png": "https://storage.googleapis.com/anyplot-images/plots/psychrometric-basic/julia/makie/plot-light.png",
  "render_dark_png": "https://storage.googleapis.com/anyplot-images/plots/psychrometric-basic/julia/makie/plot-dark.png",
  "quality_score": 88.0,
  "license": "MIT",
  "guide": "https://anyplot.ai/llms.txt"
}
Part of Psychrometric Chart for HVAC on anyplot.ai.