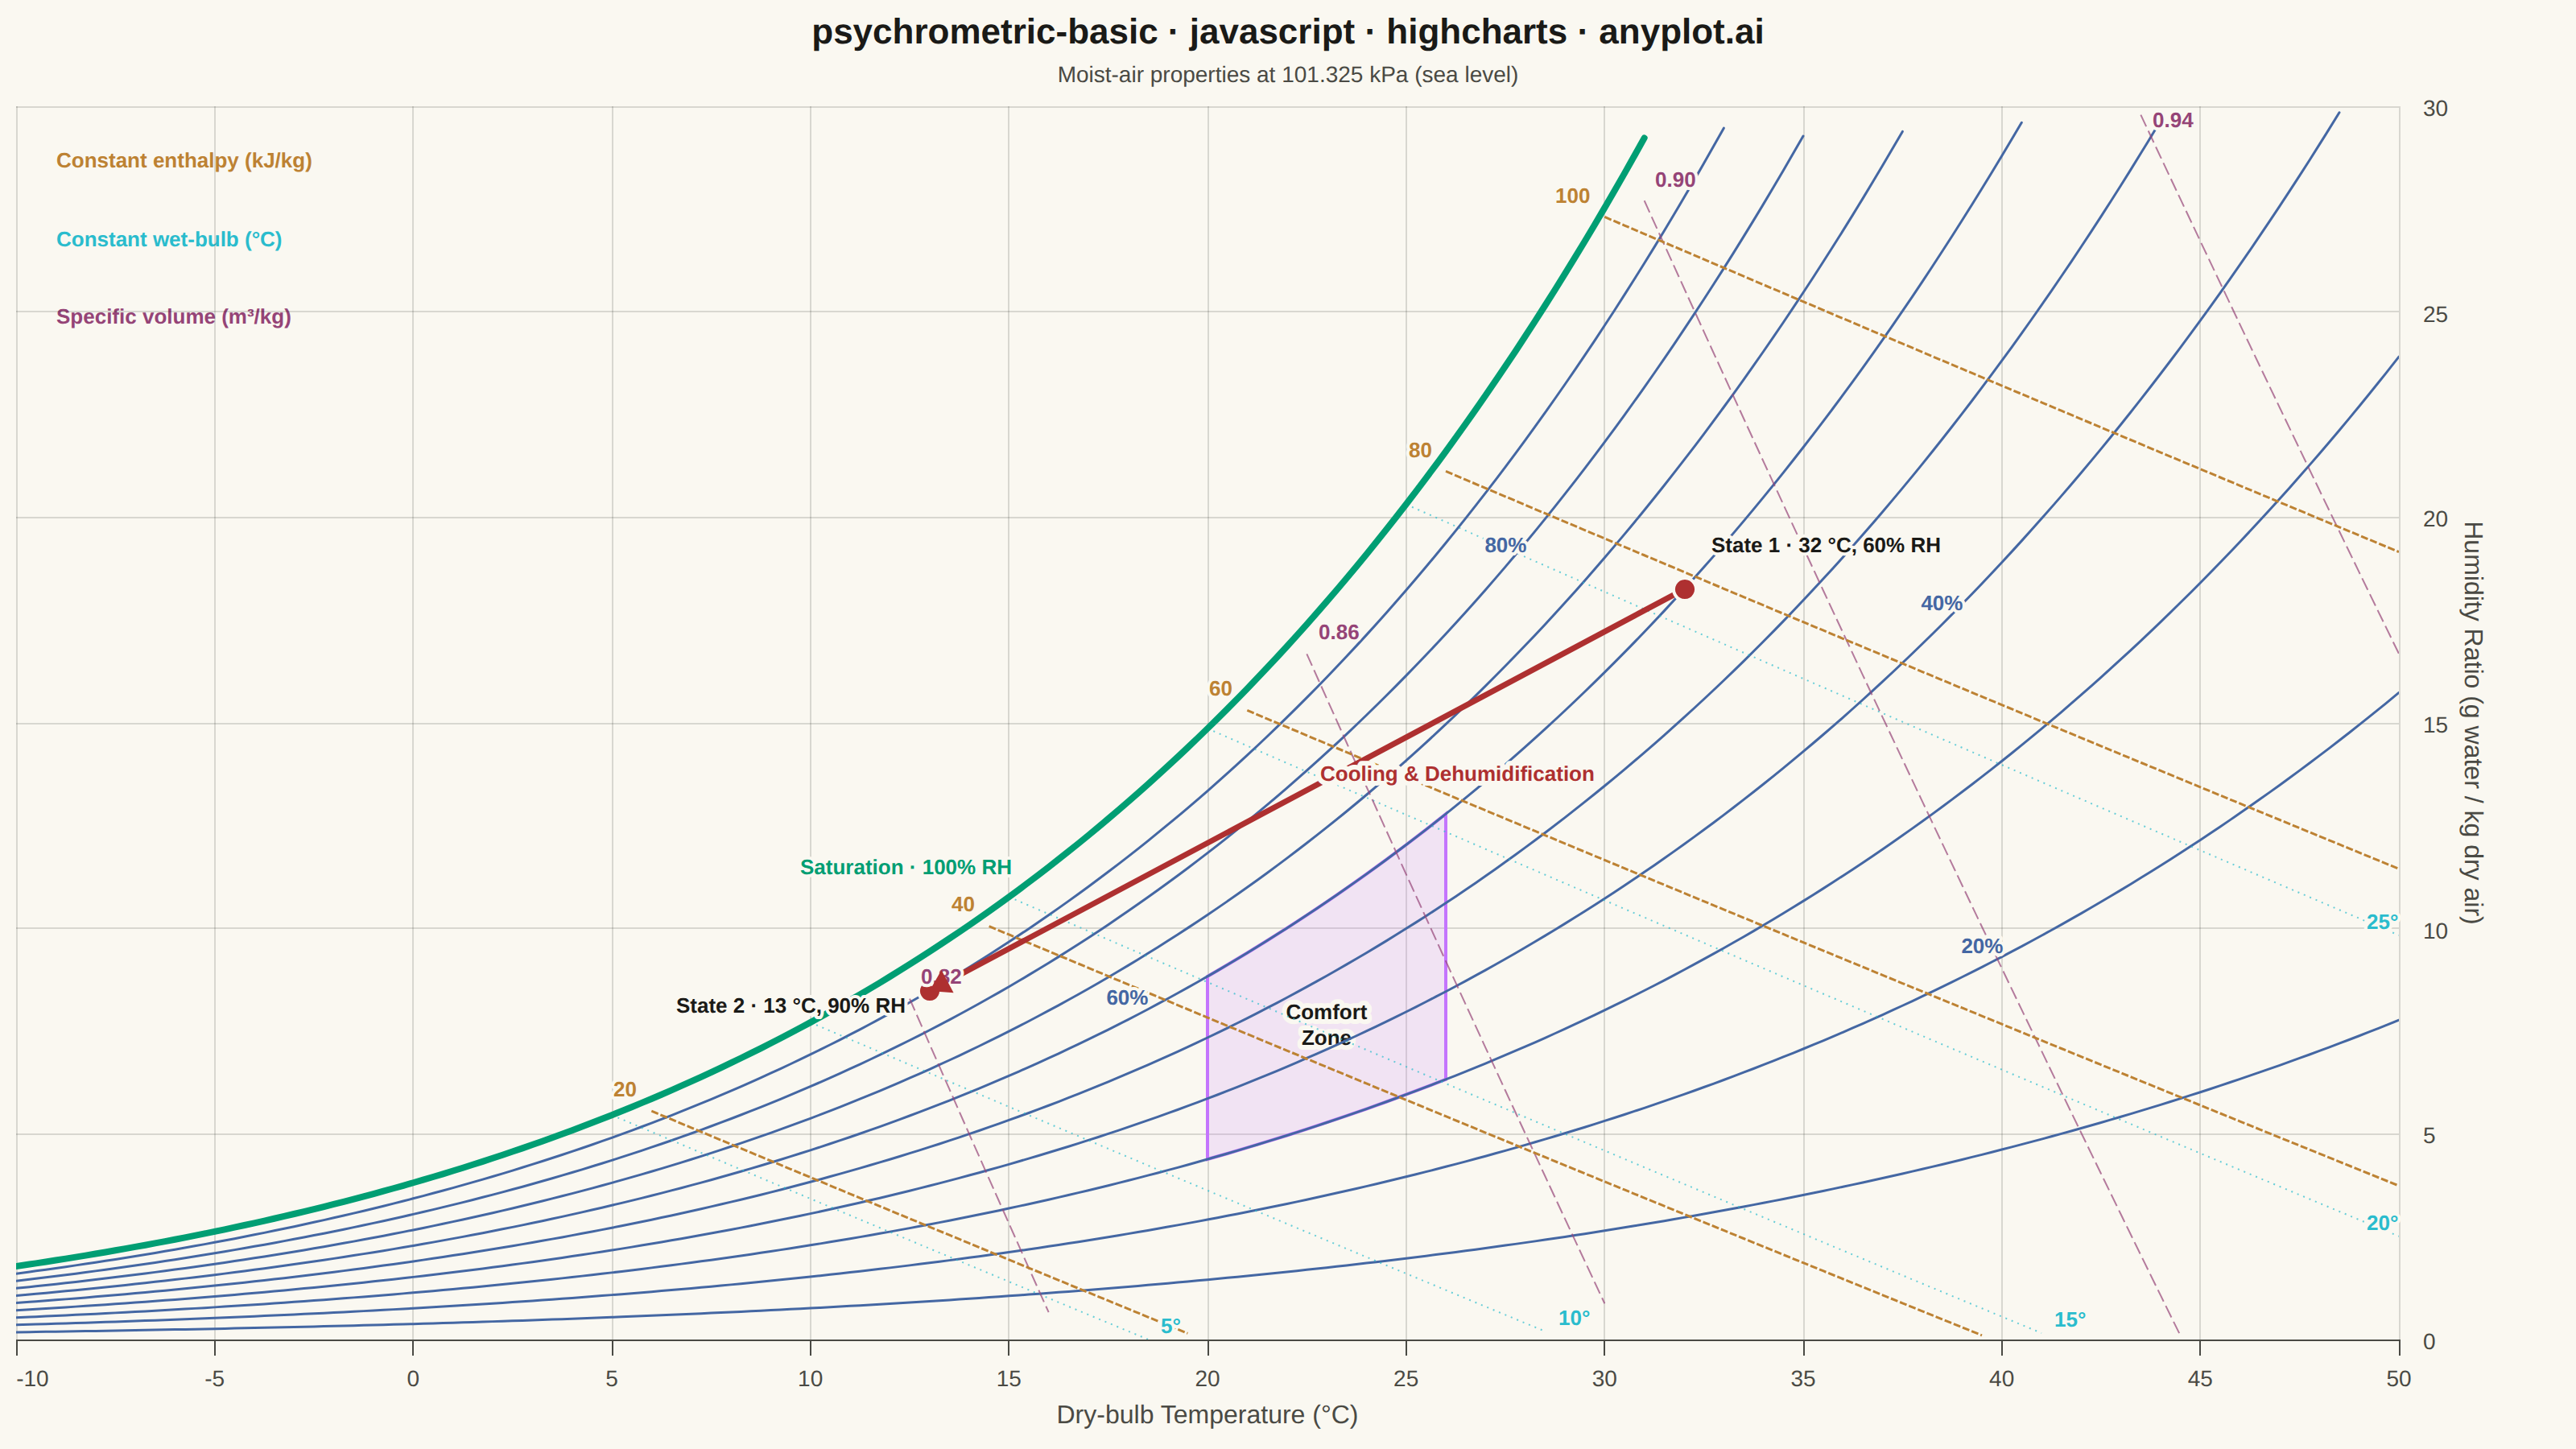
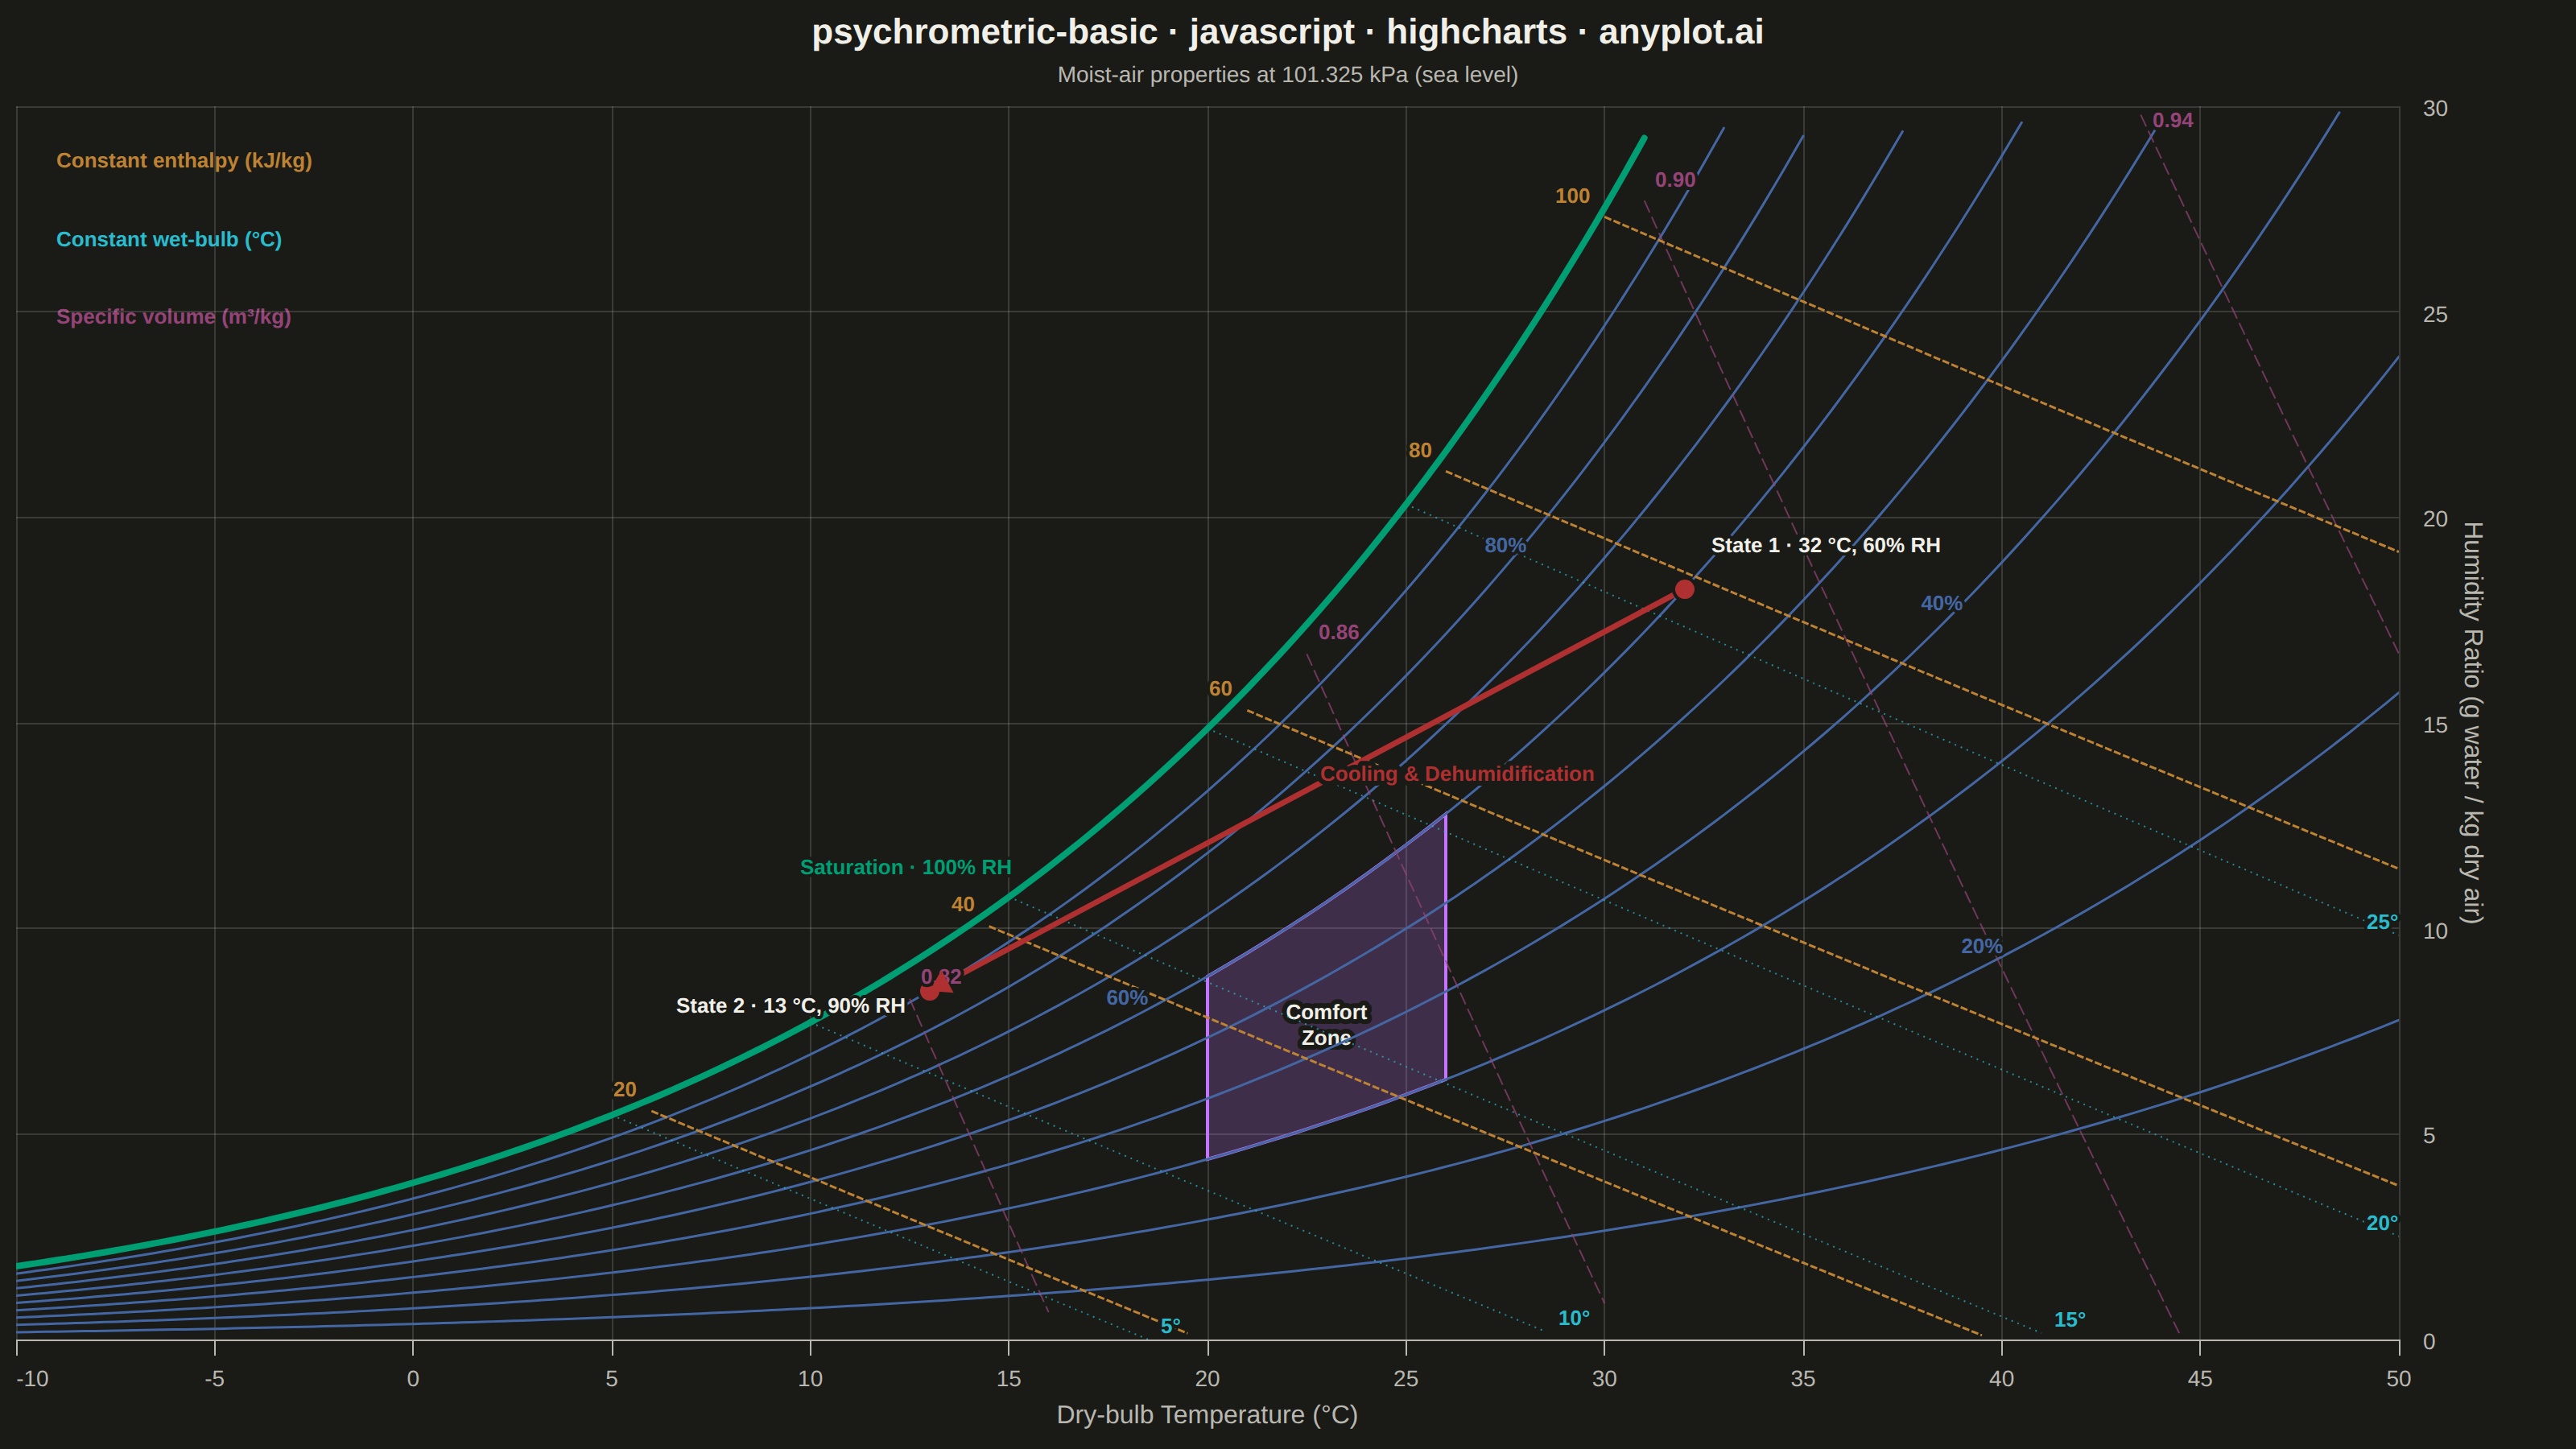
A psychrometric chart plots dry-bulb temperature against humidity ratio, overlaid with curves for relative humidity, wet-bulb temperature, enthalpy, and specific volume. It is the fundamental tool for HVAC system design and air conditioning process analysis. The chart reveals the thermodynamic properties of moist air at a glance, enabling engineers to trace heating, cooling, humidification, and dehumidification processes as paths on the diagram.
// anyplot.ai
// psychrometric-basic: Psychrometric Chart for HVAC
// Library: highcharts 12.6.0 | JavaScript 22.22.3
// Quality: 90/100 | Created: 2026-06-16
//# anyplot-orientation: landscape
// anyplot.ai
// psychrometric-basic: Psychrometric Chart for HVAC
// Library: Highcharts 12.6.0 | Node 22
// License: Highcharts — commercial license, free for non-commercial use (highcharts.com/license)
// Quality: pending | Created: 2026-06-16
const t = window.ANYPLOT_TOKENS;
const THEME = window.ANYPLOT_THEME;
// Theme-adaptive chrome
const PAGE_BG = t.pageBg;
const INK = t.ink;
const INK_SOFT = t.inkSoft;
const GRID = t.grid;
// Imprint palette roles (water/humidity → blue; comfort → lavender; loss/process → matte red)
const GREEN = t.palette[0]; // brand — saturation curve (hero series)
const LAV = t.palette[1]; // comfort zone
const BLUE = t.palette[2]; // relative-humidity family (water semantic)
const OCHRE = t.palette[3]; // constant-enthalpy family
const RED = t.palette[4]; // HVAC process path (active, highlighted)
const CYAN = t.palette[5]; // constant wet-bulb family (evaporative-cool semantic)
const ROSE = t.palette[6]; // constant specific-volume family
const COMFORT_FILL =
THEME === "light" ? "rgba(196,117,253,0.16)" : "rgba(196,117,253,0.22)";
// --- Psychrometrics (ASHRAE, standard sea-level pressure) -------------------
const P = 101.325; // kPa
const YMAX = 30; // humidity-ratio axis cap (g water / kg dry air)
// Saturation vapor pressure over water (kPa), T in °C — ASHRAE RP-1485
function pws(T) {
const Tk = T + 273.15;
const e =
-5800.2206 / Tk +
1.3914993 +
-0.04860239 * Tk +
4.1764768e-5 * Tk * Tk +
-1.4452093e-8 * Tk * Tk * Tk +
6.5459673 * Math.log(Tk);
return Math.exp(e) / 1000; // Pa → kPa
}
// Humidity ratio (g/kg) from dry-bulb T (°C) and relative humidity (0–1)
function humidityRatio(T, rh) {
const pw = rh * pws(T);
return (1000 * 0.621945 * pw) / (P - pw);
}
// --- Curve builders ---------------------------------------------------------
// Relative-humidity curve (constant RH) across the dry-bulb range
function rhCurve(rh) {
const pts = [];
for (let T = -10; T <= 50; T += 0.5) {
const w = humidityRatio(T, rh);
if (w >= 0 && w <= YMAX) pts.push([T, w]);
}
return pts;
}
// Constant-enthalpy line, clipped to the valid region below saturation
function enthalpyLine(h) {
const pts = [];
for (let T = -10; T <= 50; T += 0.5) {
const wg = (1000 * (h - 1.006 * T)) / (2501 + 1.86 * T);
const wsat = humidityRatio(T, 1.0);
if (wg >= 0 && wg <= YMAX && wg <= wsat + 0.01) pts.push([T, wg]);
}
return pts;
}
// Constant wet-bulb line (ASHRAE energy balance). It springs from the
// saturation curve at T = twb and runs diagonally down to the right.
function wetBulbLine(twb) {
const wsatWb = humidityRatio(twb, 1.0) / 1000; // kg/kg at saturation
const pts = [];
for (let T = twb; T <= 50; T += 0.5) {
const w =
((2501 - 2.326 * twb) * wsatWb - 1.006 * (T - twb)) /
(2501 + 1.86 * T - 4.186 * twb); // kg/kg dry air
const wg = w * 1000;
if (wg >= 0 && wg <= YMAX) pts.push([T, wg]);
}
return pts;
}
// Constant specific-volume line (ideal moist-air state equation, Ra = 0.287042
// kJ/kg·K). These run at a steeper angle than the enthalpy/wet-bulb diagonals.
function specVolumeLine(v) {
const Ra = 0.287042;
const pts = [];
for (let T = -10; T <= 50; T += 0.5) {
const w = ((v * P) / (Ra * (T + 273.15)) - 1) / 1.6078; // kg/kg dry air
const wg = w * 1000;
const wsat = humidityRatio(T, 1.0);
if (wg >= 0 && wg <= YMAX && wg <= wsat + 0.01) pts.push([T, wg]);
}
return pts;
}
// Label styling: ink halo so direct labels stay legible over crossing lines
function labelStyle(color) {
return {
color,
fontSize: "13px",
fontWeight: "600",
textOutline: `2px ${PAGE_BG}`,
};
}
// --- Series -----------------------------------------------------------------
const series = [];
// Relative-humidity curves (10%–100%); 100% saturation is the bold hero curve
// Label fraction along each curve; 60% sits lower-left so it clears State 1.
const rhLabels = {
20: { text: "20%", frac: 0.82 },
40: { text: "40%", frac: 0.82 },
60: { text: "60%", frac: 0.55 },
80: { text: "80%", frac: 0.82 },
};
for (let pct = 10; pct <= 90; pct += 10) {
const pts = rhCurve(pct / 100);
if (rhLabels[pct]) {
const i = Math.round(pts.length * rhLabels[pct].frac);
pts[i] = {
x: pts[i][0],
y: pts[i][1],
dataLabels: {
enabled: true,
format: rhLabels[pct].text,
align: "center",
verticalAlign: "bottom",
y: -2,
style: labelStyle(BLUE),
},
};
}
series.push({
type: "spline",
data: pts,
color: BLUE,
lineWidth: 1.5,
enableMouseTracking: false,
zIndex: 2,
});
}
// Saturation curve (100% RH) — visually prominent upper boundary
const satPts = rhCurve(1.0);
const si = Math.round(satPts.length * 0.62);
satPts[si] = {
x: satPts[si][0],
y: satPts[si][1],
dataLabels: {
enabled: true,
format: "Saturation · 100% RH",
align: "right",
x: -6,
y: 2,
style: labelStyle(GREEN),
},
};
series.push({
type: "spline",
data: satPts,
color: GREEN,
lineWidth: 4,
enableMouseTracking: false,
zIndex: 4,
});
// Constant-enthalpy lines (diagonal, upper-left → lower-right), dashed
const enthalpies = [20, 40, 60, 80, 100];
for (const h of enthalpies) {
const pts = enthalpyLine(h);
if (pts.length < 2) continue;
pts[0] = {
x: pts[0][0],
y: pts[0][1],
dataLabels: {
enabled: true,
format: String(h),
align: "right",
x: -4,
y: -2,
style: labelStyle(OCHRE),
},
};
series.push({
type: "line",
data: pts,
color: OCHRE,
lineWidth: 1.5,
dashStyle: "ShortDash",
enableMouseTracking: false,
zIndex: 3,
});
}
// Constant wet-bulb lines (diagonal, springing off the saturation curve).
// Drawn thin & dotted so they stay distinct from the enthalpy diagonals.
const wetBulbs = [5, 10, 15, 20, 25];
for (const twb of wetBulbs) {
const pts = wetBulbLine(twb);
if (pts.length < 2) continue;
const li = pts.length - 1;
pts[li] = {
x: pts[li][0],
y: pts[li][1],
dataLabels: {
enabled: true,
format: `${twb}°`,
align: "left",
x: 3,
y: 3,
style: labelStyle(CYAN),
},
};
series.push({
type: "line",
data: pts,
color: CYAN,
lineWidth: 1,
dashStyle: "Dot",
opacity: 0.7,
enableMouseTracking: false,
zIndex: 2,
});
}
// Constant specific-volume lines (steeper diagonal). Thin & long-dashed.
const specVolumes = [0.82, 0.86, 0.9, 0.94];
for (const v of specVolumes) {
const pts = specVolumeLine(v);
if (pts.length < 2) continue;
pts[0] = {
x: pts[0][0],
y: pts[0][1],
dataLabels: {
enabled: true,
format: v.toFixed(2),
align: "left",
x: 2,
y: -2,
style: labelStyle(ROSE),
},
};
series.push({
type: "line",
data: pts,
color: ROSE,
lineWidth: 1,
dashStyle: "LongDash",
opacity: 0.7,
enableMouseTracking: false,
zIndex: 2,
});
}
// HVAC process path: cooling & dehumidification between two state points
const stateA = { T: 32, rh: 0.6 };
const stateB = { T: 13, rh: 0.9 };
const wA = humidityRatio(stateA.T, stateA.rh);
const wB = humidityRatio(stateB.T, stateB.rh);
series.push({
type: "line",
color: RED,
lineWidth: 3.5,
zIndex: 6,
enableMouseTracking: false,
marker: { enabled: true, radius: 7, lineColor: PAGE_BG, lineWidth: 2, symbol: "circle" },
data: [
{
x: stateA.T,
y: wA,
dataLabels: {
enabled: true,
format: "State 1 · 32 °C, 60% RH",
align: "left",
x: 12,
y: -16,
style: labelStyle(INK),
},
},
{
x: stateB.T,
y: wB,
dataLabels: {
enabled: true,
format: "State 2 · 13 °C, 90% RH",
align: "right",
x: -10,
y: 20,
style: labelStyle(INK),
},
},
],
});
// --- Chart ------------------------------------------------------------------
Highcharts.chart("container", {
chart: {
type: "spline",
backgroundColor: "transparent",
animation: false,
style: { fontFamily: "inherit" },
marginRight: 110,
events: {
// Comfort zone (≈20–26 °C, 30–60% RH), process arrowhead, and zone label
// are drawn with the SVG renderer so they sit at exact data coordinates.
load() {
const ax = this.xAxis[0];
const ay = this.yAxis[0];
const px = (v) => ax.toPixels(v);
const py = (v) => ay.toPixels(v);
// Comfort zone polygon — sample its RH/temperature boundary
const zone = [];
for (let T = 20; T <= 26; T += 0.5) zone.push([T, humidityRatio(T, 0.3)]);
for (let r = 0.3; r <= 0.6; r += 0.05) zone.push([26, humidityRatio(26, r)]);
for (let T = 26; T >= 20; T -= 0.5) zone.push([T, humidityRatio(T, 0.6)]);
for (let r = 0.6; r >= 0.3; r -= 0.05) zone.push([20, humidityRatio(20, r)]);
const path = [];
zone.forEach((p, idx) => {
path.push(idx === 0 ? "M" : "L", px(p[0]), py(p[1]));
});
path.push("Z");
this.renderer
.path(path)
.attr({ fill: COMFORT_FILL, stroke: LAV, "stroke-width": 2, zIndex: 1 })
.add();
this.renderer
.text("Comfort<br/>Zone", px(23), py(humidityRatio(23, 0.45)) + 4)
.attr({ align: "center", zIndex: 2 })
.css({
color: INK,
fontSize: "13px",
fontWeight: "600",
textOutline: `3px ${PAGE_BG}`,
})
.add();
// Process arrowhead at State 2
const x1 = px(stateA.T);
const y1 = py(wA);
const x2 = px(stateB.T);
const y2 = py(wB);
const ang = Math.atan2(y2 - y1, x2 - x1);
const s = 15;
const a1 = ang + Math.PI * 0.82;
const a2 = ang - Math.PI * 0.82;
this.renderer
.path([
"M", x2, y2,
"L", x2 + s * Math.cos(a1), y2 + s * Math.sin(a1),
"L", x2 + s * Math.cos(a2), y2 + s * Math.sin(a2),
"Z",
])
.attr({ fill: RED, zIndex: 7 })
.add();
this.renderer
.text("Cooling & Dehumidification", (x1 + x2) / 2 + 8, (y1 + y2) / 2 - 6)
.attr({ zIndex: 7 })
.css({
color: RED,
fontSize: "13px",
fontWeight: "600",
textOutline: `3px ${PAGE_BG}`,
})
.add();
// Property-family key (upper-left, where the diagonal lines originate)
const note = (label, color, w) =>
this.renderer
.text(label, px(-9), py(w))
.css({
color,
fontSize: "13px",
fontWeight: "600",
textOutline: `3px ${PAGE_BG}`,
})
.add();
note("Constant enthalpy (kJ/kg)", OCHRE, 28.5);
note("Constant wet-bulb (°C)", CYAN, 26.6);
note("Specific volume (m³/kg)", ROSE, 24.7);
},
},
},
credits: { enabled: false },
colors: t.palette,
title: {
text: "psychrometric-basic · javascript · highcharts · anyplot.ai",
style: { color: INK, fontSize: "22px", fontWeight: "600" },
},
subtitle: {
text: "Moist-air properties at 101.325 kPa (sea level)",
style: { color: INK_SOFT, fontSize: "14px" },
},
xAxis: {
min: -10,
max: 50,
tickInterval: 5,
title: {
text: "Dry-bulb Temperature (°C)",
style: { color: INK_SOFT, fontSize: "16px" },
},
lineColor: INK_SOFT,
tickColor: INK_SOFT,
gridLineColor: GRID,
gridLineWidth: 1,
labels: { style: { color: INK_SOFT, fontSize: "14px" } },
},
yAxis: {
min: 0,
max: YMAX,
tickInterval: 5,
opposite: true,
title: {
text: "Humidity Ratio (g water / kg dry air)",
style: { color: INK_SOFT, fontSize: "16px" },
},
lineColor: INK_SOFT,
gridLineColor: GRID,
gridLineWidth: 1,
labels: { style: { color: INK_SOFT, fontSize: "14px" } },
},
legend: { enabled: false },
plotOptions: {
series: {
animation: false,
marker: { enabled: false },
states: { hover: { enabled: false }, inactive: { enabled: false } },
},
},
series,
});
Runnable source as JSON, for any HTTP client: https://api.anyplot.ai/specs/psychrometric-basic/highcharts/code. Any spec id and library id listed in llms-full.txt fit the same URL shape; every URL below is complete and callable.
{
  "spec_id": "psychrometric-basic",
  "language": "javascript",
  "library": "highcharts",
  "page": "https://anyplot.ai/psychrometric-basic/javascript/highcharts",
  "hub": "https://anyplot.ai/psychrometric-basic",
  "code_json": "https://api.anyplot.ai/specs/psychrometric-basic/highcharts/code",
  "spec_json": "https://api.anyplot.ai/specs/psychrometric-basic",
  "render_light_png": "https://storage.googleapis.com/anyplot-images/plots/psychrometric-basic/javascript/highcharts/plot-light.png",
  "render_dark_png": "https://storage.googleapis.com/anyplot-images/plots/psychrometric-basic/javascript/highcharts/plot-dark.png",
  "interactive_light_html": "https://storage.googleapis.com/anyplot-images/plots/psychrometric-basic/javascript/highcharts/plot-light.html",
  "interactive_dark_html": "https://storage.googleapis.com/anyplot-images/plots/psychrometric-basic/javascript/highcharts/plot-dark.html",
  "quality_score": 90.0,
  "license": "MIT",
  "guide": "https://anyplot.ai/llms.txt"
}
Part of Psychrometric Chart for HVAC on anyplot.ai.