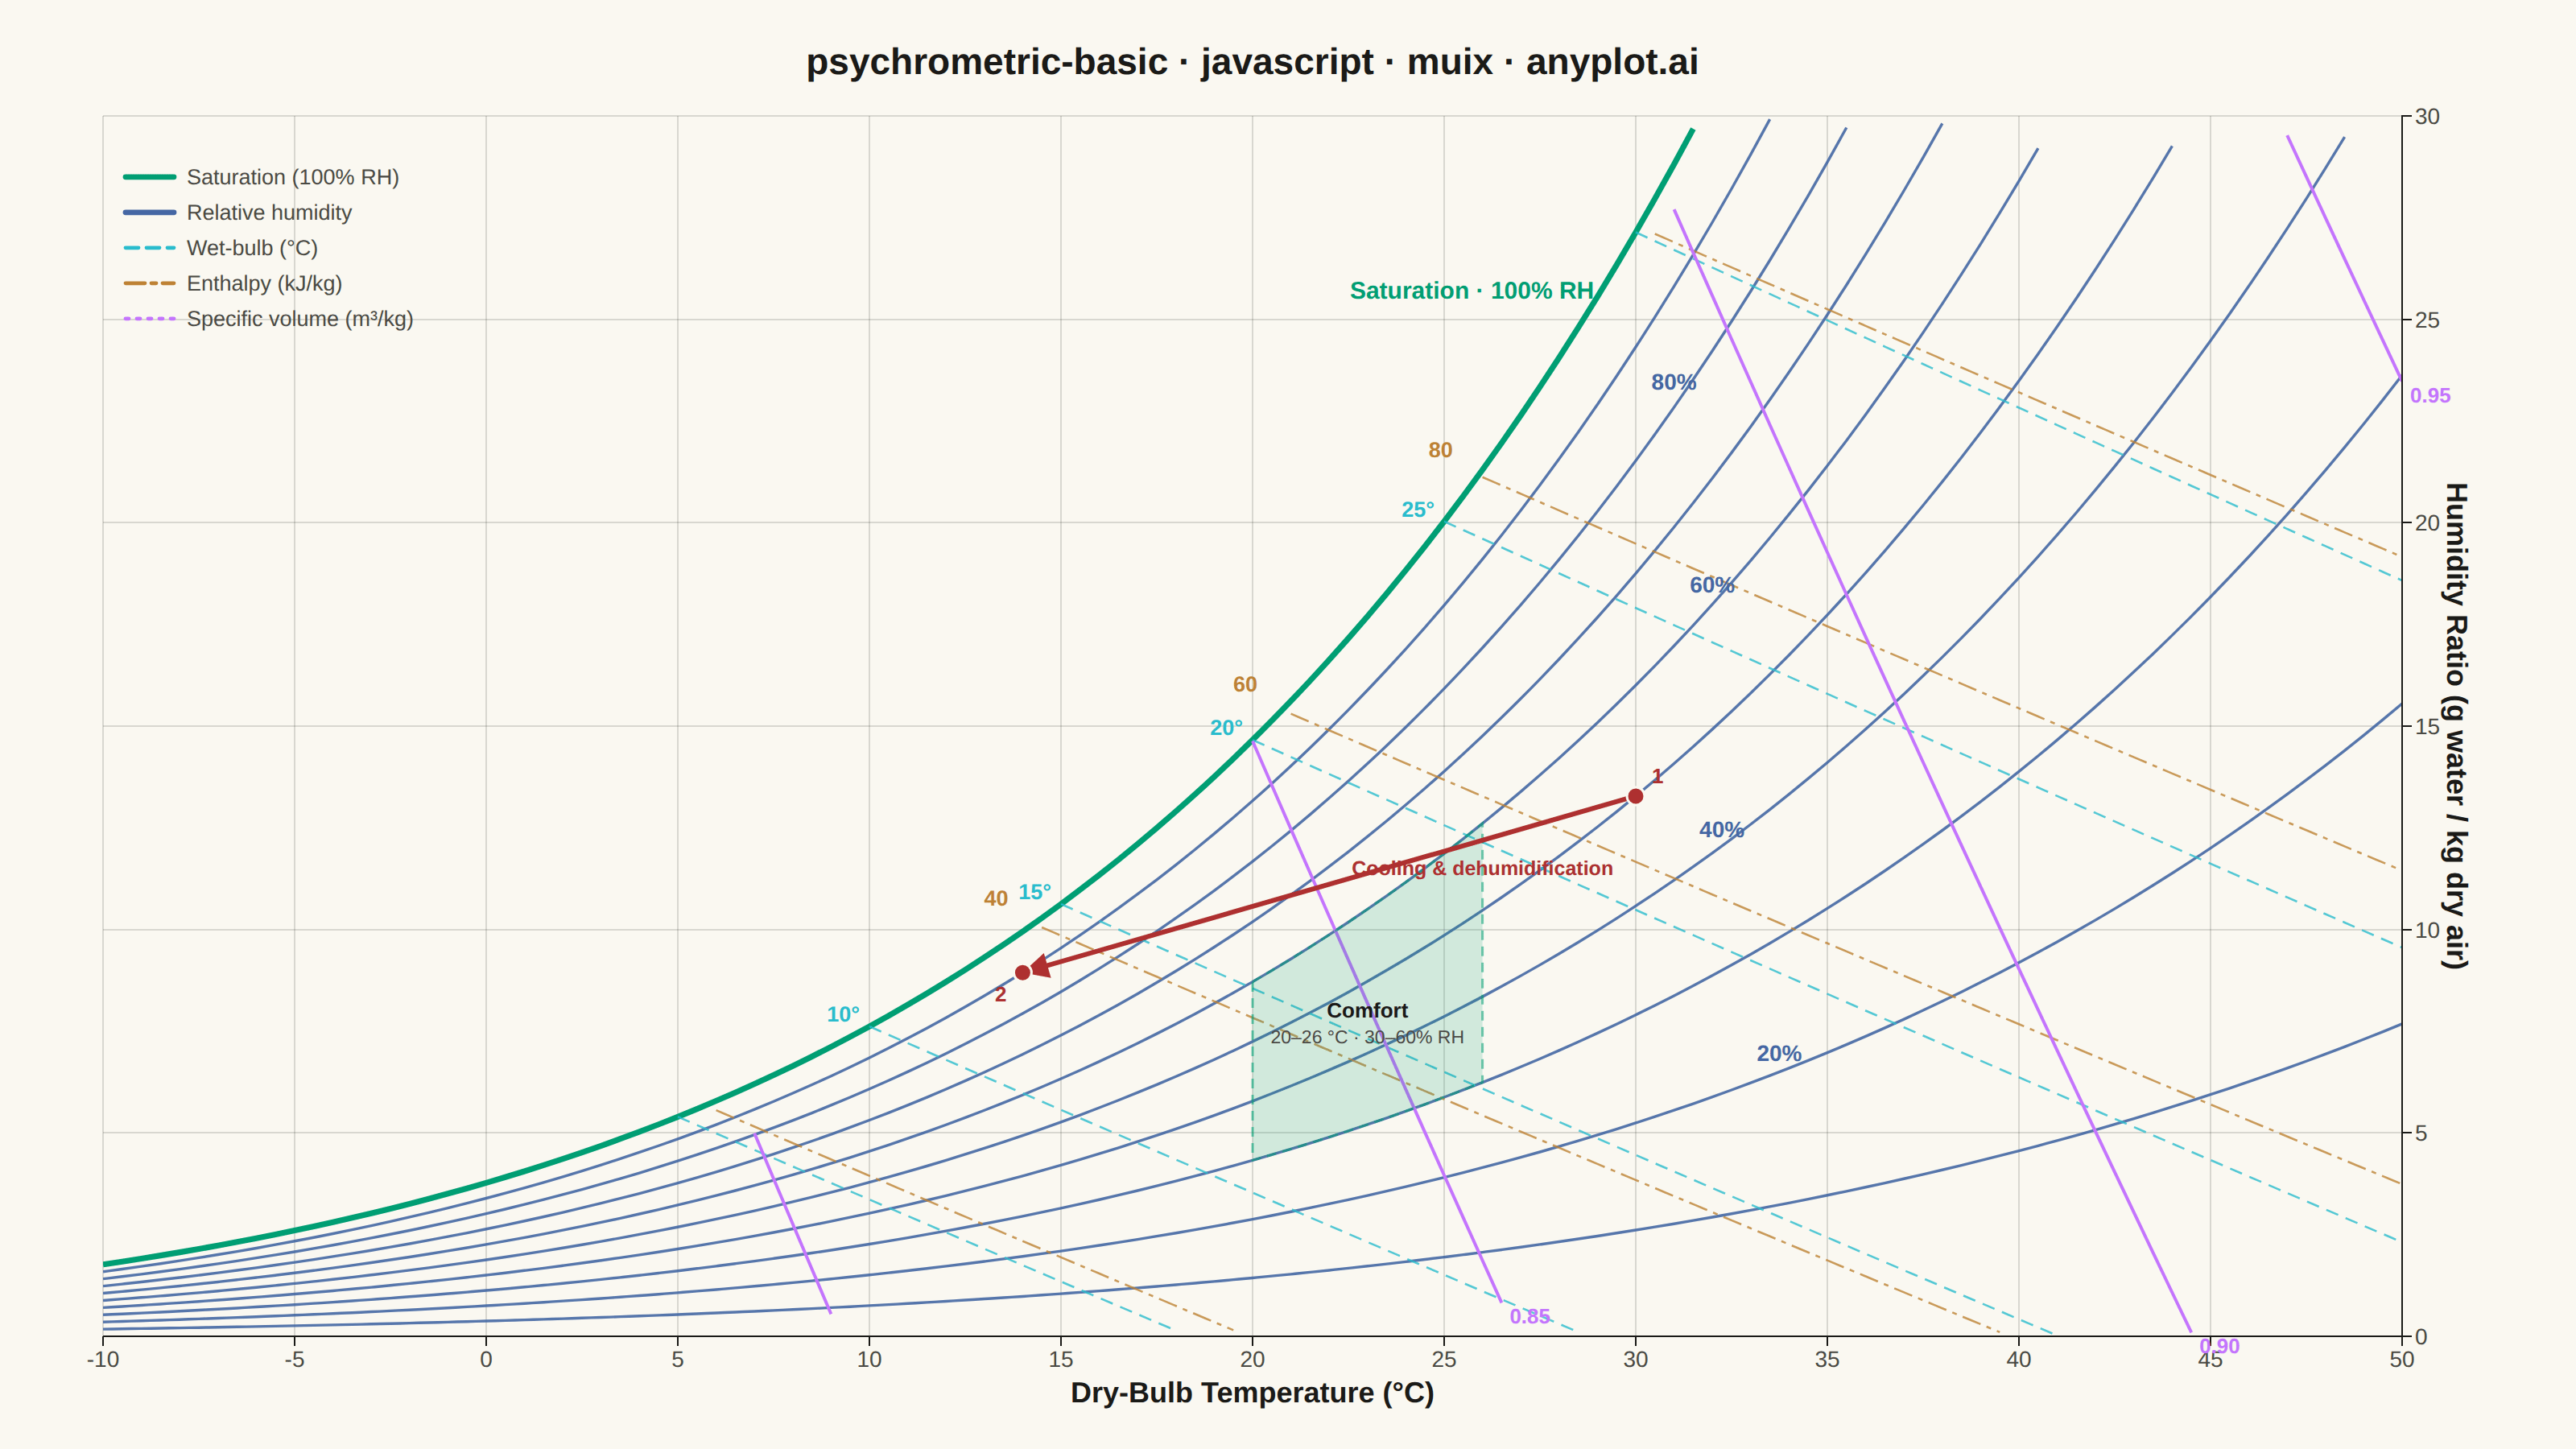
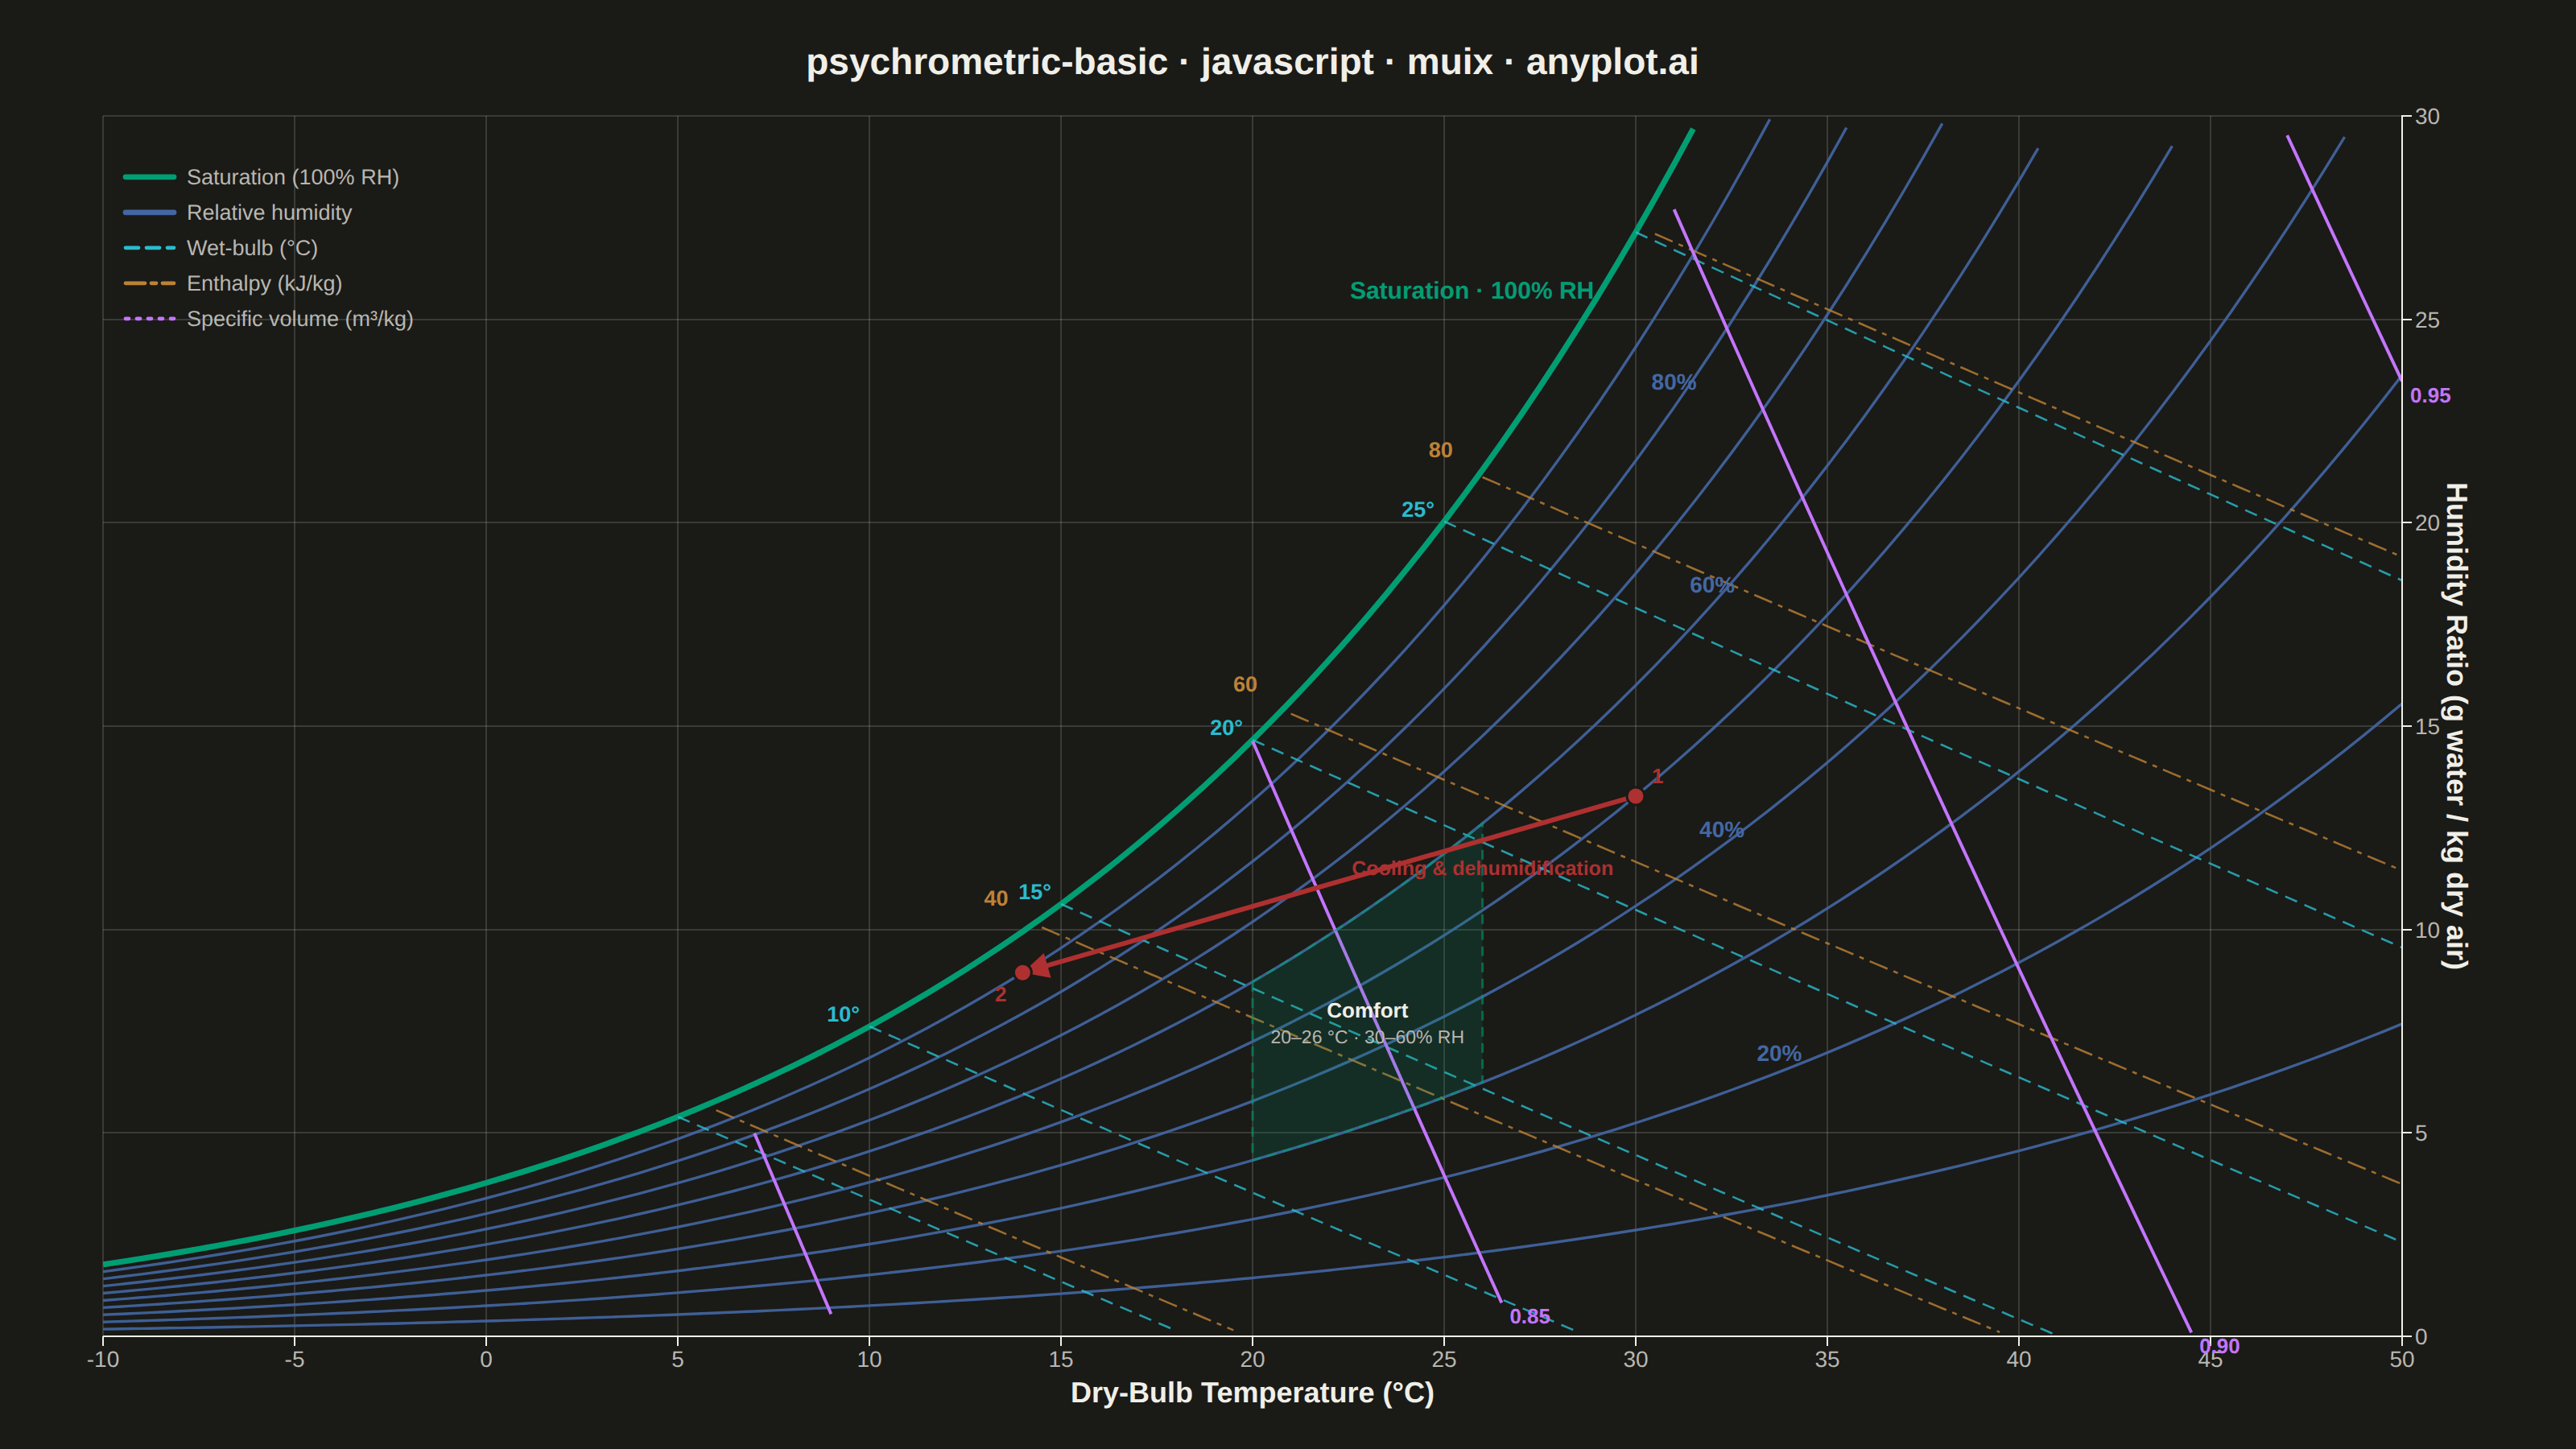
A psychrometric chart plots dry-bulb temperature against humidity ratio, overlaid with curves for relative humidity, wet-bulb temperature, enthalpy, and specific volume. It is the fundamental tool for HVAC system design and air conditioning process analysis. The chart reveals the thermodynamic properties of moist air at a glance, enabling engineers to trace heating, cooling, humidification, and dehumidification processes as paths on the diagram.
// anyplot.ai
// psychrometric-basic: Psychrometric Chart for HVAC
// Library: muix 7.29.1 | JavaScript 22.22.3
// Quality: 90/100 | Created: 2026-06-16
//# anyplot-orientation: landscape
// anyplot.ai
// psychrometric-basic: Psychrometric Chart for HVAC
// Library: MUI X Charts | React | Node 22
// License: @mui/x-charts — MIT (community). Pro/Premium are out of scope.
// Quality: pending | Created: 2026-06-16
import { LineChart } from "@mui/x-charts/LineChart";
import { useDrawingArea, useXScale, useYScale } from "@mui/x-charts/hooks";
const t = window.ANYPLOT_TOKENS;
const SIZE = window.ANYPLOT_SIZE;
// Imprint palette roles (data colours are theme-independent) ------------------
const C_SAT = t.palette[0]; // brand green — saturation (100% RH), first series
const C_RH = t.palette[2]; // blue — relative-humidity curves
const C_WB = t.palette[5]; // cyan — wet-bulb lines
const C_ENT = t.palette[3]; // ochre — enthalpy lines
const C_VOL = t.palette[1]; // lavender — specific-volume lines
const C_PROC = t.palette[4]; // matte red — example HVAC process path
const INK = t.ink;
const INK_SOFT = t.inkSoft;
// --- Psychrometrics @ sea level (ASHRAE, 101.325 kPa) -----------------------
const P_PA = 101325; // total pressure, Pa
const Y_MAX = 30; // humidity-ratio axis ceiling, g/kg dry air
const X_MIN = -10;
const X_MAX = 50;
// Saturation vapour pressure over water (Alduchov–Eskridge), Pa
const pws = (tc) => 610.94 * Math.exp((17.625 * tc) / (tc + 243.04));
// Humidity ratio (kg/kg) at dry-bulb tc and relative humidity rh (fraction)
const wFrac = (tc, rh) => {
const pw = rh * pws(tc);
return (0.621945 * pw) / (P_PA - pw);
};
const wSat = (tc) => wFrac(tc, 1); // kg/kg on the saturation line
const gkg = (wkg) => wkg * 1000; // kg/kg → g/kg
// Humidity ratio along a constant wet-bulb line (ASHRAE), kg/kg
const wWetBulb = (tc, twb) => {
const wStar = wSat(twb);
const num = (2501 - 2.326 * twb) * wStar - 1.006 * (tc - twb);
const den = 2501 + 1.86 * tc - 4.186 * twb;
return num / den;
};
// Humidity ratio along a constant moist-air enthalpy line (kJ/kg), kg/kg
const wEnthalpy = (tc, h) => (h - 1.006 * tc) / (2501 + 1.86 * tc);
// Humidity ratio along a constant specific-volume line (m3/kg dry air), kg/kg
const wVolume = (tc, v) => {
const tk = tc + 273.15;
return ((v * 101.325) / (0.287042 * tk) - 1) / 1.607858;
};
// --- Shared dry-bulb grid (the line series' common x positions) -------------
const temps = [];
for (let tc = X_MIN; tc <= X_MAX + 1e-9; tc += 0.5) temps.push(Math.round(tc * 2) / 2);
// Clip a g/kg value to the visible, physically-valid envelope (below
// saturation, inside the axis box) — otherwise NaN/null breaks the line.
const clip = (wg, tc) => {
if (!Number.isFinite(wg) || wg < 0 || wg > Y_MAX) return null;
if (wg > gkg(wSat(tc)) + 1e-6) return null; // never above the saturation curve
return wg;
};
const lineFor = (fn) => temps.map((tc) => clip(gkg(fn(tc)), tc));
// --- Build the property-line series -----------------------------------------
const RH_LEVELS = [10, 20, 30, 40, 50, 60, 70, 80, 90]; // %, saturation drawn separately
const WB_LEVELS = [5, 10, 15, 20, 25, 30]; // °C
const ENT_LEVELS = [20, 40, 60, 80, 100]; // kJ/kg
const VOL_LEVELS = [0.8, 0.85, 0.9, 0.95]; // m³/kg dry air
const mk = (id, color, data) => ({
id,
type: "line",
data,
color,
curve: "monotoneX",
showMark: false,
disableHighlight: true,
connectNulls: false,
});
const series = [
// Saturation curve (100% RH) — visually dominant, brand green, drawn first.
mk("sat", C_SAT, lineFor((tc) => wSat(tc))),
...RH_LEVELS.map((rh) => mk(`rh-${rh}`, C_RH, lineFor((tc) => wFrac(tc, rh / 100)))),
...WB_LEVELS.map((twb) =>
mk(`wb-${twb}`, C_WB, temps.map((tc) => (tc < twb ? null : clip(gkg(wWetBulb(tc, twb)), tc)))),
),
...ENT_LEVELS.map((h) => mk(`ent-${h}`, C_ENT, lineFor((tc) => wEnthalpy(tc, h)))),
...VOL_LEVELS.map((v) => mk(`vol-${v}`, C_VOL, lineFor((tc) => wVolume(tc, v)))),
];
// Per-family stroke styling (MUI X has no per-series dash prop → target the
// generated `.MuiLineElement-series-<id>` classes via the chart `sx`).
const familyStyle = {
sat: { strokeWidth: 3.6 },
rh: { strokeWidth: 1.7, opacity: 0.9 },
wb: { strokeWidth: 1.3, opacity: 0.8, strokeDasharray: "8 5" },
ent: { strokeWidth: 1.3, opacity: 0.8, strokeDasharray: "12 4 3 4" },
vol: { strokeWidth: 1.1, opacity: 0.75, strokeDasharray: "2 5" },
};
const lineSx = { "& .MuiMarkElement-root": { display: "none" } };
for (const s of series) {
const fam = s.id.split("-")[0];
lineSx[`& .MuiLineElement-series-${s.id}`] = familyStyle[fam];
}
// --- Direct-on-chart labels (data-space coords; positioned via the scales) ---
// Find the dry-bulb temperature where a curve reaches a target humidity ratio.
const tempForW = (rhFrac, targetWg) => {
let best = X_MIN;
let bestD = Infinity;
for (let tc = X_MIN; tc <= X_MAX; tc += 0.25) {
const d = Math.abs(gkg(wFrac(tc, rhFrac)) - targetWg);
if (d < bestD) {
bestD = d;
best = tc;
}
}
return best;
};
// RH curve labels, spread vertically so they sit along their own curve.
const RH_LABELS = [
{ rh: 80, w: 23 },
{ rh: 60, w: 18 },
{ rh: 40, w: 12 },
{ rh: 20, w: 6.5 },
].map(({ rh, w }) => ({
tc: tempForW(rh / 100, w),
w,
text: `${rh}%`,
color: C_RH,
anchor: "middle",
dx: 0,
dy: -7,
fs: 14,
weight: 600,
}));
// Wet-bulb values, placed at each line's origin on the saturation curve.
const WB_LABELS = [10, 15, 20, 25].map((twb) => ({
tc: twb,
w: gkg(wSat(twb)),
text: `${twb}°`,
color: C_WB,
anchor: "end",
dx: -6,
dy: -3,
fs: 13.5,
weight: 600,
}));
// Enthalpy values, offset further up-left of the saturation curve so they read
// as the outer oblique enthalpy scale (the classic psychrometric convention).
const ENT_LABELS = [40, 60, 80].map((h) => {
// origin on the saturation curve: solve h_sat(tc) = h by scanning
let originT = 0;
let bestD = Infinity;
for (let tt = X_MIN; tt <= X_MAX; tt += 0.1) {
const hSat = 1.006 * tt + wSat(tt) * (2501 + 1.86 * tt);
const d = Math.abs(hSat - h);
if (d < bestD) {
bestD = d;
originT = tt;
}
}
return {
tc: originT,
w: gkg(wSat(originT)),
text: `${h}`,
color: C_ENT,
anchor: "end",
dx: -16,
dy: -11,
fs: 13.5,
weight: 600,
};
});
// Specific-volume values, placed at each line's lower-right visible end.
const VOL_LABELS = VOL_LEVELS.slice(1).map((v) => {
// last temperature on the grid where the volume line is still inside the box
let endT = X_MAX;
for (let i = temps.length - 1; i >= 0; i--) {
const wg = clip(gkg(wVolume(temps[i], v)), temps[i]);
if (wg != null) {
endT = temps[i];
break;
}
}
return {
tc: endT,
w: clip(gkg(wVolume(endT, v)), endT) ?? 0,
text: `${v.toFixed(2)}`,
color: C_VOL,
anchor: "start",
dx: 5,
dy: 13,
fs: 13,
weight: 600,
};
});
// One green caption sits directly on the saturation curve; the per-family
// colour meanings are clarified by the compact key (see KEY_ITEMS / Overlay).
const SAT_LABEL = {
tc: tempForW(0.96, 25),
w: 25.5,
text: "Saturation · 100% RH",
color: C_SAT,
anchor: "end",
dx: -8,
dy: 0,
fs: 15,
weight: 700,
};
const ALL_LABELS = [...RH_LABELS, ...WB_LABELS, ...ENT_LABELS, ...VOL_LABELS, SAT_LABEL];
// Compact colour key, drawn in the empty upper-left wedge above the saturation
// curve. Each property line is *also* labelled directly with its value on-chart.
const KEY_ITEMS = [
{ color: C_SAT, dash: null, text: "Saturation (100% RH)" },
{ color: C_RH, dash: null, text: "Relative humidity" },
{ color: C_WB, dash: "8 5", text: "Wet-bulb (°C)" },
{ color: C_ENT, dash: "12 4 3 4", text: "Enthalpy (kJ/kg)" },
{ color: C_VOL, dash: "2 5", text: "Specific volume (m³/kg)" },
];
// --- Comfort zone (≈20–26 °C, 30–60 % RH) as a smooth filled polygon --------
const comfortTemps = [];
for (let tc = 20; tc <= 26 + 1e-9; tc += 0.5) comfortTemps.push(tc);
const comfortTop = comfortTemps.map((tc) => ({ tc, w: gkg(wFrac(tc, 0.6)) }));
const comfortBot = comfortTemps.map((tc) => ({ tc, w: gkg(wFrac(tc, 0.3)) })).reverse();
const comfortPoly = [...comfortTop, ...comfortBot];
const comfortCenter = { tc: 23, w: gkg(wFrac(23, 0.45)) };
// --- Example HVAC process: cooling & dehumidification (state 1 → state 2) ----
const P1 = { tc: 30, w: gkg(wFrac(30, 0.5)) };
const P2 = { tc: 14, w: gkg(wFrac(14, 0.9)) };
// X-axis ticks every 5 °C.
const xTicks = temps.filter((tc) => Number.isInteger(tc) && tc % 5 === 0);
// ---------------------------------------------------------------------------
// Overlay drawn inside the chart SVG: comfort zone, process path, direct
// labels and title. Uses the chart scales so everything tracks the axes.
function Overlay() {
const xs = useXScale();
const ys = useYScale();
const area = useDrawingArea();
const px = (d) => xs(d.tc);
const py = (d) => ys(d.w);
const polyPts = comfortPoly.map((d) => `${px(d)},${py(d)}`).join(" ");
// Process arrow geometry (pixel space).
const x1 = px(P1);
const y1 = py(P1);
const x2 = px(P2);
const y2 = py(P2);
const ang = Math.atan2(y2 - y1, x2 - x1);
const ah = 16;
const aw = 8;
const head = [
[x2, y2],
[x2 - ah * Math.cos(ang) + aw * Math.sin(ang), y2 - ah * Math.sin(ang) - aw * Math.cos(ang)],
[x2 - ah * Math.cos(ang) - aw * Math.sin(ang), y2 - ah * Math.sin(ang) + aw * Math.cos(ang)],
]
.map((p) => p.join(","))
.join(" ");
// Colour key anchored in the empty upper-left wedge (data-space top-left).
const keyX = xs(X_MIN) + 14;
const keyY0 = ys(28.5);
const keyDY = 22;
return (
<g>
{/* Colour key */}
{KEY_ITEMS.map((k, i) => {
const ky = keyY0 + i * keyDY;
return (
<g key={`key-${i}`}>
<line
x1={keyX}
y1={ky}
x2={keyX + 30}
y2={ky}
stroke={k.color}
strokeWidth={k.dash ? 2.4 : 3.4}
strokeDasharray={k.dash ?? undefined}
strokeLinecap="round"
/>
<text x={keyX + 38} y={ky + 4.5} fill={INK_SOFT} fontSize={13.5} fontWeight={500} textAnchor="start">
{k.text}
</text>
</g>
);
})}
{/* Comfort zone */}
<polygon points={polyPts} fill={C_SAT} fillOpacity={0.16} stroke={C_SAT} strokeOpacity={0.55} strokeWidth={1.5} strokeDasharray="6 4" />
<text x={xs(comfortCenter.tc)} y={ys(comfortCenter.w)} fill={INK} fontSize={13} fontWeight={700} textAnchor="middle">
Comfort
</text>
<text x={xs(comfortCenter.tc)} y={ys(comfortCenter.w) + 16} fill={INK_SOFT} fontSize={11.5} textAnchor="middle">
20–26 °C · 30–60% RH
</text>
{/* Direct property-line labels */}
{ALL_LABELS.map((l, i) => (
<text
key={i}
x={xs(l.tc) + l.dx}
y={ys(l.w) + l.dy}
fill={l.color}
fontSize={l.fs}
fontWeight={l.weight}
textAnchor={l.anchor}
>
{l.text}
</text>
))}
{/* HVAC process path: cooling & dehumidification */}
<line x1={x1} y1={y1} x2={x2} y2={y2} stroke={C_PROC} strokeWidth={3} strokeLinecap="round" />
<polygon points={head} fill={C_PROC} />
<circle cx={x1} cy={y1} r={5.5} fill={C_PROC} stroke={t.pageBg} strokeWidth={1.5} />
<circle cx={x2} cy={y2} r={5.5} fill={C_PROC} stroke={t.pageBg} strokeWidth={1.5} />
<text x={x1 + 10} y={y1 - 8} fill={C_PROC} fontSize={13} fontWeight={700} textAnchor="start">
1
</text>
<text x={x2 - 10} y={y2 + 18} fill={C_PROC} fontSize={13} fontWeight={700} textAnchor="end">
2
</text>
<text x={(x1 + x2) / 2 + 14} y={(y1 + y2) / 2 - 6} fill={C_PROC} fontSize={12.5} fontWeight={600} textAnchor="start">
Cooling & dehumidification
</text>
{/* Title */}
<text x={area.left + area.width / 2} y={area.top - 26} fill={INK} fontSize={23} fontWeight={700} textAnchor="middle">
psychrometric-basic · javascript · muix · anyplot.ai
</text>
</g>
);
}
// --- Chart (default-exported component — the harness mounts it) -------------
export default function Chart() {
return (
<LineChart
width={SIZE.width}
height={SIZE.height}
margin={{ top: 72, right: 108, bottom: 70, left: 64 }}
skipAnimation
disableAxisListener
series={series}
grid={{ horizontal: true, vertical: true }}
leftAxis={null}
rightAxis="hum"
slotProps={{ legend: { hidden: true }, tooltip: { trigger: "none" } }}
sx={lineSx}
xAxis={[
{
data: temps,
scaleType: "linear",
min: X_MIN,
max: X_MAX,
domainLimit: "strict",
tickInterval: xTicks,
valueFormatter: (v) => `${v}`,
label: "Dry-Bulb Temperature (°C)",
labelStyle: { fontSize: 18, fill: INK, fontWeight: 600 },
tickLabelStyle: { fontSize: 14, fill: INK_SOFT },
},
]}
yAxis={[
{
id: "hum",
min: 0,
max: Y_MAX,
domainLimit: "strict",
tickInterval: [0, 5, 10, 15, 20, 25, 30],
label: "Humidity Ratio (g water / kg dry air)",
labelStyle: { fontSize: 18, fill: INK, fontWeight: 600 },
tickLabelStyle: { fontSize: 14, fill: INK_SOFT },
},
]}
>
<Overlay />
</LineChart>
);
}
Runnable source as JSON, for any HTTP client: https://api.anyplot.ai/specs/psychrometric-basic/muix/code. Any spec id and library id listed in llms-full.txt fit the same URL shape; every URL below is complete and callable.
{
  "spec_id": "psychrometric-basic",
  "language": "javascript",
  "library": "muix",
  "page": "https://anyplot.ai/psychrometric-basic/javascript/muix",
  "hub": "https://anyplot.ai/psychrometric-basic",
  "code_json": "https://api.anyplot.ai/specs/psychrometric-basic/muix/code",
  "spec_json": "https://api.anyplot.ai/specs/psychrometric-basic",
  "render_light_png": "https://storage.googleapis.com/anyplot-images/plots/psychrometric-basic/javascript/muix/plot-light.png",
  "render_dark_png": "https://storage.googleapis.com/anyplot-images/plots/psychrometric-basic/javascript/muix/plot-dark.png",
  "interactive_light_html": "https://storage.googleapis.com/anyplot-images/plots/psychrometric-basic/javascript/muix/plot-light.html",
  "interactive_dark_html": "https://storage.googleapis.com/anyplot-images/plots/psychrometric-basic/javascript/muix/plot-dark.html",
  "quality_score": 90.0,
  "license": "MIT",
  "guide": "https://anyplot.ai/llms.txt"
}
Part of Psychrometric Chart for HVAC on anyplot.ai.