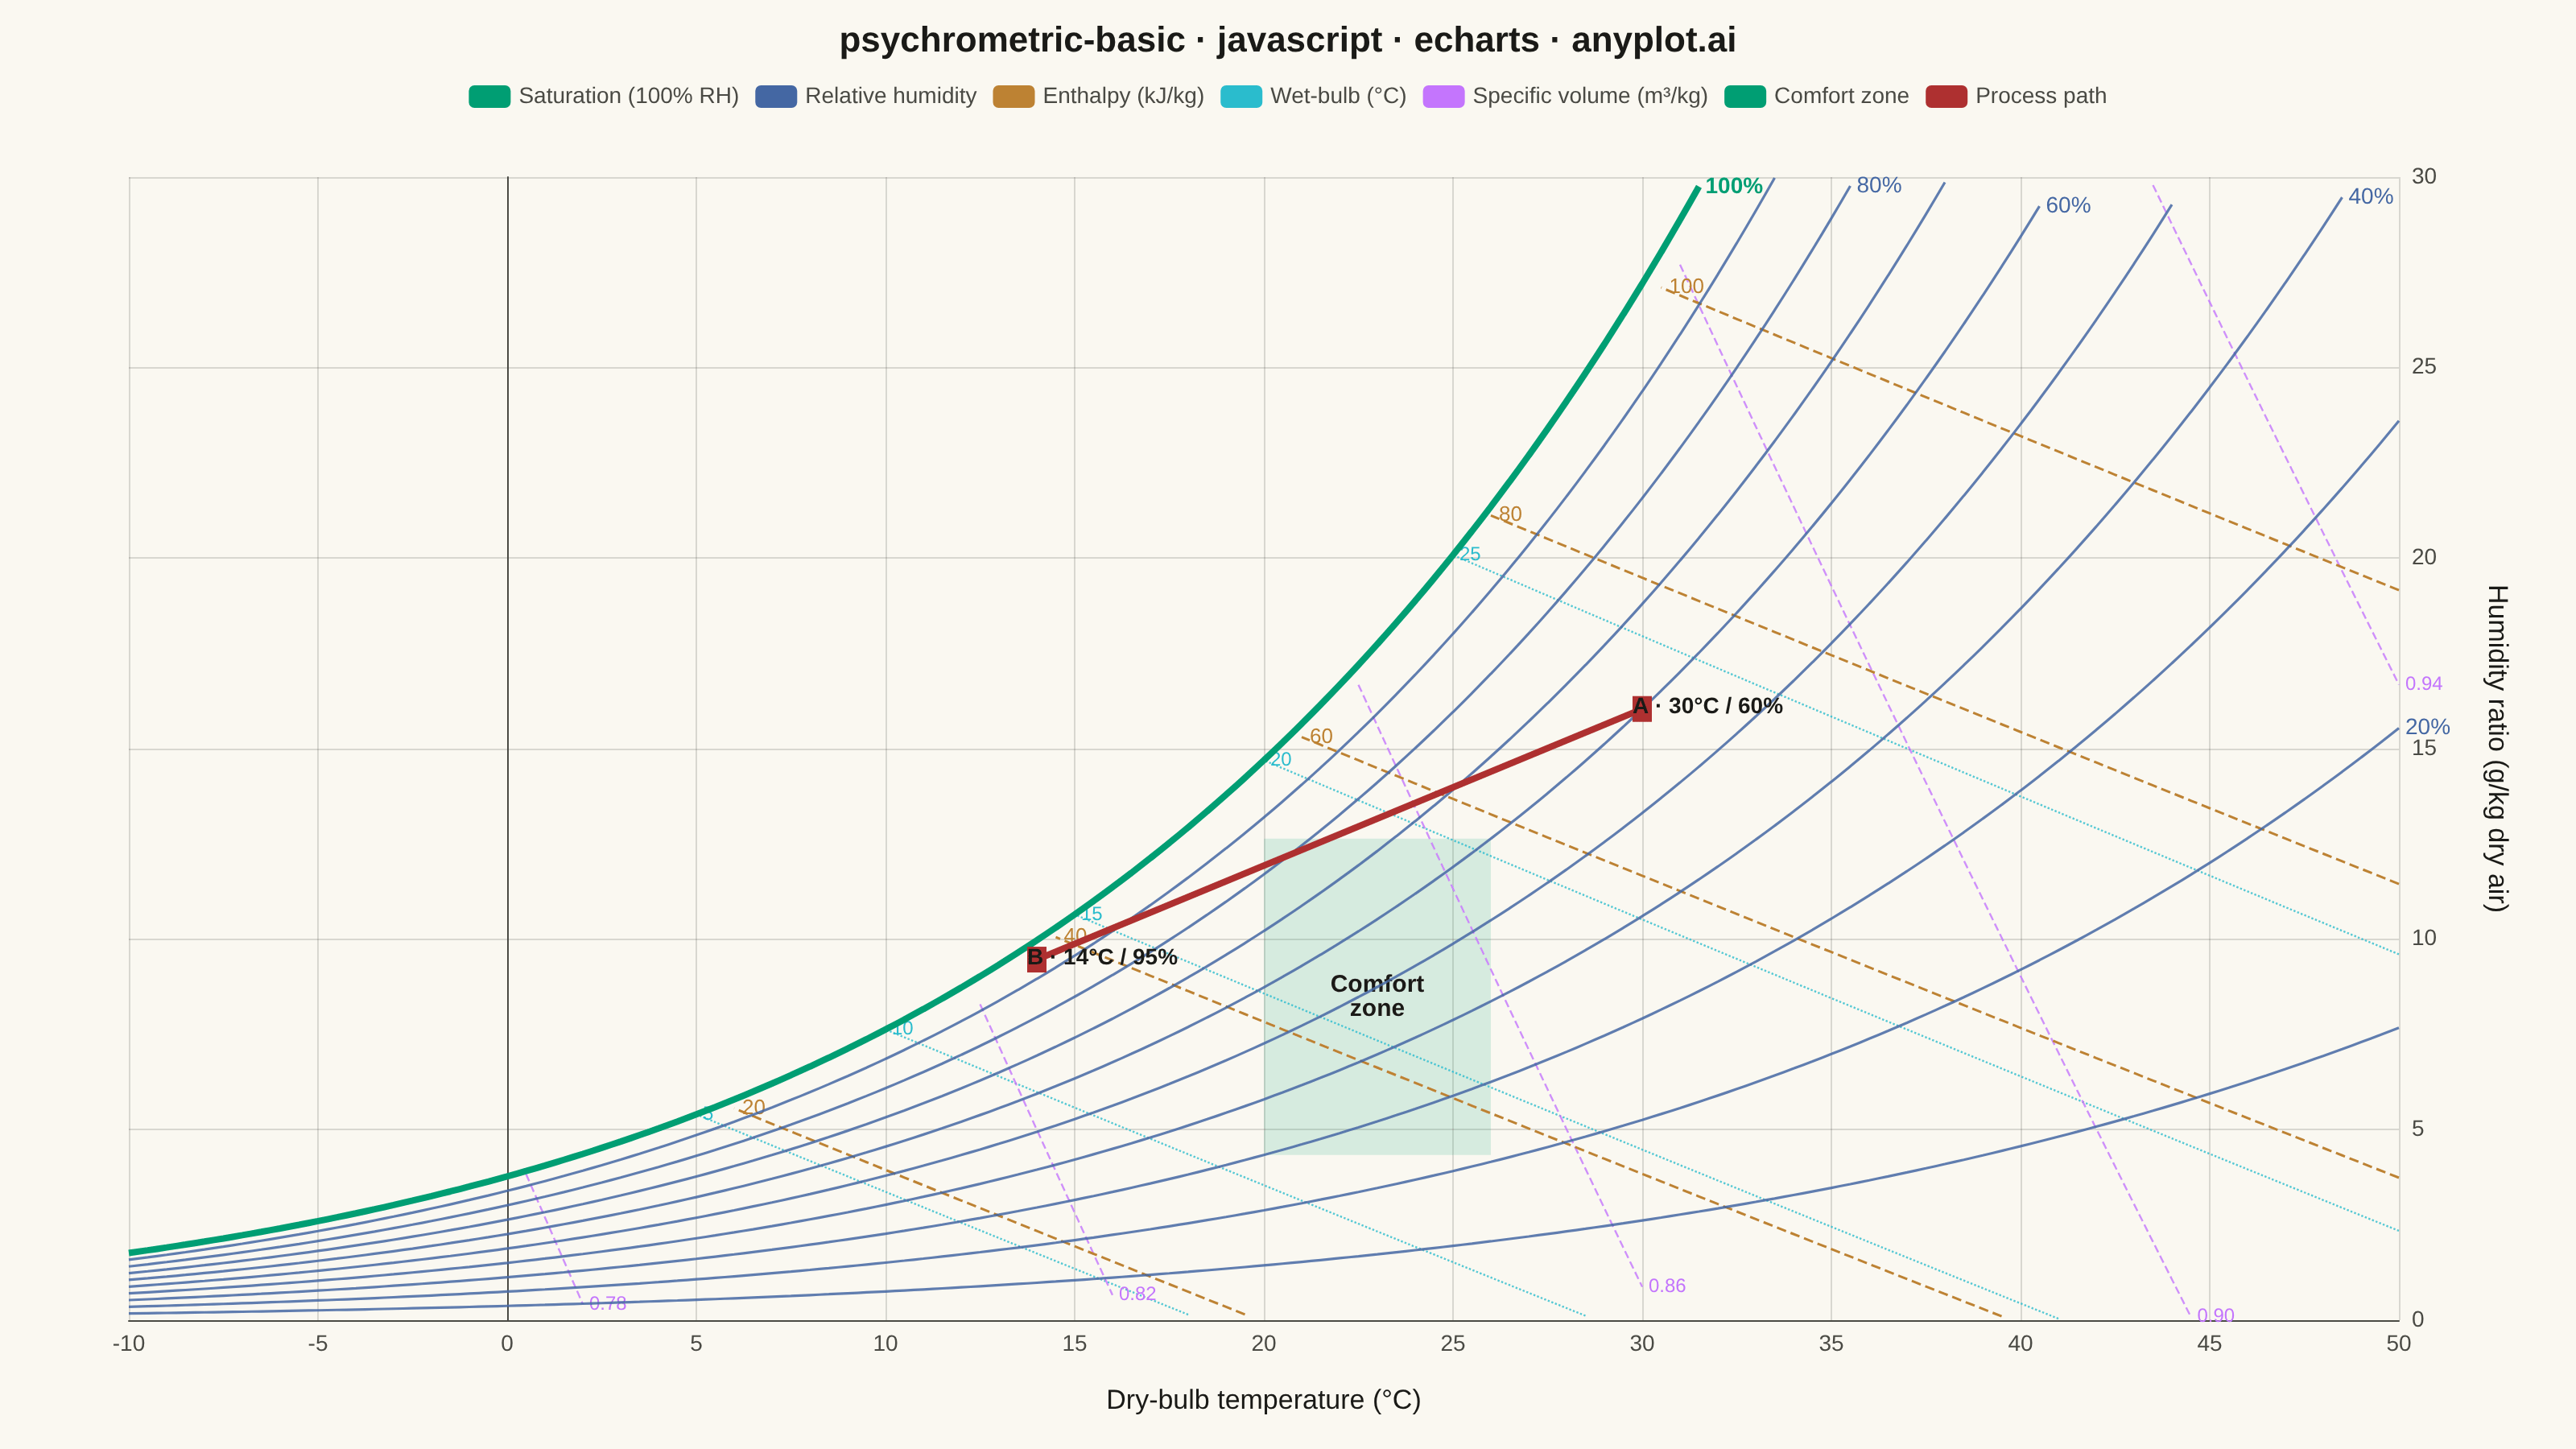
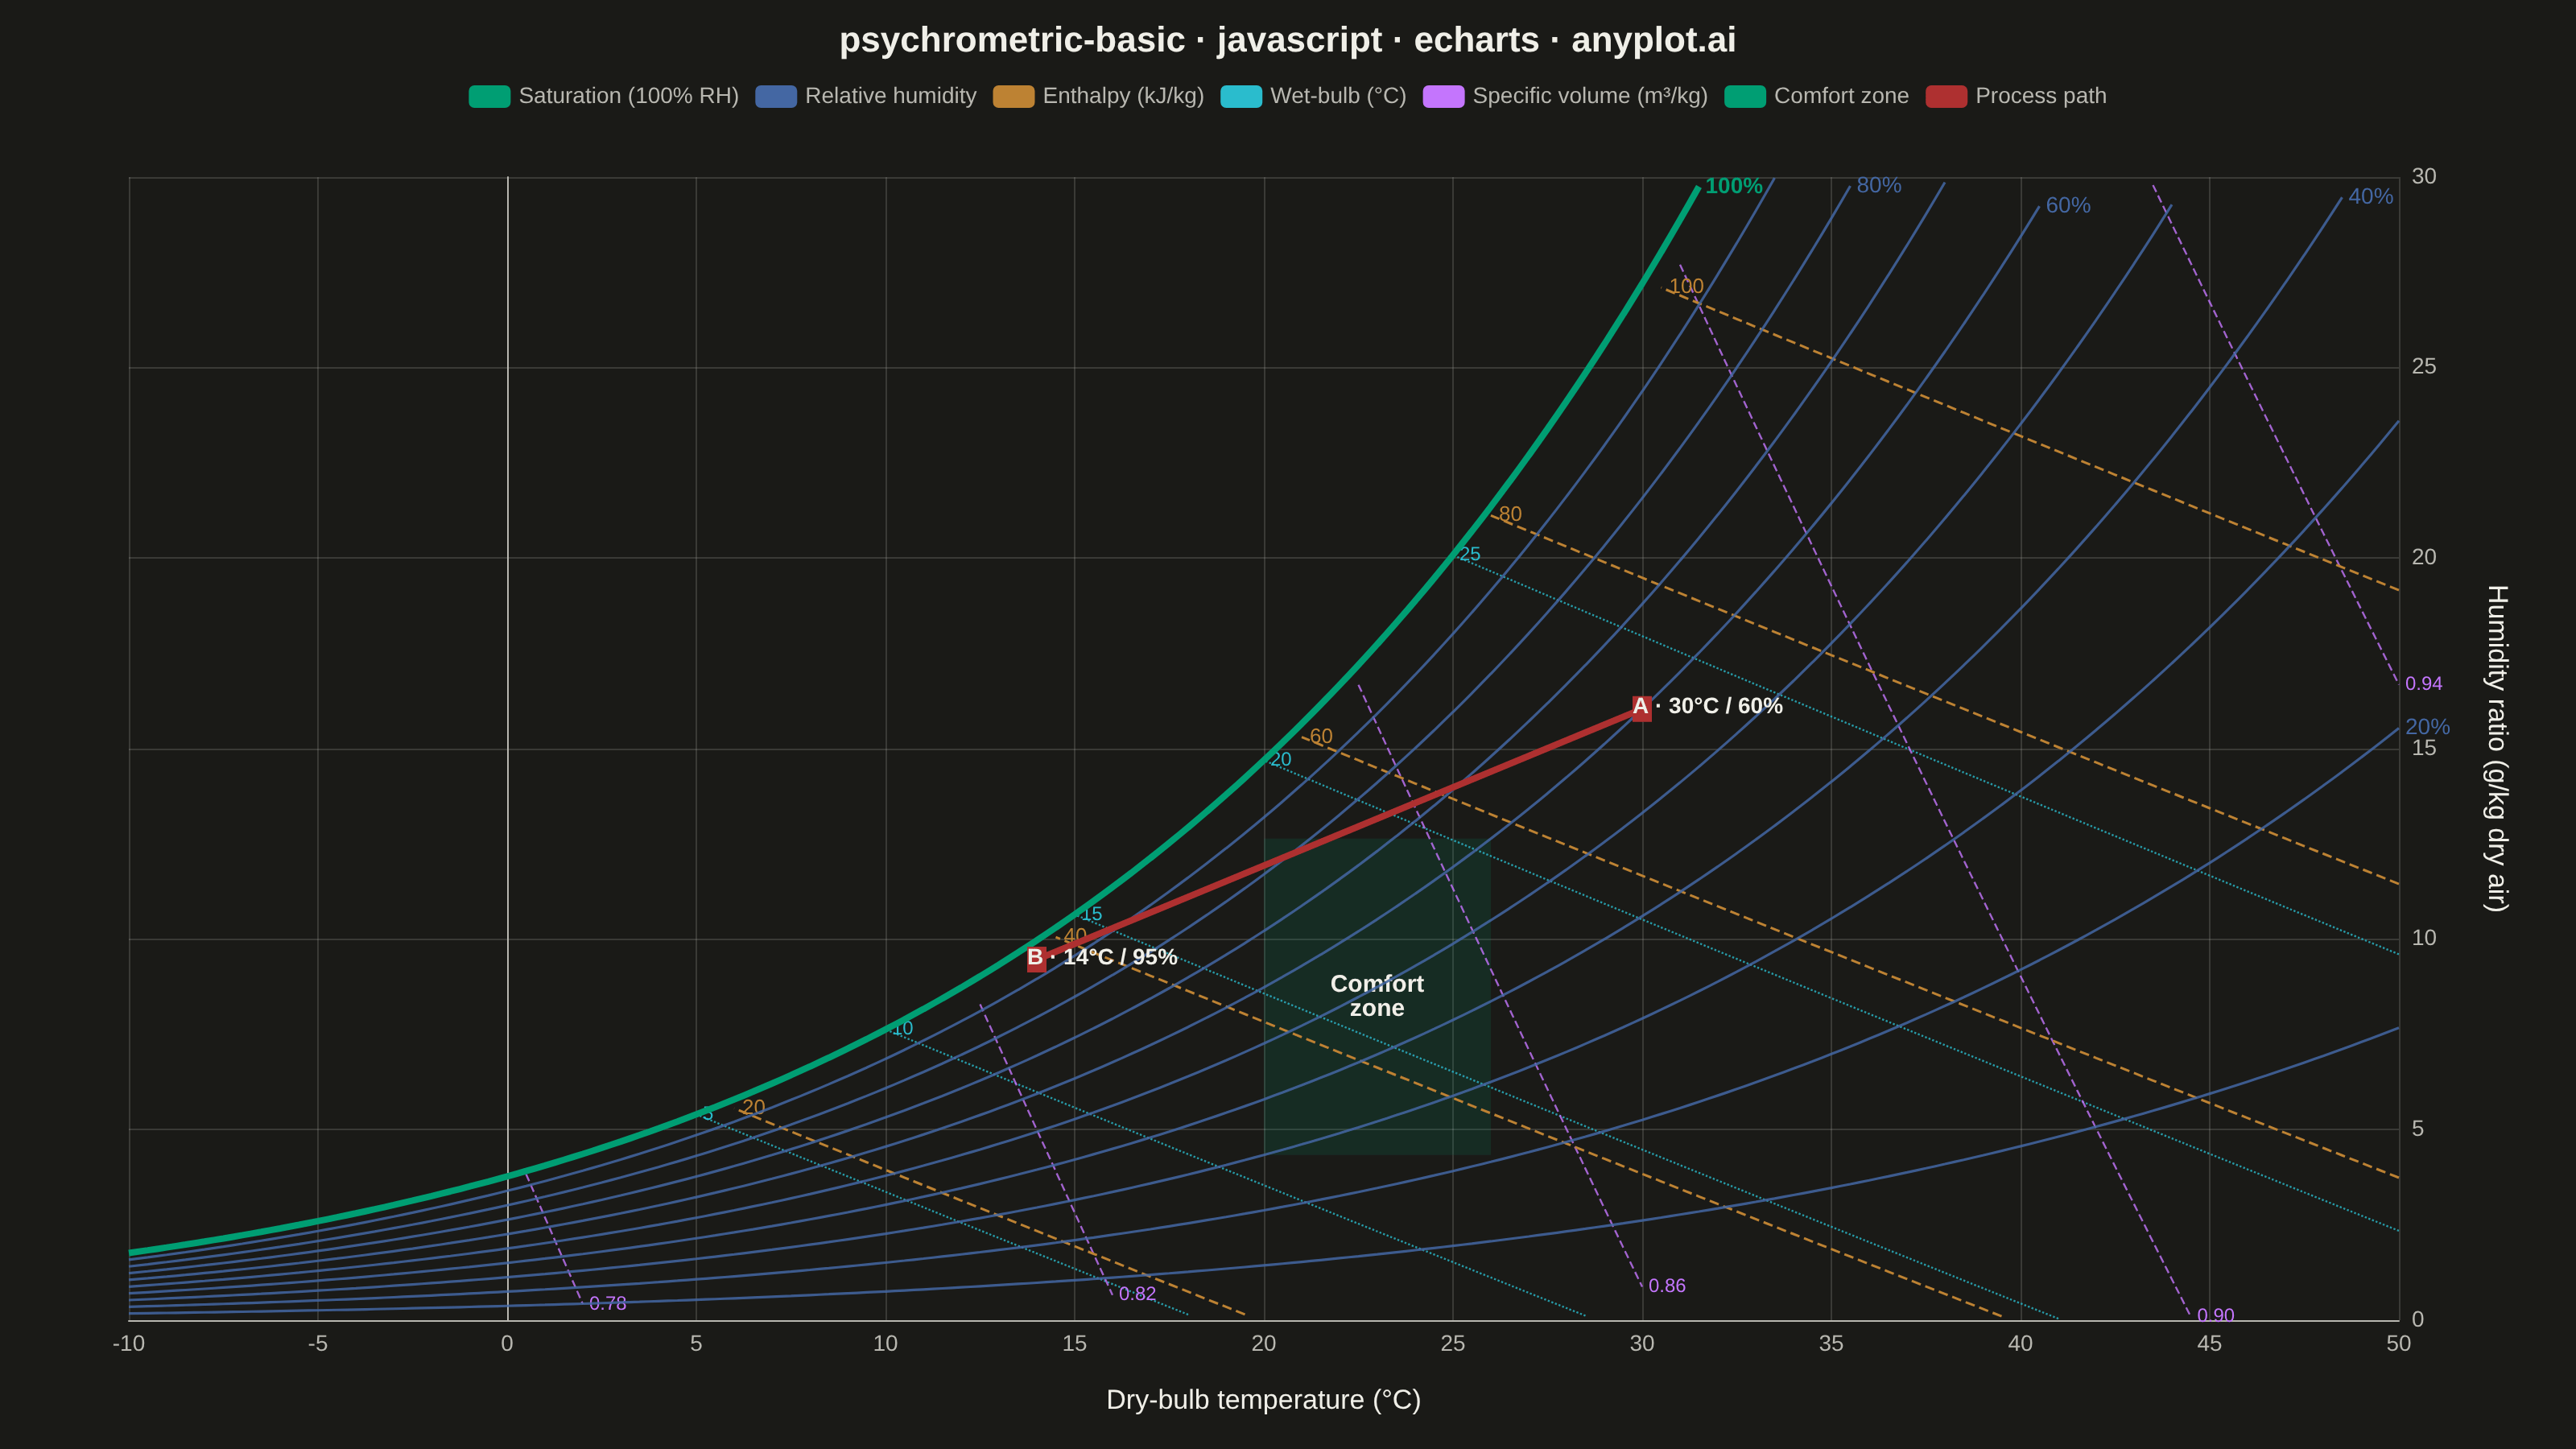
A psychrometric chart plots dry-bulb temperature against humidity ratio, overlaid with curves for relative humidity, wet-bulb temperature, enthalpy, and specific volume. It is the fundamental tool for HVAC system design and air conditioning process analysis. The chart reveals the thermodynamic properties of moist air at a glance, enabling engineers to trace heating, cooling, humidification, and dehumidification processes as paths on the diagram.
// anyplot.ai
// psychrometric-basic: Psychrometric Chart for HVAC
// Library: echarts 5.5.1 | JavaScript 22.22.3
// Quality: 90/100 | Created: 2026-06-16
//# anyplot-orientation: landscape

const t = window.ANYPLOT_TOKENS;

// --- Psychrometric model (ASHRAE, standard sea-level pressure) --------------
const P = 101325; // atmospheric pressure, Pa
const Pk = 101.325; // atmospheric pressure, kPa
const Ra = 0.287042; // gas constant for dry air, kJ/(kg·K)
const T_MIN = -10;
const T_MAX = 50;
const W_MAX = 30; // humidity-ratio ceiling, g/kg dry air

// Saturation vapour pressure over water (Pa), ASHRAE fit, tc in °C.
const pws = (tc) => {
  const T = tc + 273.15;
  return Math.exp(
    -5800.2206 / T +
      1.3914993 -
      0.048640239 * T +
      0.000041764768 * T * T -
      0.000000014452093 * T * T * T +
      6.5459673 * Math.log(T),
  );
};

// Humidity ratio (g/kg dry air) from a vapour partial pressure (Pa).
const wFromPw = (pw) => (1000 * 0.621945 * pw) / (P - pw);

// Saturation humidity ratio (g/kg) at a given dry-bulb temperature.
const wSat = (tc) => wFromPw(pws(tc));

// Humidity ratio (g/kg) at dry-bulb tc and relative humidity rh (0–1).
const wAtRH = (tc, rh) => wFromPw(rh * pws(tc));

// Sample a property line over the dry-bulb range, keeping only points that
// stay inside the chart and below the saturation curve.
const sample = (fromT, wOfT) => {
  const pts = [];
  for (let T = fromT; T <= T_MAX + 1e-9; T += 0.5) {
    const W = wOfT(T);
    if (W >= 0 && W <= W_MAX + 1e-6 && W <= wSat(T) + 0.05) pts.push([T, W]);
  }
  return pts;
};

// Constant relative-humidity curve (10–100 %).
const rhCurve = (rh) => sample(T_MIN, (T) => wAtRH(T, rh));

// Constant-enthalpy line (kJ/kg dry air): h = 1.006·T + W·(2501 + 1.86·T).
const enthalpyCurve = (h) =>
  sample(T_MIN, (T) => (1000 * (h - 1.006 * T)) / (2501 + 1.86 * T));

// Constant specific-volume line (m³/kg dry air).
const volumeCurve = (v) =>
  sample(
    T_MIN,
    (T) => ((v * Pk) / (Ra * (T + 273.15)) - 1) / 1.607858 * 1000,
  );

// Constant wet-bulb line (°C), starting from saturation at tw.
const wetBulbCurve = (tw) => {
  const wsw = wSat(tw) / 1000; // kg/kg at saturation
  return sample(tw, (T) => {
    const Wkg =
      ((2501 - 2.326 * tw) * wsw - 1.006 * (T - tw)) /
      (2501 + 1.86 * T - 4.186 * tw);
    return Wkg * 1000;
  });
};

// --- Build the property-line families ---------------------------------------
const series = [];

// Constant relative-humidity curves: saturation (100 %) is the brand-green
// boundary; the rest are blue. Label every other curve directly on its top end.
const RH_VALUES = [10, 20, 30, 40, 50, 60, 70, 80, 90, 100];
RH_VALUES.forEach((rh) => {
  const saturation = rh === 100;
  const labelled = rh % 20 === 0;
  series.push({
    name: saturation ? "Saturation (100% RH)" : rh === 60 ? "Relative humidity" : undefined,
    type: "line",
    data: rhCurve(rh / 100),
    smooth: true,
    showSymbol: false,
    silent: true,
    z: saturation ? 6 : 3,
    itemStyle: { color: saturation ? t.palette[0] : t.palette[2] },
    lineStyle: {
      color: saturation ? t.palette[0] : t.palette[2],
      width: saturation ? 4 : 1.6,
      opacity: saturation ? 1 : 0.85,
    },
    endLabel: {
      show: labelled,
      formatter: `${rh}%`,
      color: saturation ? t.palette[0] : t.palette[2],
      fontSize: 14,
      fontWeight: saturation ? "bold" : "normal",
      distance: 4,
    },
  });
});

// Constant-enthalpy lines (ochre, dashed), labelled at their upper-left end.
const ENTHALPY_VALUES = [20, 40, 60, 80, 100];
ENTHALPY_VALUES.forEach((h, i) => {
  series.push({
    name: i === 0 ? "Enthalpy (kJ/kg)" : undefined,
    type: "line",
    data: enthalpyCurve(h).reverse(),
    showSymbol: false,
    silent: true,
    z: 2,
    itemStyle: { color: t.palette[3] },
    lineStyle: { color: t.palette[3], width: 1.5, type: "dashed" },
    endLabel: {
      show: true,
      formatter: `${h}`,
      color: t.palette[3],
      fontSize: 13,
      distance: 5,
    },
  });
});

// Constant wet-bulb lines (cyan, dotted, subtle).
const WETBULB_VALUES = [5, 10, 15, 20, 25];
WETBULB_VALUES.forEach((tw, i) => {
  series.push({
    name: i === 0 ? "Wet-bulb (°C)" : undefined,
    type: "line",
    data: wetBulbCurve(tw).reverse(),
    showSymbol: false,
    silent: true,
    z: 1,
    itemStyle: { color: t.palette[5] },
    lineStyle: { color: t.palette[5], width: 1.2, type: "dotted", opacity: 0.8 },
    endLabel: {
      show: true,
      formatter: `${tw}`,
      color: t.palette[5],
      fontSize: 12,
      distance: 4,
    },
  });
});

// Constant specific-volume lines (lavender, dashed), labelled at the bottom end.
const VOLUME_VALUES = [0.78, 0.82, 0.86, 0.9, 0.94];
VOLUME_VALUES.forEach((v, i) => {
  series.push({
    name: i === 0 ? "Specific volume (m³/kg)" : undefined,
    type: "line",
    data: volumeCurve(v),
    showSymbol: false,
    silent: true,
    z: 1,
    itemStyle: { color: t.palette[1] },
    lineStyle: { color: t.palette[1], width: 1.2, type: "dashed", opacity: 0.8 },
    endLabel: {
      show: true,
      formatter: `${v.toFixed(2)}`,
      color: t.palette[1],
      fontSize: 12,
      distance: 4,
    },
  });
});

// --- Comfort zone (20–26 °C, 30–60 % RH) ------------------------------------
const comfortLow = wAtRH(20, 0.3);
const comfortHigh = wAtRH(26, 0.6);
series.push({
  name: "Comfort zone",
  type: "line",
  data: [],
  silent: true,
  z: 4,
  lineStyle: { opacity: 0 },
  itemStyle: { color: t.palette[0] },
  markArea: {
    itemStyle: { color: t.palette[0], opacity: 0.14 },
    label: {
      show: true,
      position: "inside",
      formatter: "Comfort\nzone",
      color: t.ink,
      fontSize: 15,
      fontWeight: "bold",
    },
    data: [
      [
        { xAxis: 20, yAxis: comfortLow },
        { xAxis: 26, yAxis: comfortHigh },
      ],
    ],
  },
});

// --- Example HVAC process: cooling & dehumidification ------------------------
const stateA = [30, wAtRH(30, 0.6)]; // warm, humid return air
const stateB = [14, wAtRH(14, 0.95)]; // cooled, dehumidified supply air
series.push({
  name: "Process path",
  type: "line",
  data: [stateA, stateB],
  z: 7,
  symbol: ["circle", "arrow"],
  symbolSize: [12, 16],
  silent: true,
  lineStyle: { color: t.palette[4], width: 4 },
  itemStyle: { color: t.palette[4] },
  label: {
    show: true,
    color: t.ink,
    fontSize: 14,
    fontWeight: "bold",
    formatter: (p) =>
      p.dataIndex === 0 ? "A · 30°C / 60%" : "B · 14°C / 95%",
    position: (p) => (p.dataIndex === 0 ? "right" : "left"),
  },
});

// --- Init & render ----------------------------------------------------------
const chart = echarts.init(document.getElementById("container"));

chart.setOption({
  animation: false,
  color: t.palette,
  backgroundColor: "transparent",
  title: {
    text: "psychrometric-basic · javascript · echarts · anyplot.ai",
    left: "center",
    top: 10,
    textStyle: { color: t.ink, fontSize: 22 },
  },
  legend: {
    top: 48,
    left: "center",
    textStyle: { color: t.inkSoft, fontSize: 14 },
    itemWidth: 26,
    icon: "roundRect",
    data: [
      "Saturation (100% RH)",
      "Relative humidity",
      "Enthalpy (kJ/kg)",
      "Wet-bulb (°C)",
      "Specific volume (m³/kg)",
      "Comfort zone",
      "Process path",
    ],
  },
  grid: { left: 80, right: 110, top: 110, bottom: 80 },
  xAxis: {
    type: "value",
    name: "Dry-bulb temperature (°C)",
    nameLocation: "middle",
    nameGap: 42,
    nameTextStyle: { color: t.ink, fontSize: 17 },
    min: T_MIN,
    max: T_MAX,
    interval: 5,
    axisLabel: { color: t.inkSoft, fontSize: 14 },
    axisLine: { lineStyle: { color: t.inkSoft } },
    axisTick: { show: false },
    splitLine: { lineStyle: { color: t.grid } },
  },
  yAxis: {
    type: "value",
    position: "right",
    name: "Humidity ratio (g/kg dry air)",
    nameLocation: "middle",
    nameGap: 52,
    nameRotate: -90,
    nameTextStyle: { color: t.ink, fontSize: 17 },
    min: 0,
    max: W_MAX,
    interval: 5,
    axisLabel: { color: t.inkSoft, fontSize: 14 },
    axisLine: { show: true, lineStyle: { color: t.inkSoft } },
    axisTick: { show: false },
    splitLine: { lineStyle: { color: t.grid } },
  },
  series,
});
Runnable source as JSON, for any HTTP client: https://api.anyplot.ai/specs/psychrometric-basic/echarts/code. Any spec id and library id listed in llms-full.txt fit the same URL shape; every URL below is complete and callable.
{
  "spec_id": "psychrometric-basic",
  "language": "javascript",
  "library": "echarts",
  "page": "https://anyplot.ai/psychrometric-basic/javascript/echarts",
  "hub": "https://anyplot.ai/psychrometric-basic",
  "code_json": "https://api.anyplot.ai/specs/psychrometric-basic/echarts/code",
  "spec_json": "https://api.anyplot.ai/specs/psychrometric-basic",
  "render_light_png": "https://storage.googleapis.com/anyplot-images/plots/psychrometric-basic/javascript/echarts/plot-light.png",
  "render_dark_png": "https://storage.googleapis.com/anyplot-images/plots/psychrometric-basic/javascript/echarts/plot-dark.png",
  "interactive_light_html": "https://storage.googleapis.com/anyplot-images/plots/psychrometric-basic/javascript/echarts/plot-light.html",
  "interactive_dark_html": "https://storage.googleapis.com/anyplot-images/plots/psychrometric-basic/javascript/echarts/plot-dark.html",
  "quality_score": 90.0,
  "license": "MIT",
  "guide": "https://anyplot.ai/llms.txt"
}
Part of Psychrometric Chart for HVAC on anyplot.ai.