The same plot in 14 other libraries — JavaScript: D3.js, Apache ECharts, Highcharts, MUI X Charts; Python: Altair, Bokeh, lets-plot, Matplotlib, Plotly, plotnine, Pygal, Seaborn; R: ggplot2; Julia: Makie.jl. Compare all 15 side by side: Basic Quiver Plot in Python, R, Julia and JavaScript.
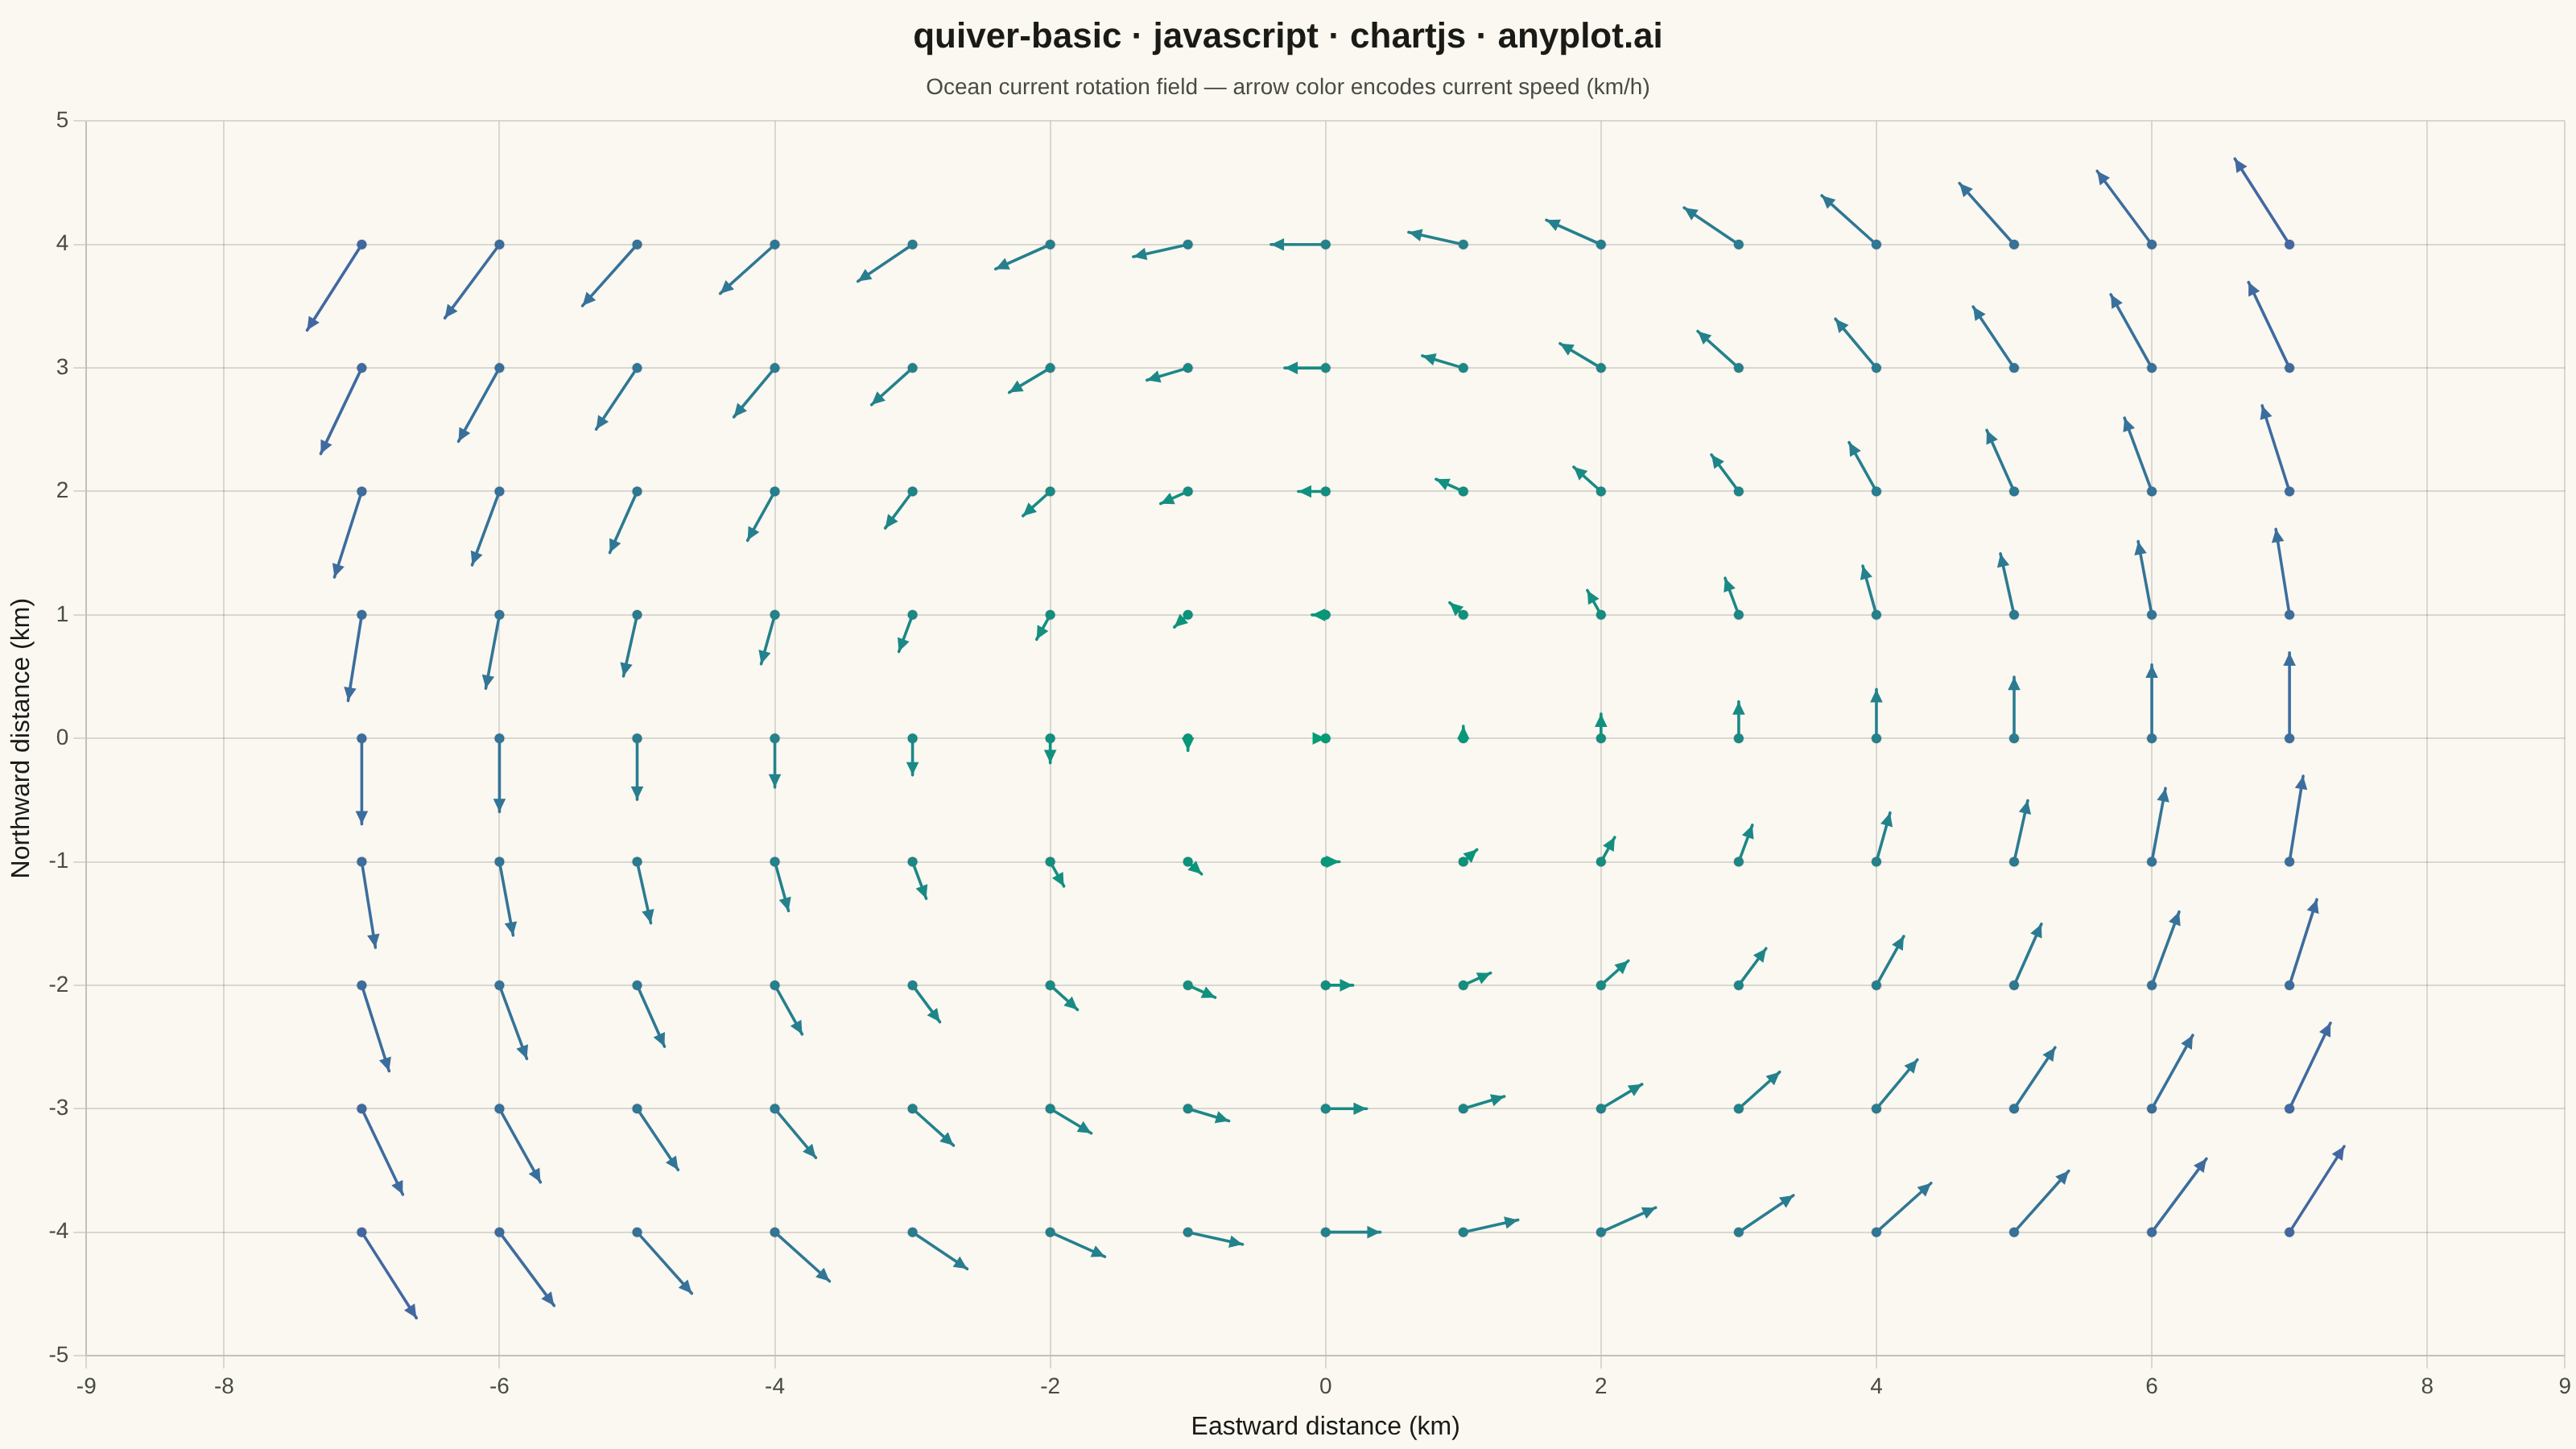
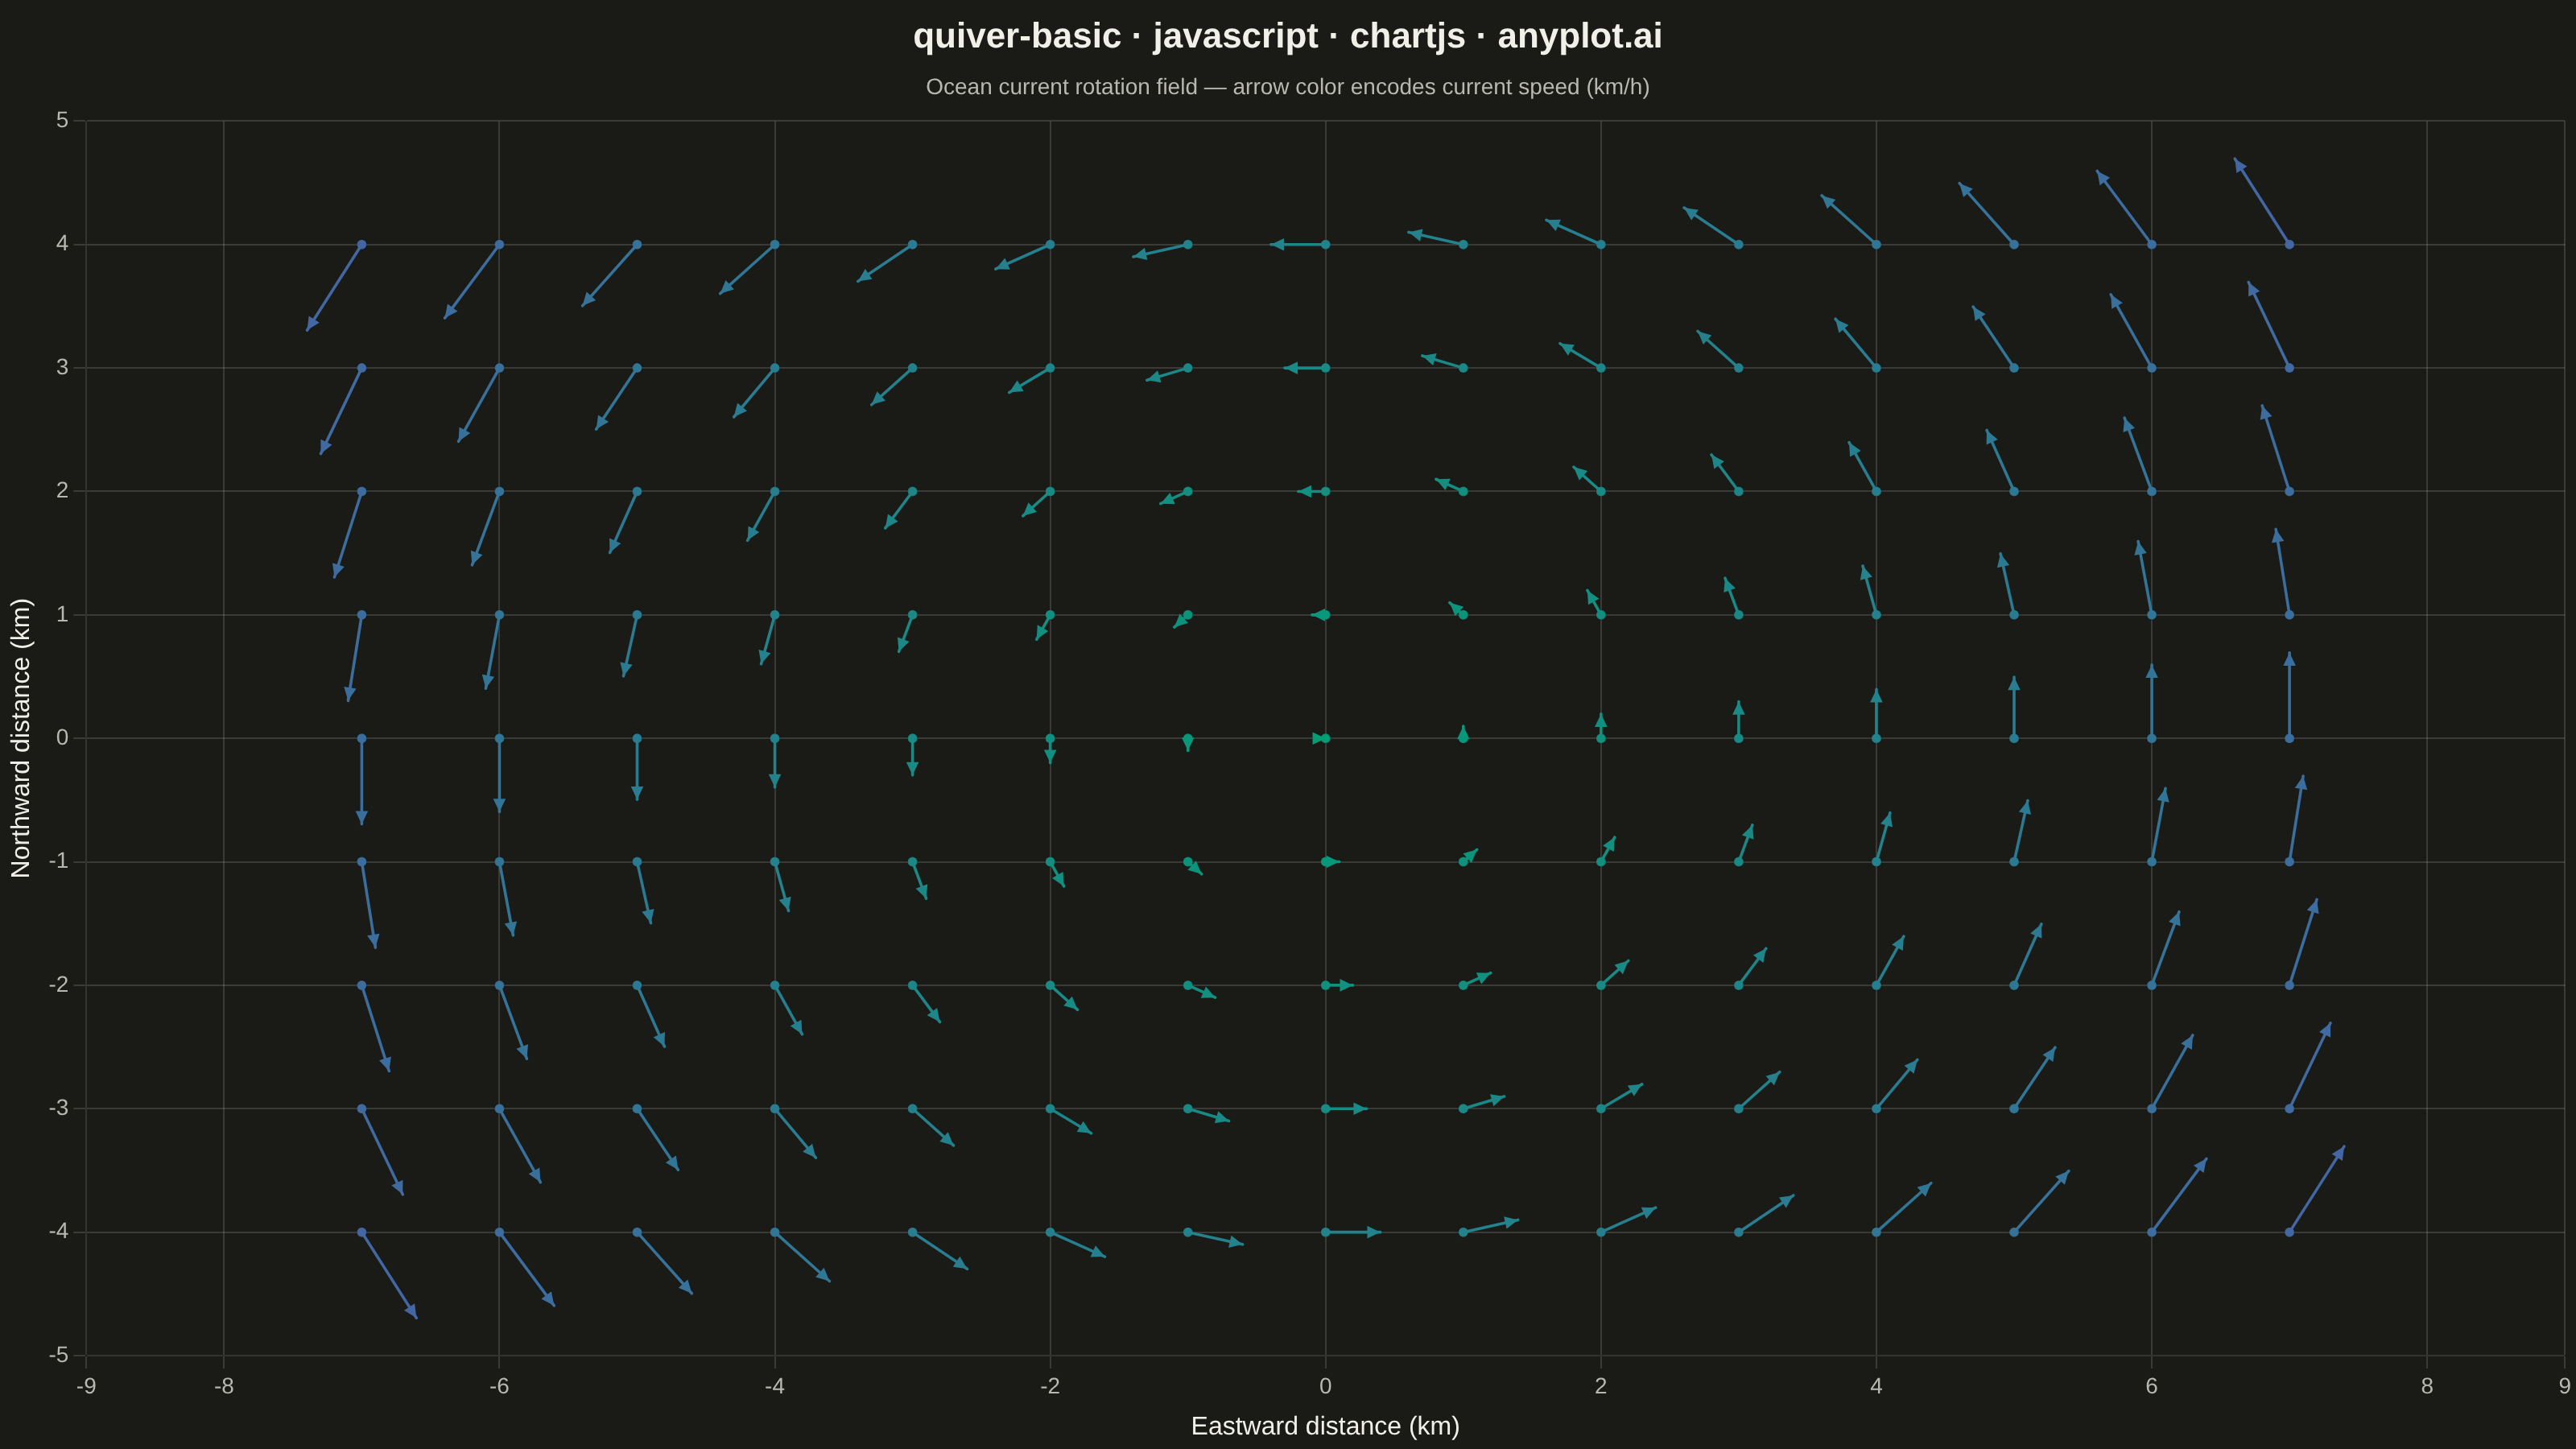
A quiver plot displays vector fields using arrows positioned at grid points. Each arrow represents a vector at that location, with direction indicating the vector's angle and length proportional to its magnitude. This visualization reveals flow patterns, gradients, and field structure in two-dimensional data.
// anyplot.ai
// quiver-basic: Basic Quiver Plot
// Library: chartjs 4.4.7 | JavaScript 22.23.1
// Quality: 91/100 | Created: 2026-07-24

const t = window.ANYPLOT_TOKENS;

// --- Data: circular ocean-current rotation field, u = -y, v = x ------------
// (rigid rotation: |velocity| = sqrt(u^2+v^2) = distance from the eddy center)
const X_MIN = -7,
  X_MAX = 7,
  X_STEP = 1;
const Y_MIN = -4,
  Y_MAX = 4,
  Y_STEP = 1;

const vectors = [];
for (let y = Y_MIN; y <= Y_MAX; y += Y_STEP) {
  for (let x = X_MIN; x <= X_MAX; x += X_STEP) {
    const u = -y; // eastward current component (km/h)
    const v = x; // northward current component (km/h)
    vectors.push({ x, y, u, v, mag: Math.sqrt(u * u + v * v) });
  }
}

const maxMag = Math.max(...vectors.map((p) => p.mag));
const ARROW_SCALE = 0.8 / maxMag; // longest arrow spans 0.8 grid units, avoids overlap

function hexToRgb(hex) {
  const n = parseInt(hex.slice(1), 16);
  return [(n >> 16) & 255, (n >> 8) & 255, n & 255];
}
function lerpColor(hexA, hexB, f) {
  const a = hexToRgb(hexA);
  const b = hexToRgb(hexB);
  const c = a.map((channel, i) => Math.round(channel + (b[i] - channel) * f));
  return `rgb(${c[0]}, ${c[1]}, ${c[2]})`;
}

// Color encodes current speed via the Imprint sequential scale (single-polarity).
vectors.forEach((p) => {
  p.color = lerpColor(t.seq[0], t.seq[1], p.mag / maxMag);
});

// --- Mount -------------------------------------------------------------------
const canvas = document.createElement("canvas");
document.getElementById("container").appendChild(canvas);

// --- Arrow-drawing plugin (native Chart.js plugin API, no community deps) ---
const quiverArrowsPlugin = {
  id: "quiverArrows",
  afterDatasetsDraw(chart) {
    const { ctx, scales } = chart;
    const xScale = scales.x;
    const yScale = scales.y;
    const headLen = 9; // px, screen space

    ctx.save();
    vectors.forEach((p) => {
      const tailX = xScale.getPixelForValue(p.x);
      const tailY = yScale.getPixelForValue(p.y);
      const tipX = xScale.getPixelForValue(p.x + p.u * ARROW_SCALE);
      const tipY = yScale.getPixelForValue(p.y + p.v * ARROW_SCALE);
      const angle = Math.atan2(tipY - tailY, tipX - tailX);

      ctx.strokeStyle = p.color;
      ctx.fillStyle = p.color;
      ctx.lineWidth = 1.8;
      ctx.lineCap = "round";

      ctx.beginPath();
      ctx.moveTo(tailX, tailY);
      ctx.lineTo(tipX, tipY);
      ctx.stroke();

      ctx.beginPath();
      ctx.moveTo(tipX, tipY);
      ctx.lineTo(
        tipX - headLen * Math.cos(angle - Math.PI / 7),
        tipY - headLen * Math.sin(angle - Math.PI / 7),
      );
      ctx.lineTo(
        tipX - headLen * Math.cos(angle + Math.PI / 7),
        tipY - headLen * Math.sin(angle + Math.PI / 7),
      );
      ctx.closePath();
      ctx.fill();
    });
    ctx.restore();
  },
};

// --- Chart ---------------------------------------------------------------
new Chart(canvas, {
  type: "scatter",
  data: {
    datasets: [
      {
        label: "Grid points",
        data: vectors.map((p) => ({ x: p.x, y: p.y })),
        backgroundColor: vectors.map((p) => p.color),
        pointRadius: 3,
        pointHoverRadius: 3,
        showLine: false,
      },
    ],
  },
  options: {
    responsive: true,
    maintainAspectRatio: false,
    animation: false,
    plugins: {
      title: {
        display: true,
        text: "quiver-basic · javascript · chartjs · anyplot.ai",
        color: t.ink,
        font: { size: 22 },
      },
      subtitle: {
        display: true,
        text: "Ocean current rotation field — arrow color encodes current speed (km/h)",
        color: t.inkSoft,
        font: { size: 14 },
        padding: { bottom: 12 },
      },
      legend: { display: false },
    },
    scales: {
      x: {
        min: -9,
        max: 9,
        ticks: { color: t.inkSoft, font: { size: 14 } },
        grid: { color: t.grid },
        title: {
          display: true,
          text: "Eastward distance (km)",
          color: t.ink,
          font: { size: 16 },
        },
      },
      y: {
        min: -5,
        max: 5,
        ticks: { color: t.inkSoft, font: { size: 14 } },
        grid: { color: t.grid },
        title: {
          display: true,
          text: "Northward distance (km)",
          color: t.ink,
          font: { size: 16 },
        },
      },
    },
  },
  plugins: [quiverArrowsPlugin],
});
Runnable source as JSON, for any HTTP client: https://api.anyplot.ai/specs/quiver-basic/chartjs/code. Any spec id and library id listed in llms-full.txt fit the same URL shape; every URL below is complete and callable.
{
  "spec_id": "quiver-basic",
  "language": "javascript",
  "library": "chartjs",
  "page": "https://anyplot.ai/quiver-basic/javascript/chartjs",
  "hub": "https://anyplot.ai/quiver-basic",
  "code_json": "https://api.anyplot.ai/specs/quiver-basic/chartjs/code",
  "spec_json": "https://api.anyplot.ai/specs/quiver-basic",
  "render_light_png": "https://storage.googleapis.com/anyplot-images/plots/quiver-basic/javascript/chartjs/plot-light.png",
  "render_dark_png": "https://storage.googleapis.com/anyplot-images/plots/quiver-basic/javascript/chartjs/plot-dark.png",
  "interactive_light_html": "https://storage.googleapis.com/anyplot-images/plots/quiver-basic/javascript/chartjs/plot-light.html",
  "interactive_dark_html": "https://storage.googleapis.com/anyplot-images/plots/quiver-basic/javascript/chartjs/plot-dark.html",
  "quality_score": 91.0,
  "license": "MIT",
  "guide": "https://anyplot.ai/llms.txt"
}
Part of Basic Quiver Plot on anyplot.ai.