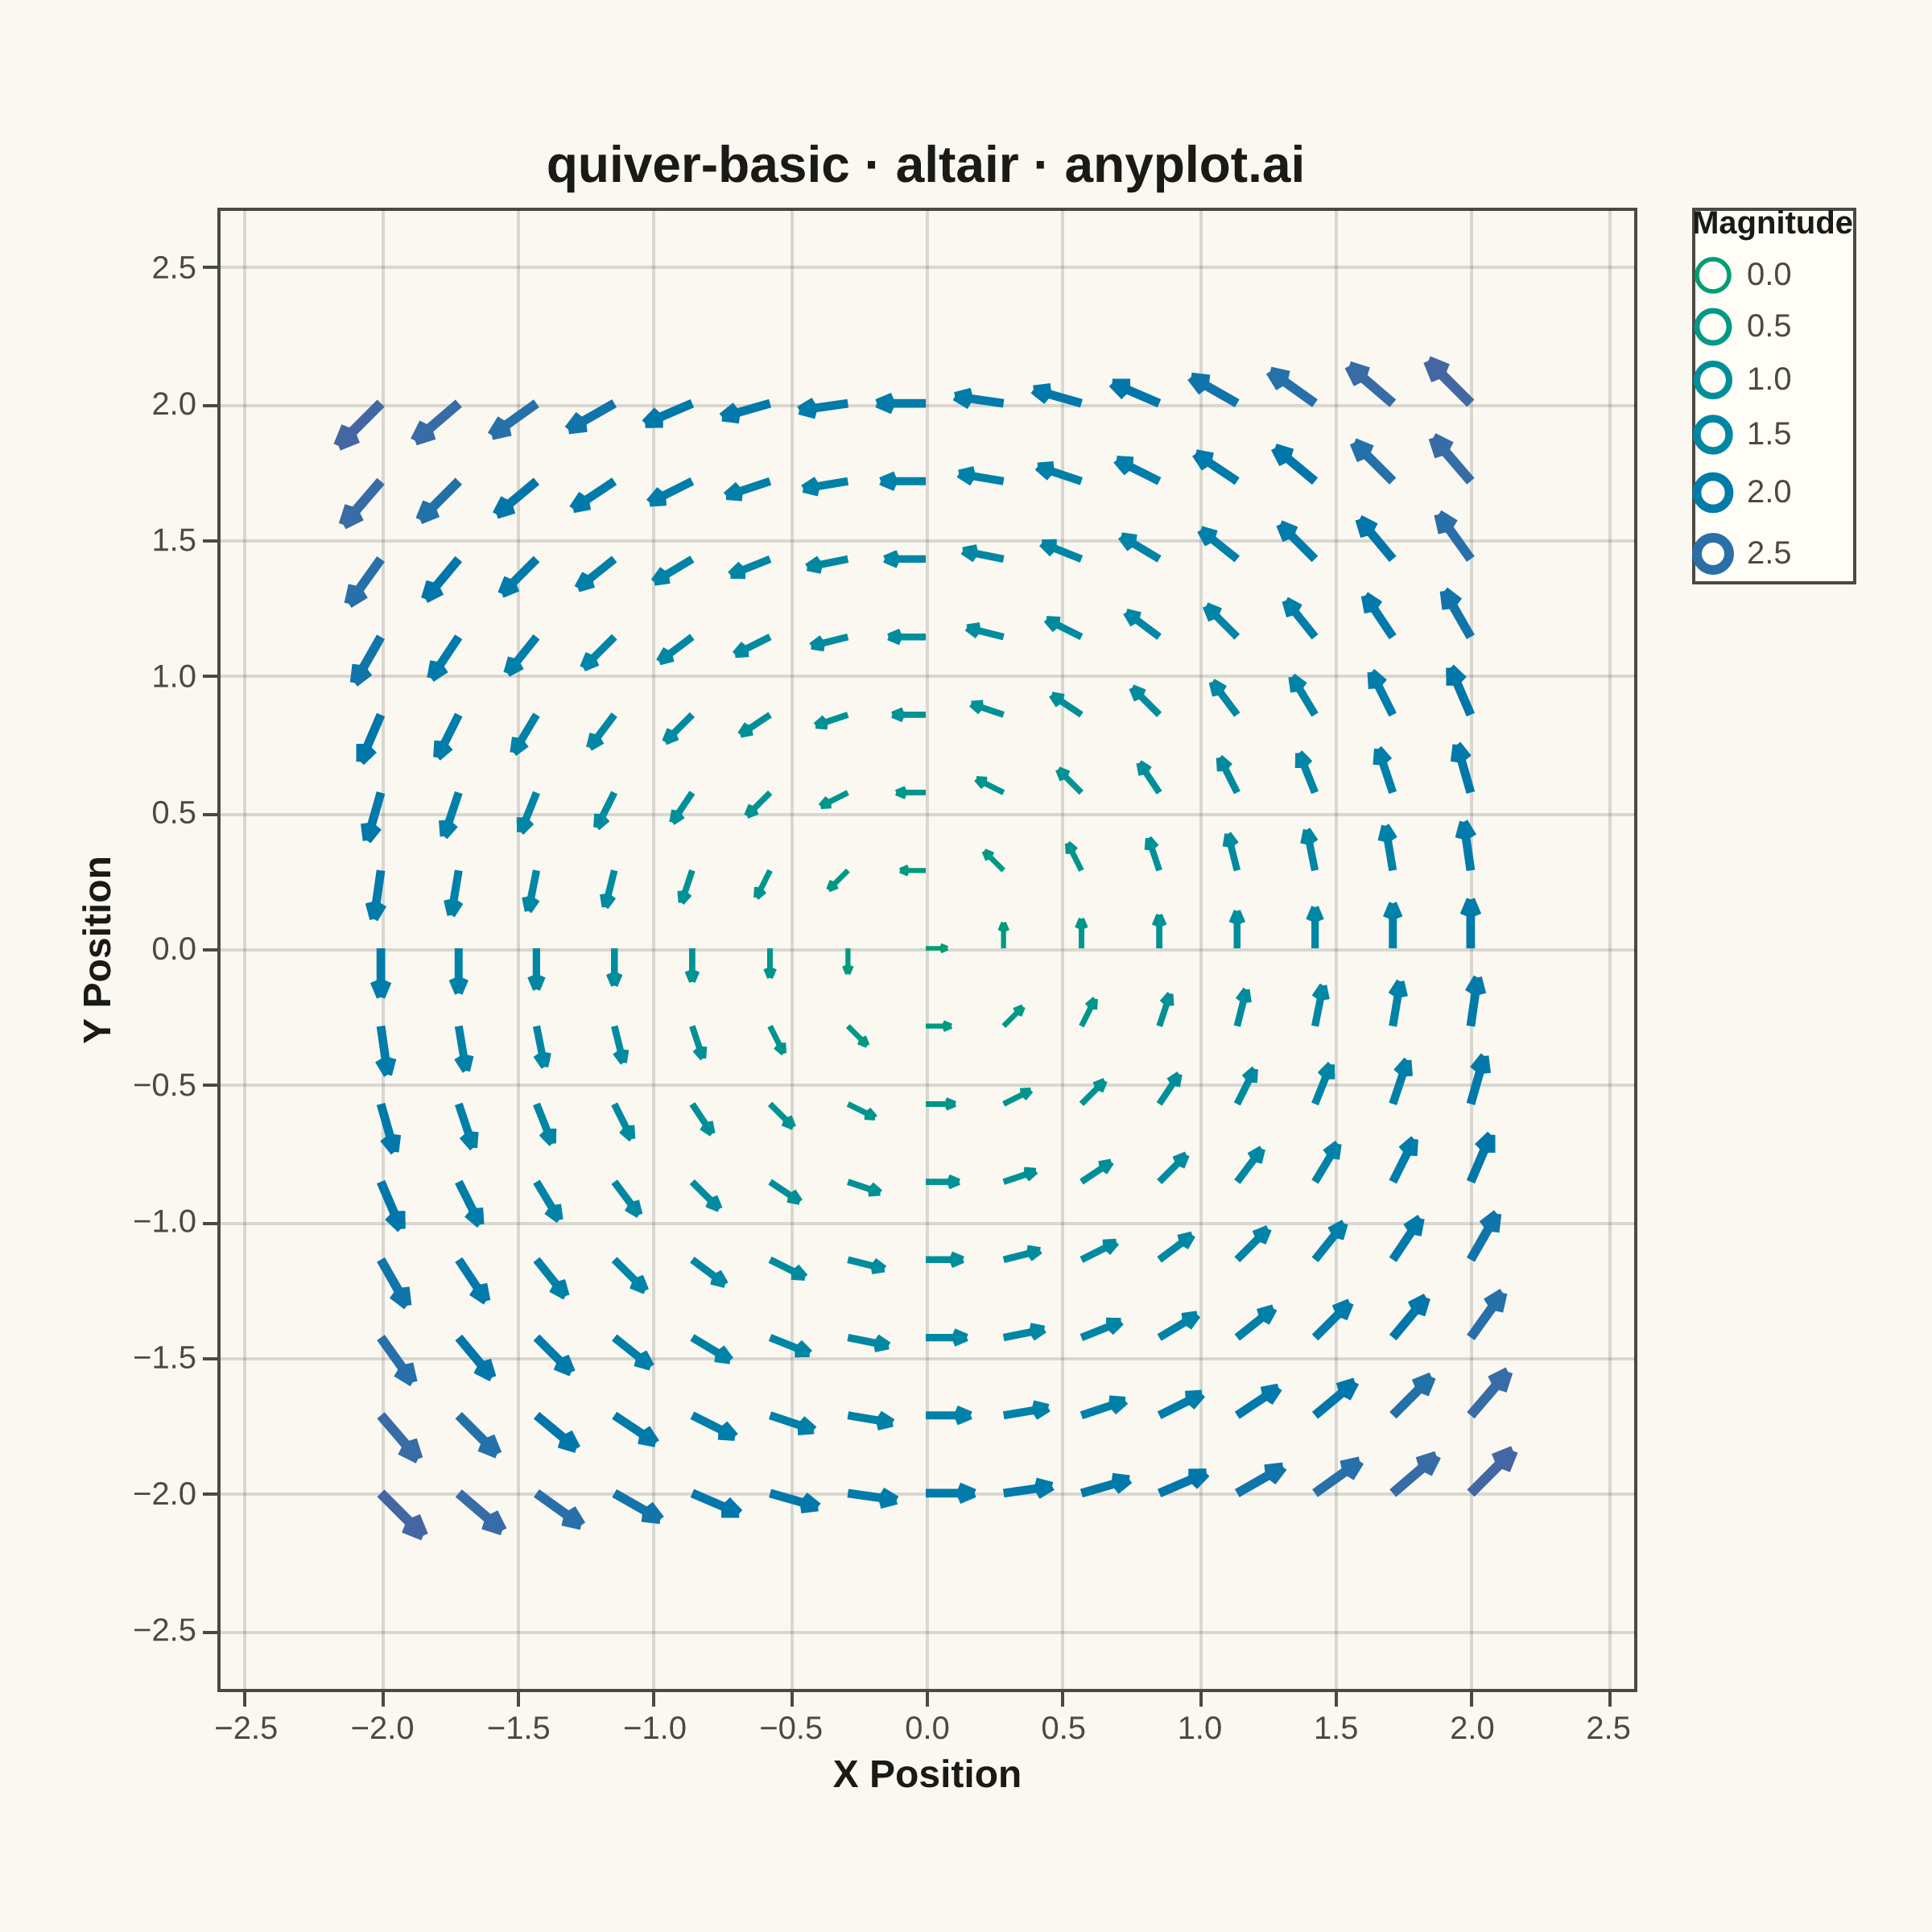
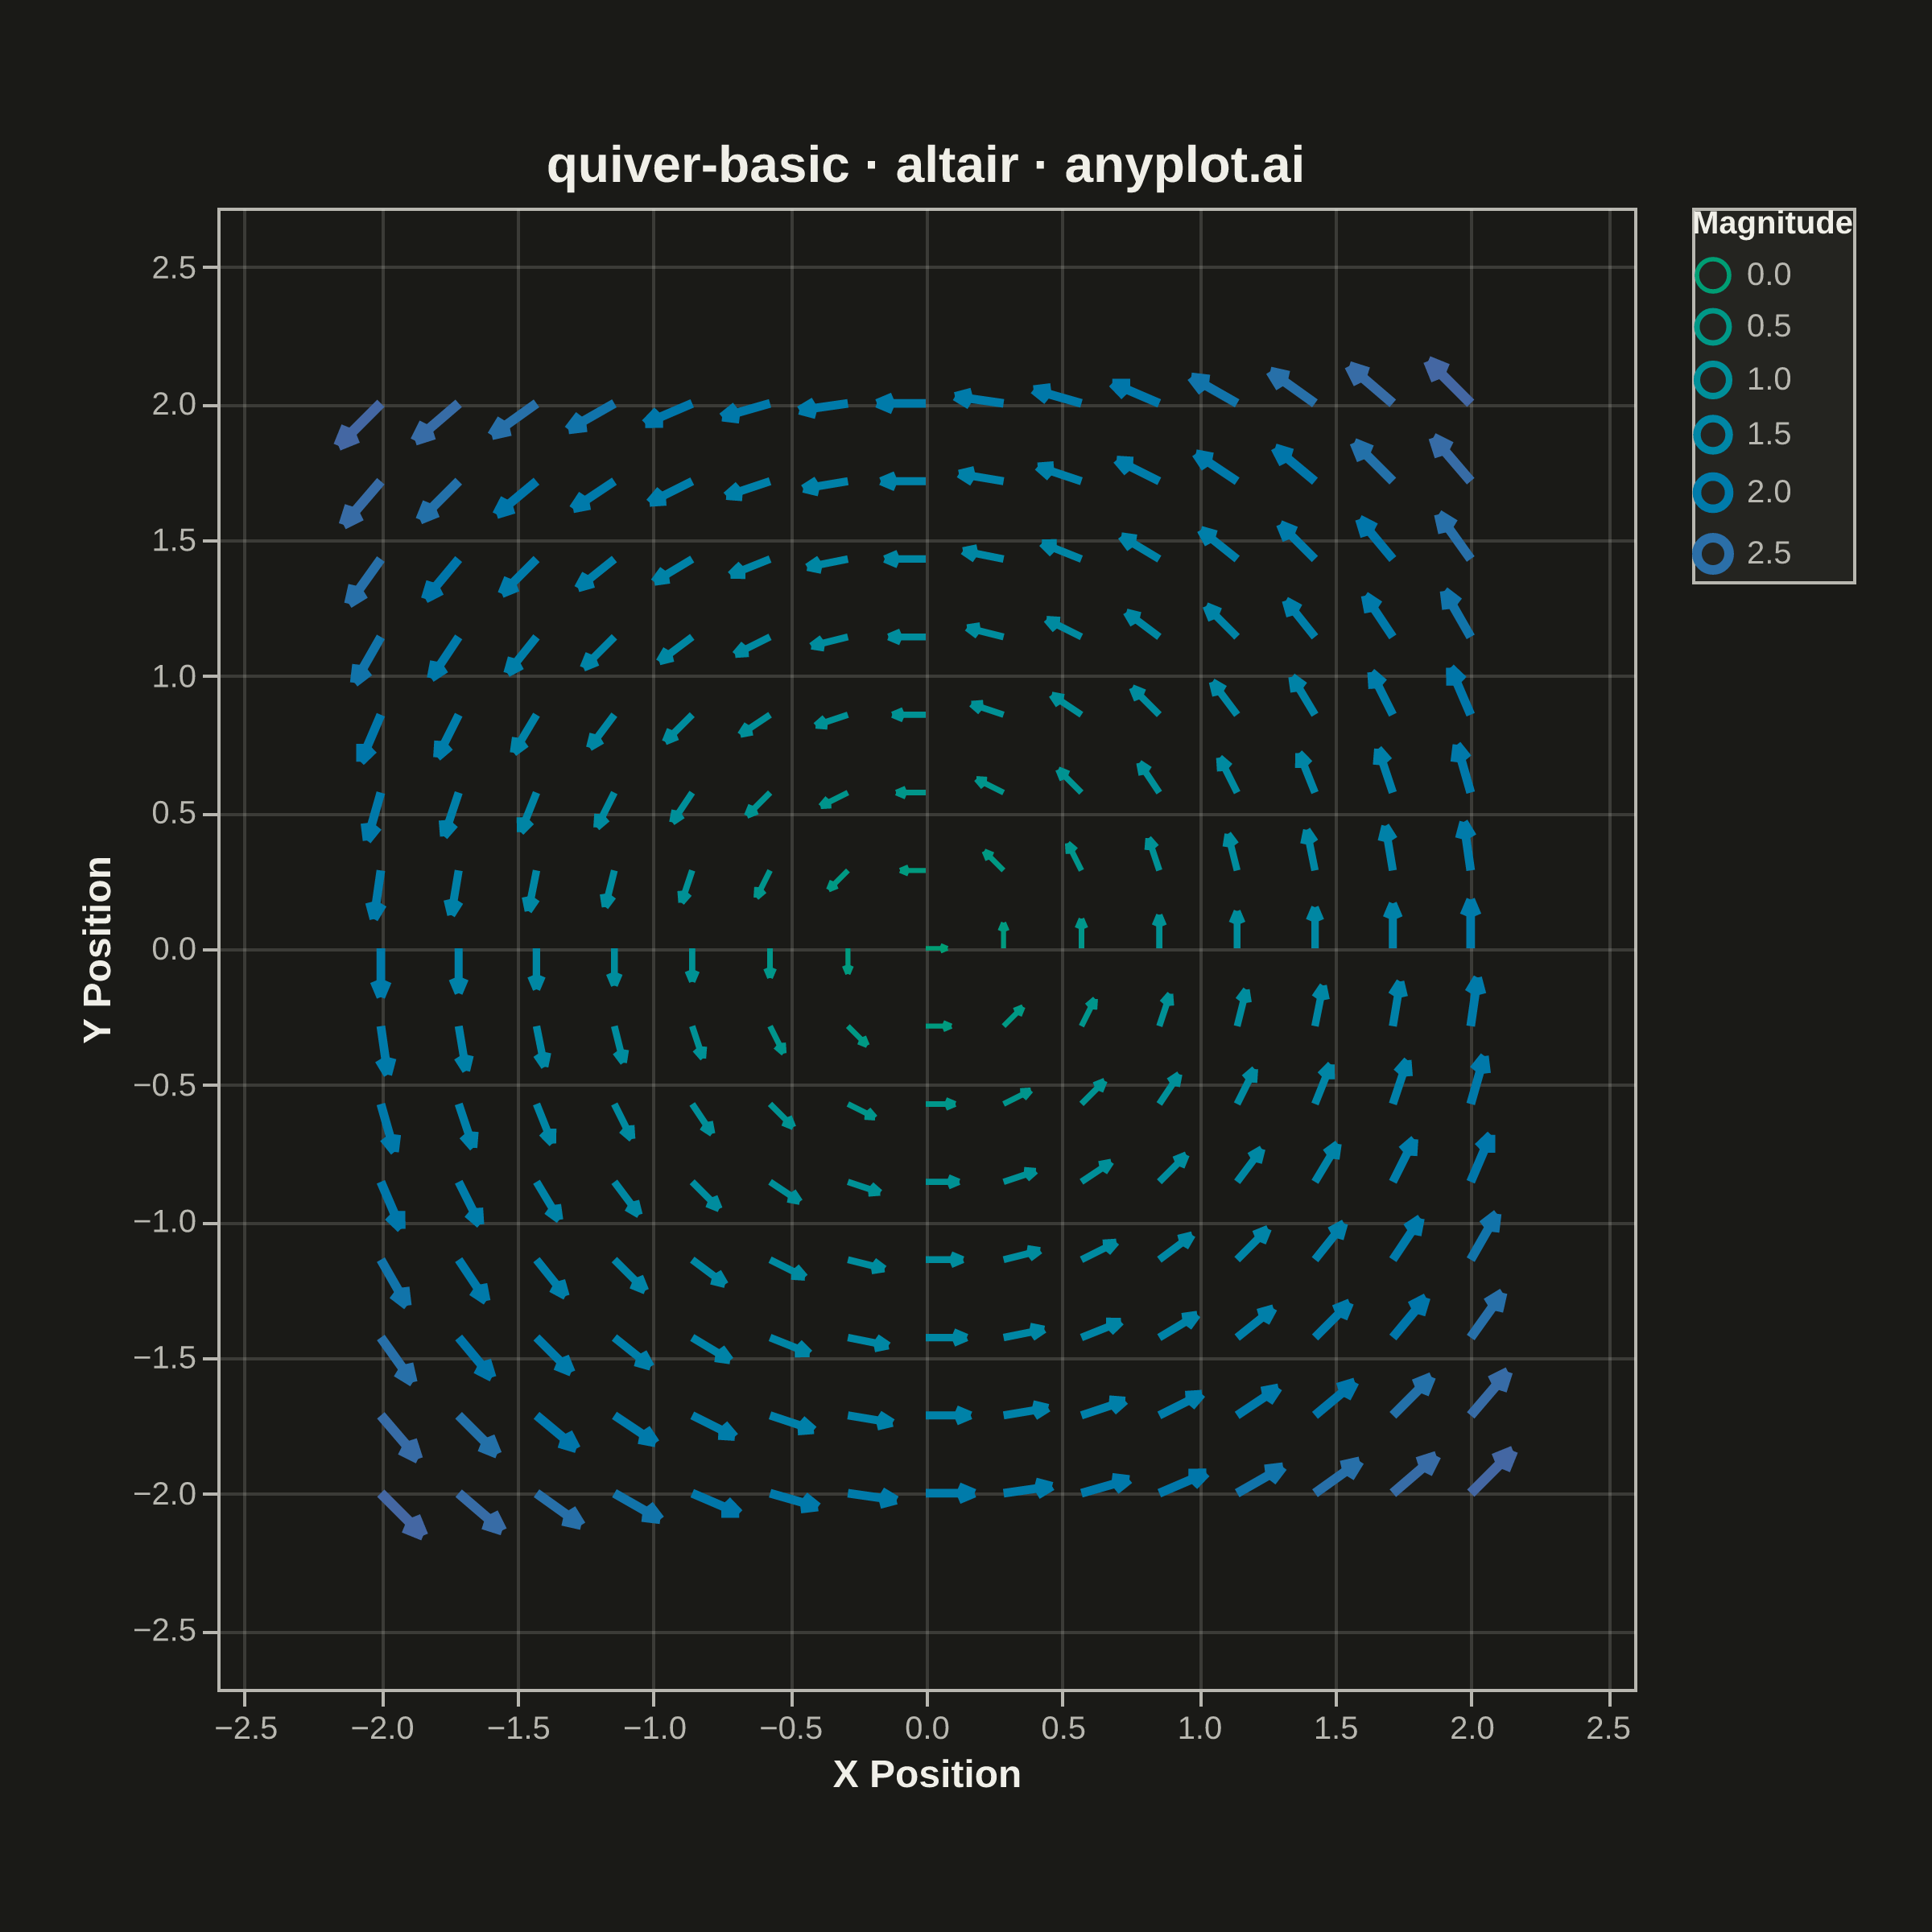
A quiver plot displays vector fields using arrows positioned at grid points. Each arrow represents a vector at that location, with direction indicating the vector's angle and length proportional to its magnitude. This visualization reveals flow patterns, gradients, and field structure in two-dimensional data.
""" anyplot.ai
quiver-basic: Basic Quiver Plot
Library: altair 6.2.2 | Python 3.13.14
Quality: 85/100 | Updated: 2026-07-24
"""

import os

import altair as alt
import numpy as np
import pandas as pd
from PIL import Image


# Theme tokens
THEME = os.getenv("ANYPLOT_THEME", "light")
PAGE_BG = "#FAF8F1" if THEME == "light" else "#1A1A17"
ELEVATED_BG = "#FFFDF6" if THEME == "light" else "#242420"
INK = "#1A1A17" if THEME == "light" else "#F0EFE8"
INK_SOFT = "#4A4A44" if THEME == "light" else "#B8B7B0"

# Canvas — square inner view; vl-convert pads title/axis/legend outside width/height
VIEW_W, VIEW_H = 440, 460
TARGET_W, TARGET_H = 2400, 2400

# Data - 15x15 grid with circular rotation field (u = -y, v = x)
np.random.seed(42)
grid_size = 15
x_range = np.linspace(-2, 2, grid_size)
y_range = np.linspace(-2, 2, grid_size)
X, Y = np.meshgrid(x_range, y_range)
x_flat = X.flatten()
y_flat = Y.flatten()

# Circular rotation field: u = -y, v = x
U = -y_flat
V = x_flat
magnitude = np.sqrt(U**2 + V**2)

# Unit direction (defaults to +x for the single zero-magnitude point at the origin)
safe_magnitude = np.where(magnitude > 0, magnitude, 1.0)
unit_u = np.where(magnitude > 0, U / safe_magnitude, 1.0)
unit_v = np.where(magnitude > 0, V / safe_magnitude, 0.0)

# Rescale arrow length into [MIN_LEN, MAX_LEN] so low-magnitude arrows near the
# origin stay visible instead of shrinking to an imperceptible dot
MIN_LEN, MAX_LEN = 0.08, 0.22
magnitude_norm = magnitude / magnitude.max()
display_length = MIN_LEN + magnitude_norm * (MAX_LEN - MIN_LEN)
U_scaled = unit_u * display_length
V_scaled = unit_v * display_length

# Arrow tip positions
x2 = x_flat + U_scaled
y2 = y_flat + V_scaled

# Arrowhead geometry — size proportional to arrow length for visual coherence
angle = np.arctan2(V_scaled, U_scaled)
head_size = np.maximum(display_length * 0.35, 0.02)

# Vectorized construction of shaft + two arrowhead lines per arrow
shaft = pd.DataFrame({"x": x_flat, "y": y_flat, "x2": x2, "y2": y2, "magnitude": magnitude})
left = pd.DataFrame(
    {
        "x": x2,
        "y": y2,
        "x2": x2 - head_size * np.cos(angle - 0.4),
        "y2": y2 - head_size * np.sin(angle - 0.4),
        "magnitude": magnitude,
    }
)
right = pd.DataFrame(
    {
        "x": x2,
        "y": y2,
        "x2": x2 - head_size * np.cos(angle + 0.4),
        "y2": y2 - head_size * np.sin(angle + 0.4),
        "magnitude": magnitude,
    }
)
arrow_df = pd.concat([shaft, left, right], ignore_index=True)

# Equal-scale square domain (matches VIEW_W:VIEW_H so the rotation field renders
# as a true circle, not an ellipse) with margin for the longest arrow tip
x_half = 2.6
y_half = x_half * VIEW_H / VIEW_W

# Chart — rule marks encode vectors; Imprint sequential scale encodes magnitude,
# stroke width adds a secondary emphasis cue for the strongest vectors
chart = (
    alt.Chart(arrow_df)
    .mark_rule()
    .encode(
        x=alt.X("x:Q", title="X Position", scale=alt.Scale(domain=[-x_half, x_half])),
        y=alt.Y("y:Q", title="Y Position", scale=alt.Scale(domain=[-y_half, y_half])),
        x2="x2:Q",
        y2="y2:Q",
        color=alt.Color(
            "magnitude:Q",
            scale=alt.Scale(range=["#009E73", "#4467A3"]),
            title="Magnitude",
            legend=alt.Legend(titleFontSize=10, labelFontSize=10),
        ),
        strokeWidth=alt.StrokeWidth("magnitude:Q", scale=alt.Scale(range=[1.4, 3.2]), legend=None),
        tooltip=[
            alt.Tooltip("x:Q", title="X", format=".2f"),
            alt.Tooltip("y:Q", title="Y", format=".2f"),
            alt.Tooltip("magnitude:Q", title="Magnitude", format=".2f"),
        ],
    )
    .properties(
        width=VIEW_W,
        height=VIEW_H,
        background=PAGE_BG,
        title=alt.Title("quiver-basic · altair · anyplot.ai", fontSize=16, anchor="middle"),
    )
    .configure_view(fill=PAGE_BG, stroke=None)
    .configure_axis(
        labelFontSize=10,
        titleFontSize=12,
        labelColor=INK_SOFT,
        titleColor=INK,
        domainColor=INK_SOFT,
        tickColor=INK_SOFT,
        gridColor=INK,
        gridOpacity=0.15,
    )
    .configure_title(color=INK)
    .configure_legend(fillColor=ELEVATED_BG, strokeColor=INK_SOFT, labelColor=INK_SOFT, titleColor=INK)
)

chart.save(f"plot-{THEME}.png", scale_factor=4.0)

# PAD-only to exact target canvas — vl-convert pads title/legend outside width/
# height, so the saved PNG is never exactly (VIEW_W*scale, VIEW_H*scale)
_img = Image.open(f"plot-{THEME}.png").convert("RGB")
_w, _h = _img.size
if _w > TARGET_W or _h > TARGET_H:
    raise SystemExit(
        f"altair vl-convert produced {_w}x{_h}, exceeds target {TARGET_W}x{TARGET_H}. "
        f"Shrink chart .properties(width=, height=) values and re-render."
    )
if _w < TARGET_W or _h < TARGET_H:
    _canvas = Image.new("RGB", (TARGET_W, TARGET_H), PAGE_BG)
    _canvas.paste(_img, ((TARGET_W - _w) // 2, (TARGET_H - _h) // 2))
    _canvas.save(f"plot-{THEME}.png")

chart.save(f"plot-{THEME}.html")
Runnable source as JSON, for any HTTP client: https://api.anyplot.ai/specs/quiver-basic/altair/code. Any spec id and library id listed in llms-full.txt fit the same URL shape; every URL below is complete and callable.
{
  "spec_id": "quiver-basic",
  "language": "python",
  "library": "altair",
  "page": "https://anyplot.ai/quiver-basic/python/altair",
  "hub": "https://anyplot.ai/quiver-basic",
  "code_json": "https://api.anyplot.ai/specs/quiver-basic/altair/code",
  "spec_json": "https://api.anyplot.ai/specs/quiver-basic",
  "render_light_png": "https://storage.googleapis.com/anyplot-images/plots/quiver-basic/python/altair/plot-light.png",
  "render_dark_png": "https://storage.googleapis.com/anyplot-images/plots/quiver-basic/python/altair/plot-dark.png",
  "interactive_light_html": "https://storage.googleapis.com/anyplot-images/plots/quiver-basic/python/altair/plot-light.html",
  "interactive_dark_html": "https://storage.googleapis.com/anyplot-images/plots/quiver-basic/python/altair/plot-dark.html",
  "quality_score": 85.0,
  "license": "MIT",
  "guide": "https://anyplot.ai/llms.txt"
}
Part of Basic Quiver Plot on anyplot.ai.