The same plot in 14 other libraries — JavaScript: Chart.js, D3.js, Apache ECharts, MUI X Charts; Python: Altair, Bokeh, lets-plot, Matplotlib, Plotly, plotnine, Pygal, Seaborn; R: ggplot2; Julia: Makie.jl. Compare all 15 side by side: Basic Quiver Plot in Python, R, Julia and JavaScript.
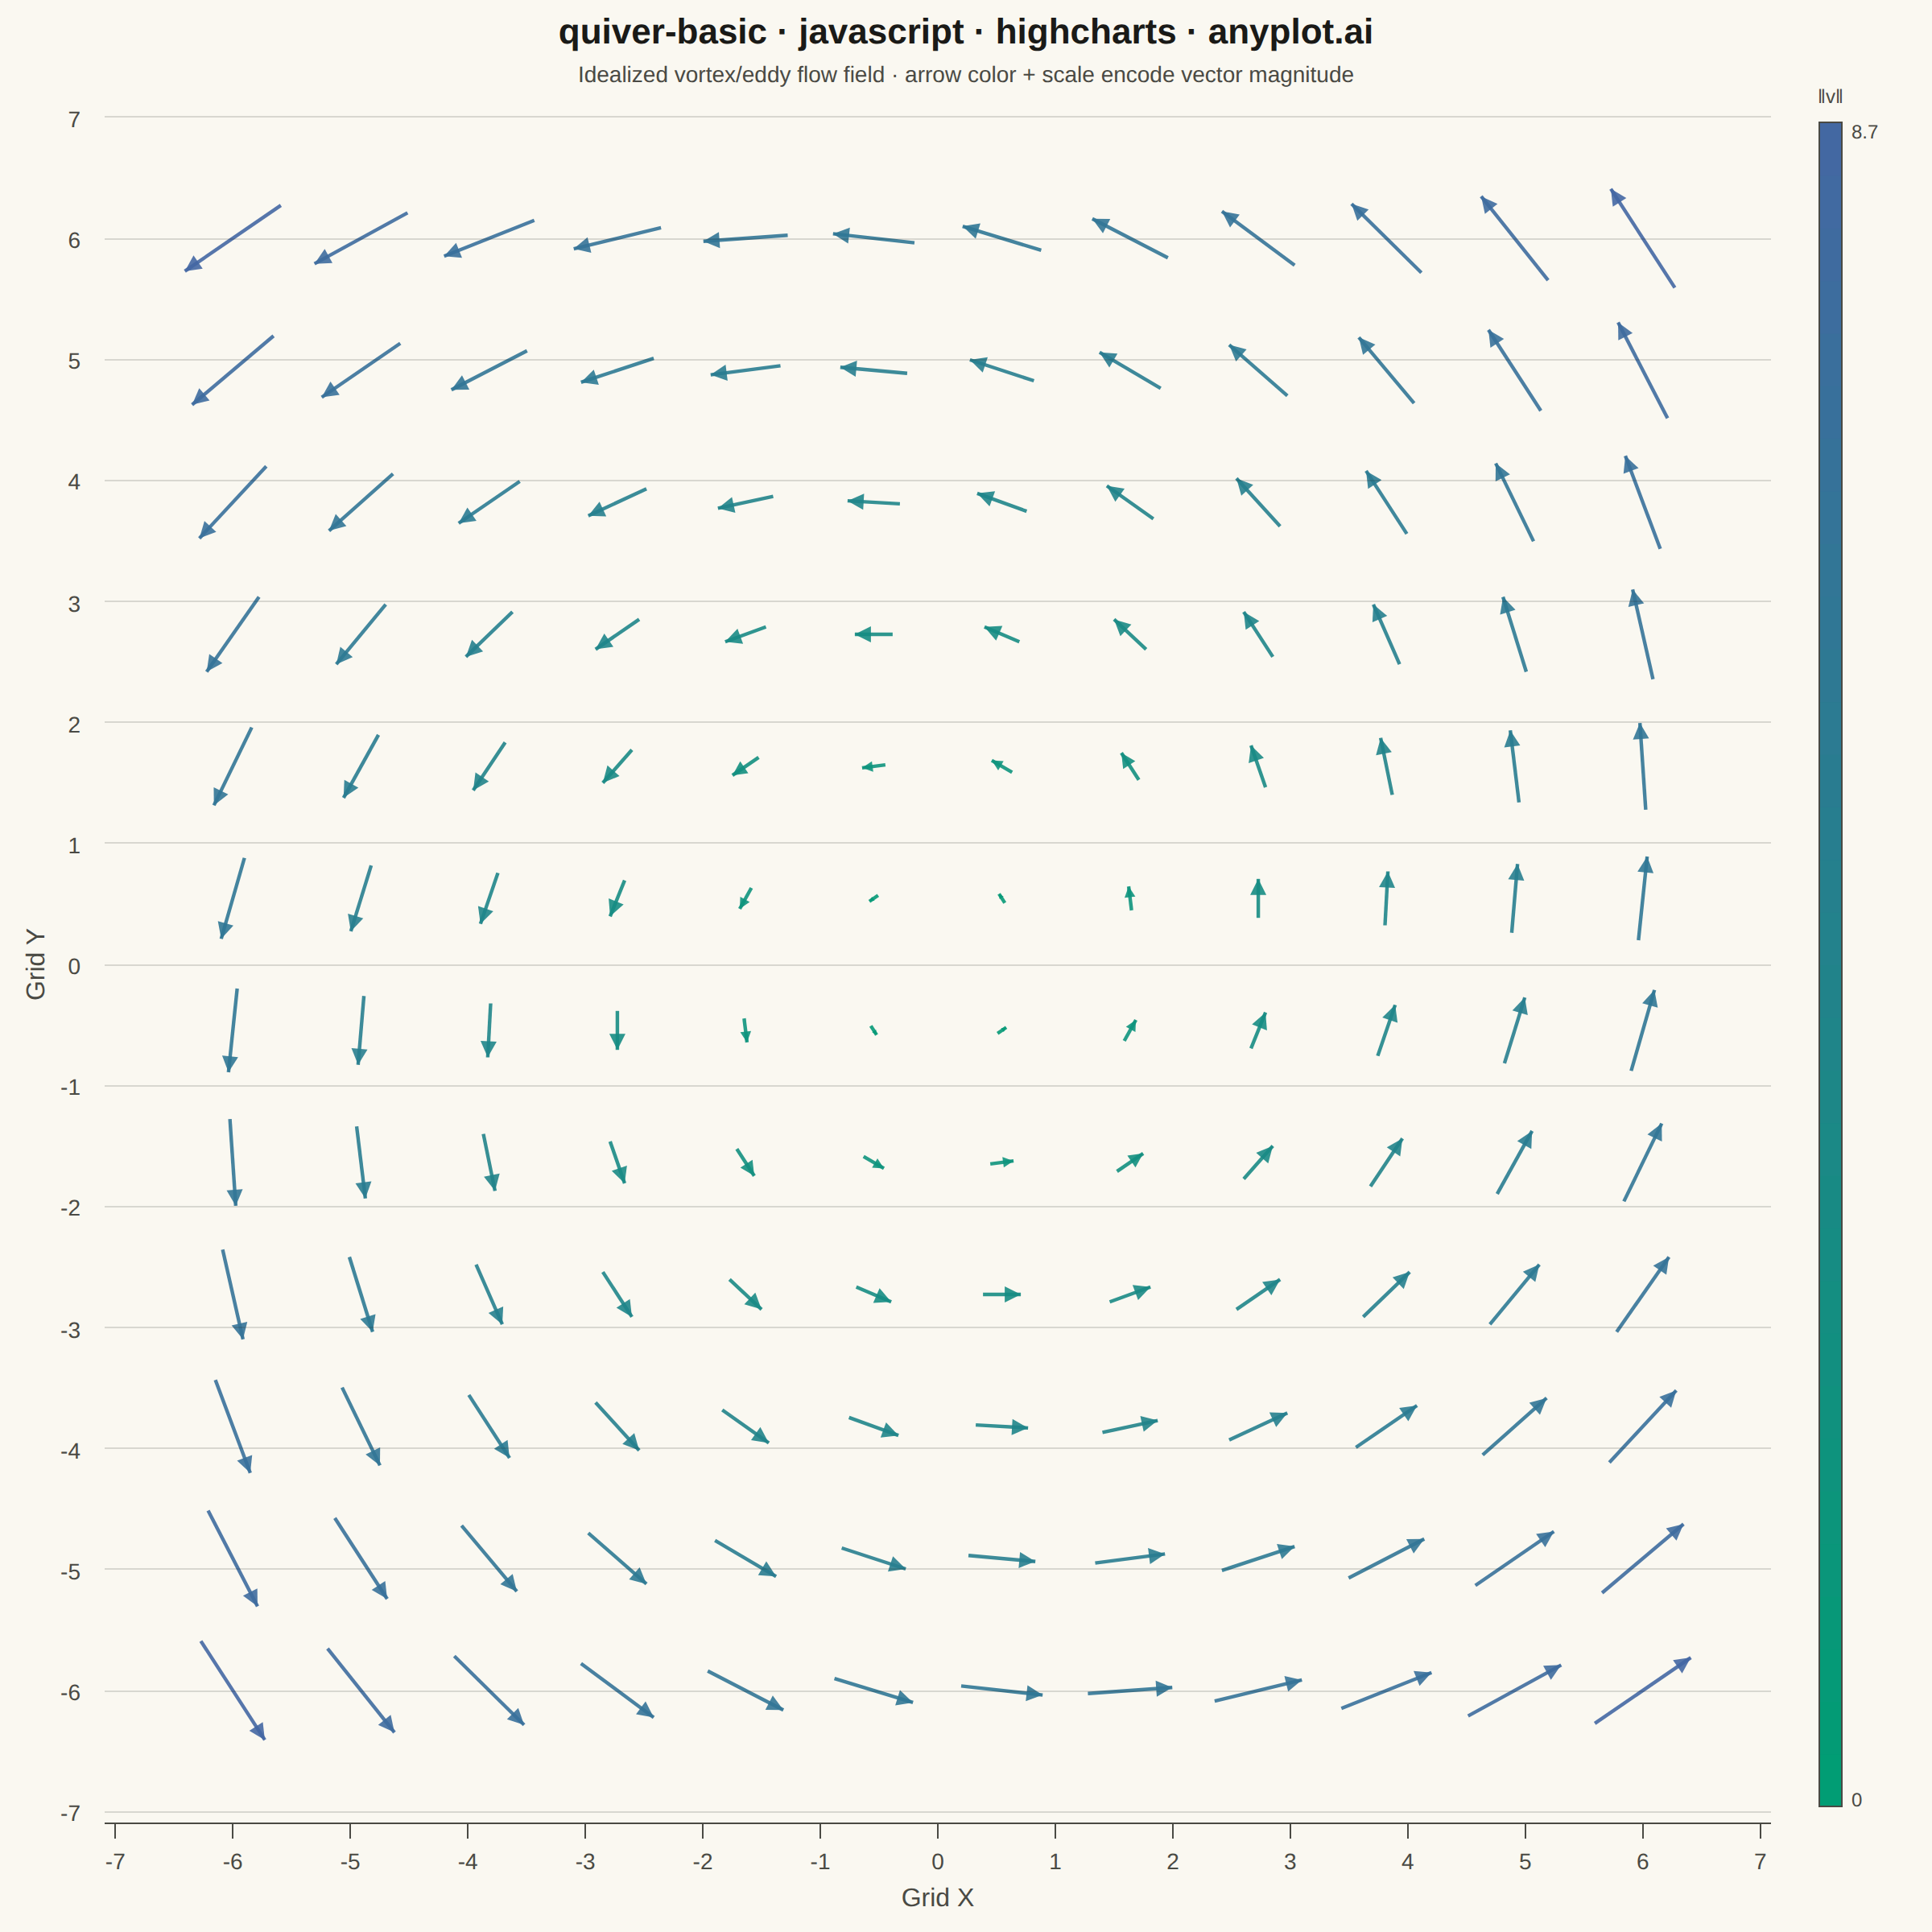
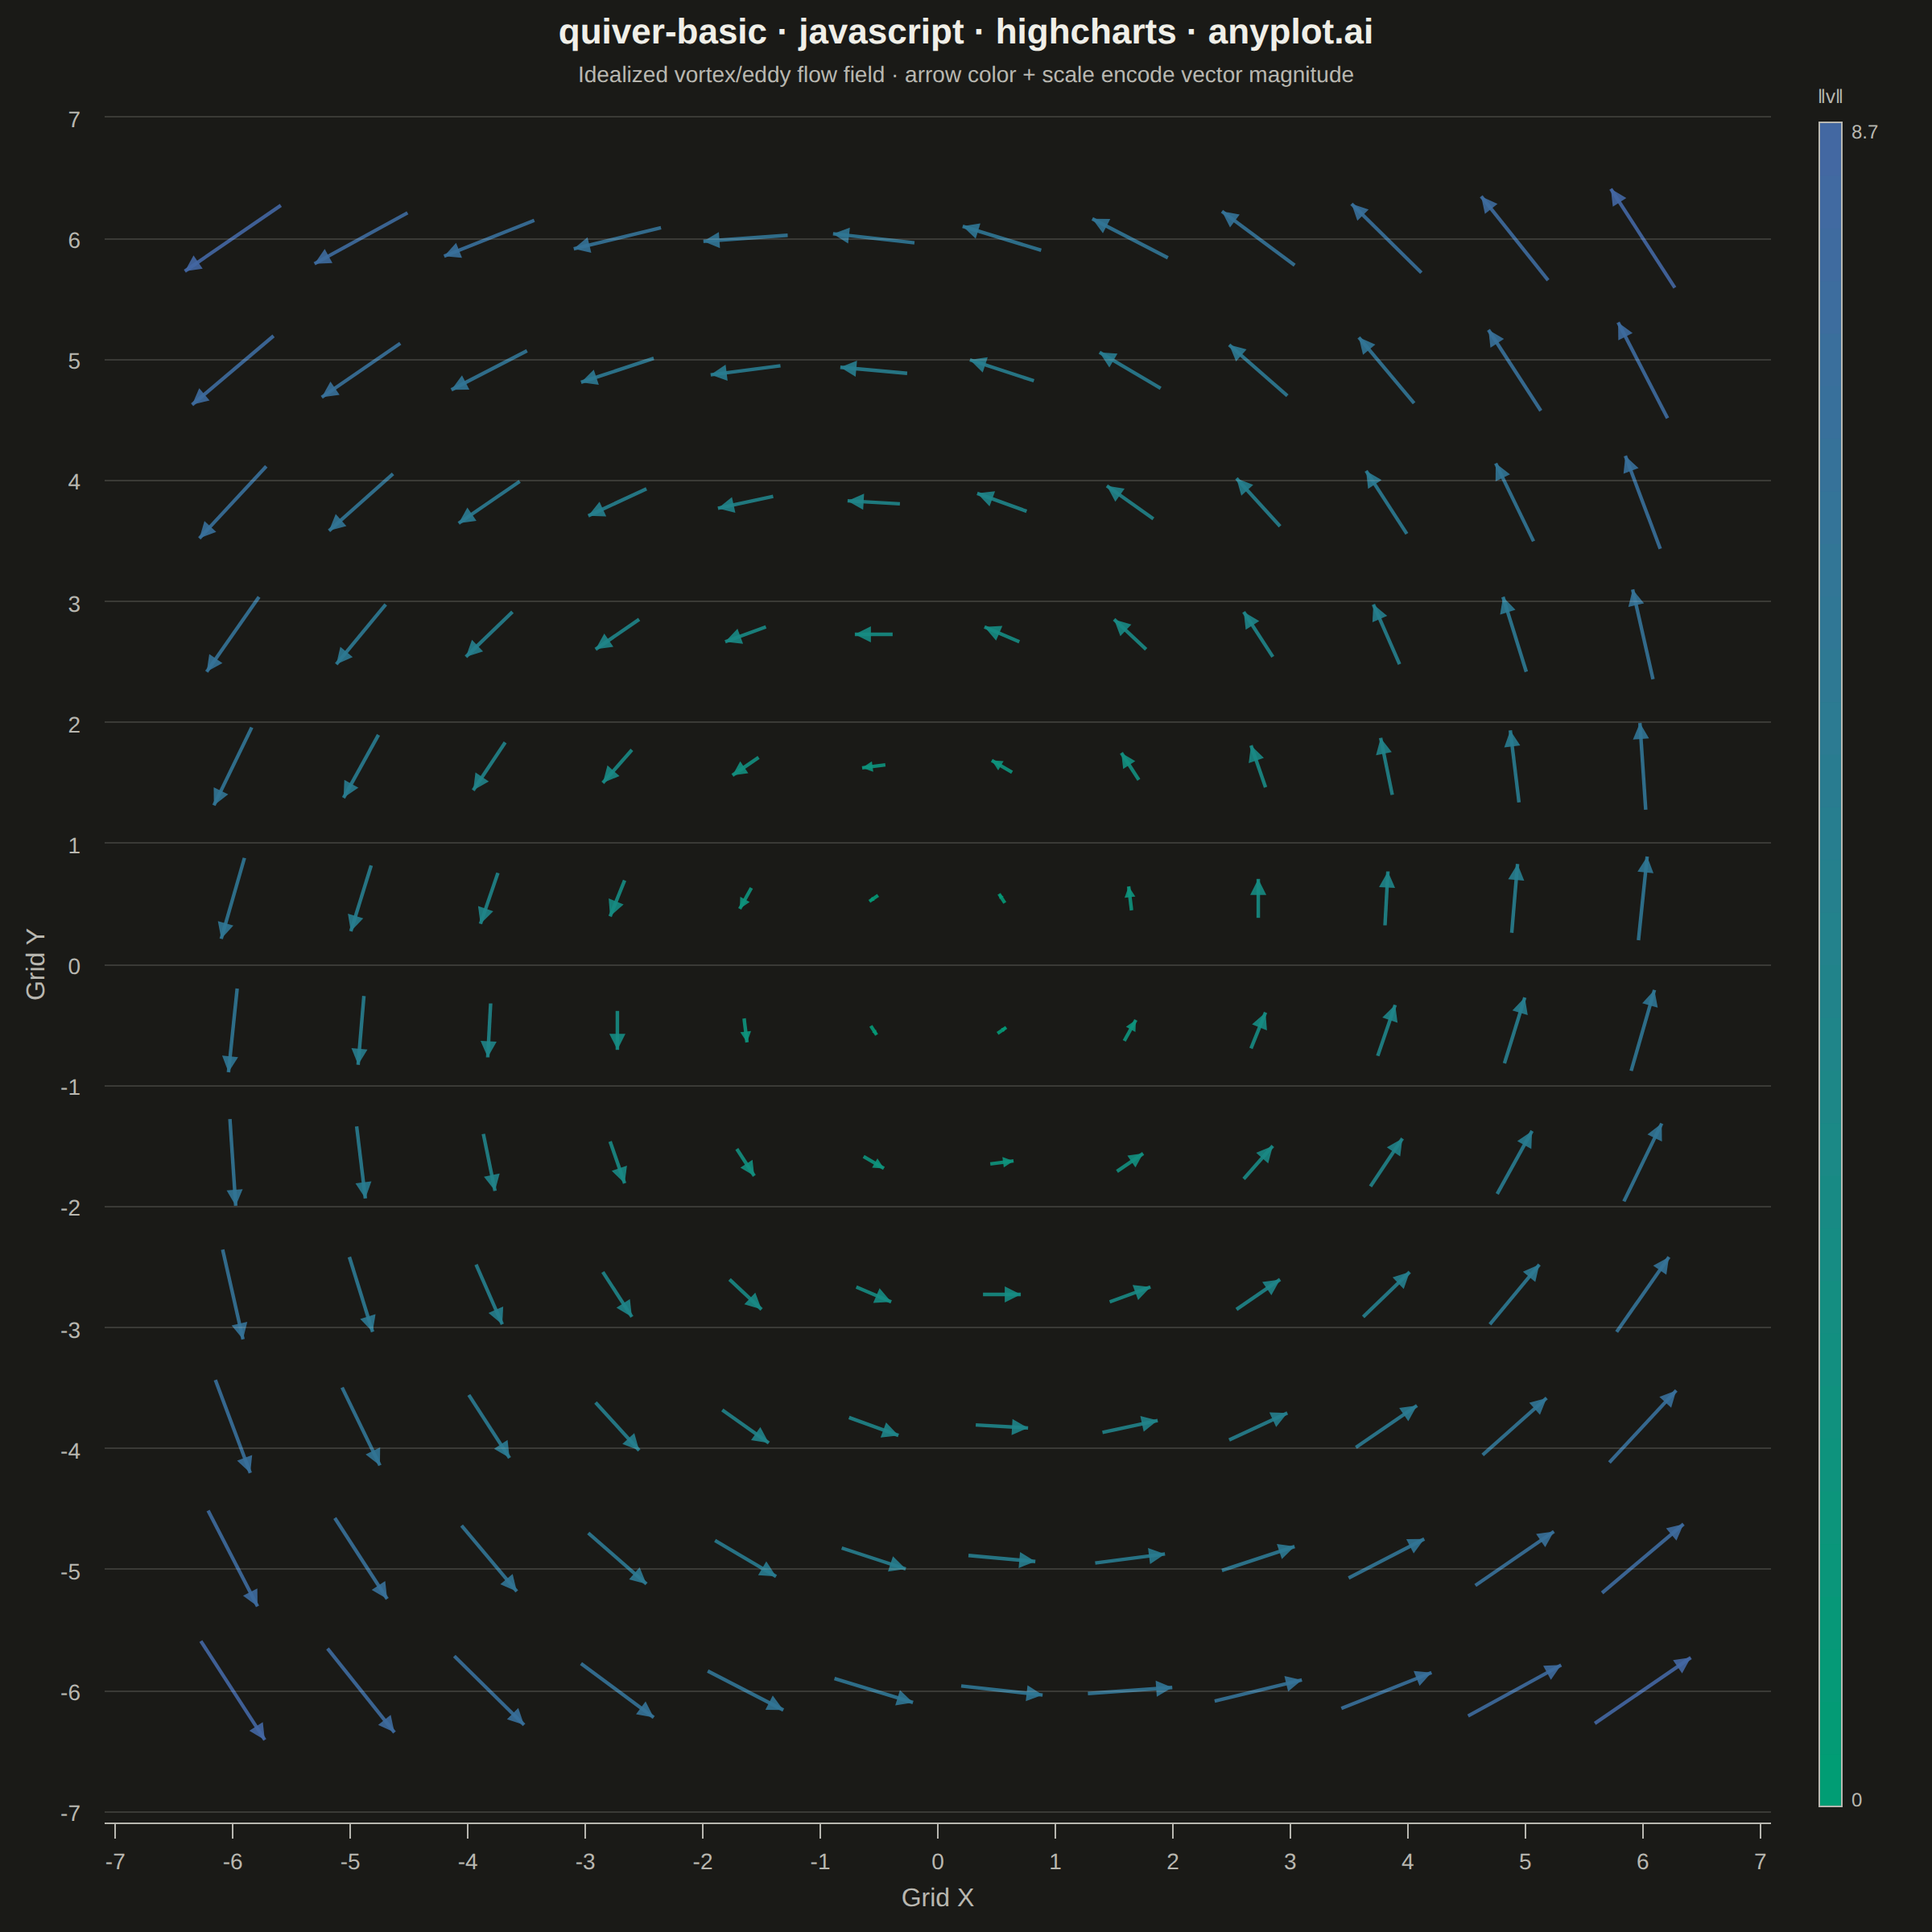
A quiver plot displays vector fields using arrows positioned at grid points. Each arrow represents a vector at that location, with direction indicating the vector's angle and length proportional to its magnitude. This visualization reveals flow patterns, gradients, and field structure in two-dimensional data.
// anyplot.ai
// quiver-basic: Basic Quiver Plot
// Library: highcharts 12.6.0 | JavaScript 22.23.1
// Quality: 92/100 | Created: 2026-07-24
//# anyplot-orientation: square

const t = window.ANYPLOT_TOKENS;

// Distinctive Highcharts feature: register a reusable custom arrowhead shape
// via the SVGRenderer symbol registry, then draw it with a rotation transform
// per vector — this is Highcharts' idiomatic mechanism for custom markers,
// not just a generic path drawn by hand.
Highcharts.SVGRenderer.prototype.symbols.quiverArrowhead = (x, y, w, h) => [
  "M", x, y,
  "L", x + w, y + h / 2,
  "L", x, y + h,
  "Z",
];

// --- Data: idealized vortex/eddy flow field u = -y + 0.2x, v = x + 0.2y, ---
// --- on a 12x12 grid (a rotating current with a slight outward drift, as ---
// --- seen in atmospheric/ocean eddies) -------------------------------------
const GRID = 12;
const EXTENT = 6;
const STEP = (2 * EXTENT) / (GRID - 1);

const vectors = [];
let maxMagnitude = 0;
for (let i = 0; i < GRID; i++) {
  for (let j = 0; j < GRID; j++) {
    const x = -EXTENT + i * STEP;
    const y = -EXTENT + j * STEP;
    const u = -y + 0.2 * x;
    const v = x + 0.2 * y;
    const magnitude = Math.hypot(u, v);
    maxMagnitude = Math.max(maxMagnitude, magnitude);
    vectors.push({ x, y, u, v, magnitude });
  }
}

// Scale every vector so the longest arrow spans ~90% of the grid spacing —
// keeps arrows from overlapping their neighbors regardless of field strength.
const ARROW_SCALE = (STEP * 0.9) / maxMagnitude;

// --- Color: imprint_seq (brand green -> blue), driven by vector magnitude -
const hexToRgb = (hex) => [1, 3, 5].map((i) => parseInt(hex.slice(i, i + 2), 16));
const [r0, g0, b0] = hexToRgb(t.seq[0]);
const [r1, g1, b1] = hexToRgb(t.seq[1]);
const colorForMagnitude = (magnitude) => {
  const f = magnitude / maxMagnitude;
  const r = Math.round(r0 + (r1 - r0) * f);
  const g = Math.round(g0 + (g1 - g0) * f);
  const b = Math.round(b0 + (b1 - b0) * f);
  return `rgb(${r}, ${g}, ${b})`;
};

// --- Chart ------------------------------------------------------------------
// The core bundle has no vector-field series type, so the axes below only fix
// the coordinate system; every arrow is drawn as a native SVG path through
// chart.renderer (toPixels() converts data coords to screen space) on each
// render pass — no add-on module, no other library involved.
Highcharts.chart("container", {
  chart: {
    backgroundColor: "transparent",
    animation: false,
    marginRight: 100,
    style: { fontFamily: "inherit" },
    events: {
      render() {
        if (this.arrowGroup) this.arrowGroup.destroy();
        this.arrowGroup = this.renderer.g("arrows").add();

        vectors.forEach(({ x, y, u, v, magnitude }) => {
          const dx = (u * ARROW_SCALE) / 2;
          const dy = (v * ARROW_SCALE) / 2;
          const x0 = this.xAxis[0].toPixels(x - dx);
          const y0 = this.yAxis[0].toPixels(y - dy);
          const x1 = this.xAxis[0].toPixels(x + dx);
          const y1 = this.yAxis[0].toPixels(y + dy);
          const color = colorForMagnitude(magnitude);

          this.renderer
            .path(["M", x0, y0, "L", x1, y1])
            .attr({ stroke: color, "stroke-width": 2.2, opacity: 0.9 })
            .add(this.arrowGroup);

          // Reusable arrowhead symbol, rotated to the vector's angle and
          // pivoted around its tip — Highcharts' renderer.symbol() registry
          // plus the rotation/rotationOriginX/Y transform is the idiomatic
          // way to place oriented custom markers.
          const angleDeg = (Math.atan2(y1 - y0, x1 - x0) * 180) / Math.PI;
          const shaftLength = Math.hypot(x1 - x0, y1 - y0);
          const headLength = Math.min(10, shaftLength * 0.45);

          this.renderer
            .symbol("quiverArrowhead", x1 - headLength, y1 - headLength / 2, headLength, headLength)
            .attr({
              fill: color,
              opacity: 0.9,
              rotation: angleDeg,
              rotationOriginX: x1,
              rotationOriginY: y1,
            })
            .add(this.arrowGroup);
        });

        // --- Magnitude color scale (reserved in the marginRight strip) ----
        if (this.magnitudeScale) this.magnitudeScale.destroy();
        this.magnitudeScale = this.renderer.g("magnitude-scale").add();

        const barX = this.plotLeft + this.plotWidth + 30;
        const barWidth = 14;
        const barTop = this.plotTop + 10;
        const barHeight = this.plotHeight - 20;
        const segments = 32;

        for (let s = 0; s < segments; s++) {
          const value = (maxMagnitude * (s + 0.5)) / segments;
          const segHeight = barHeight / segments;
          const segY = barTop + barHeight - (s + 1) * segHeight;
          this.renderer
            .rect(barX, segY, barWidth, segHeight + 0.5)
            .attr({ fill: colorForMagnitude(value), stroke: "none" })
            .add(this.magnitudeScale);
        }
        this.renderer
          .rect(barX, barTop, barWidth, barHeight)
          .attr({ stroke: t.inkSoft, "stroke-width": 1, fill: "none" })
          .add(this.magnitudeScale);

        this.renderer
          .text(maxMagnitude.toFixed(1), barX + barWidth + 6, barTop + 10)
          .attr({ align: "left" })
          .css({ color: t.inkSoft, fontSize: "12px" })
          .add(this.magnitudeScale);
        this.renderer
          .text("0", barX + barWidth + 6, barTop + barHeight)
          .attr({ align: "left" })
          .css({ color: t.inkSoft, fontSize: "12px" })
          .add(this.magnitudeScale);
        this.renderer
          .text("‖v‖", barX + barWidth / 2, barTop - 12)
          .attr({ align: "center" })
          .css({ color: t.inkSoft, fontSize: "12px" })
          .add(this.magnitudeScale);
      },
    },
  },
  credits: { enabled: false },
  colors: t.palette,
  title: {
    text: "quiver-basic · javascript · highcharts · anyplot.ai",
    style: { color: t.ink, fontSize: "22px", fontWeight: "600" },
  },
  subtitle: {
    text: "Idealized vortex/eddy flow field · arrow color + scale encode vector magnitude",
    style: { color: t.inkSoft, fontSize: "14px" },
  },
  xAxis: {
    min: -EXTENT - STEP,
    max: EXTENT + STEP,
    startOnTick: false,
    endOnTick: false,
    title: { text: "Grid X", style: { color: t.inkSoft, fontSize: "16px" } },
    lineColor: t.inkSoft,
    tickColor: t.inkSoft,
    gridLineColor: t.grid,
    labels: { style: { color: t.inkSoft, fontSize: "14px" } },
  },
  yAxis: {
    min: -EXTENT - STEP,
    max: EXTENT + STEP,
    startOnTick: false,
    endOnTick: false,
    title: { text: "Grid Y", style: { color: t.inkSoft, fontSize: "16px" } },
    lineColor: t.inkSoft,
    tickColor: t.inkSoft,
    gridLineColor: t.grid,
    labels: { style: { color: t.inkSoft, fontSize: "14px" } },
  },
  legend: { enabled: false },
  tooltip: { enabled: false },
  plotOptions: { series: { animation: false, enableMouseTracking: false } },
  series: [
    {
      type: "scatter",
      name: "Grid",
      data: vectors.map((p) => [p.x, p.y]),
      marker: { enabled: false },
      showInLegend: false,
    },
  ],
});
Runnable source as JSON, for any HTTP client: https://api.anyplot.ai/specs/quiver-basic/highcharts/code. Any spec id and library id listed in llms-full.txt fit the same URL shape; every URL below is complete and callable.
{
  "spec_id": "quiver-basic",
  "language": "javascript",
  "library": "highcharts",
  "page": "https://anyplot.ai/quiver-basic/javascript/highcharts",
  "hub": "https://anyplot.ai/quiver-basic",
  "code_json": "https://api.anyplot.ai/specs/quiver-basic/highcharts/code",
  "spec_json": "https://api.anyplot.ai/specs/quiver-basic",
  "render_light_png": "https://storage.googleapis.com/anyplot-images/plots/quiver-basic/javascript/highcharts/plot-light.png",
  "render_dark_png": "https://storage.googleapis.com/anyplot-images/plots/quiver-basic/javascript/highcharts/plot-dark.png",
  "interactive_light_html": "https://storage.googleapis.com/anyplot-images/plots/quiver-basic/javascript/highcharts/plot-light.html",
  "interactive_dark_html": "https://storage.googleapis.com/anyplot-images/plots/quiver-basic/javascript/highcharts/plot-dark.html",
  "quality_score": 92.0,
  "license": "MIT",
  "guide": "https://anyplot.ai/llms.txt"
}
Part of Basic Quiver Plot on anyplot.ai.